DOI: htp://dx.doi.org/10.21168/rbrh.v21n2.p377-390
Alfredo Ribeiro Neto, Larissa Ferreira David Romão Batista e Roberto Quental Coutinho
Universidade Federal de Pernambuco, Recife, PE, Brasil [email protected]; [email protected]; [email protected]
Recebido: 27/08/2015- Revisado: 11/12/2015- Aceito: 03/03/2016
ABSTRACT
Studies focusing on urban vulnerabilities due to river loods need the construction of hazard maps and deinition of potential lood areas. The objective of this article is to describe the development of a methodology for hazard mapping of river loods and to map areas susceptible to inundation on a municipal scale. The study area is the municipality of Ipojuca – Pernambuco State with area of 527.11 km2 and population of 80,637 inhabitants. The irst methodology uses the hydrologic-hydraulic simulation for the lower course of the Ipojuca River using the HEC-HMS and HEC-RAS models. The streamlow calculated in the rainfall-runoff model is used as input for the hydraulic model, to simulate the water surface proile in the river. This makes it possible to calculate the water depth and low velocity, the key elements for the deinition of hazard indicators. The results of the hydraulic model were used to generate the hazard indicators: water depth, low velocity, combination of depth and velocity, energy head, low force and intensity (low velocity x water depth). The other method-ology seeks to identify areas with potential for inundation considering the entire territory of the municipality. Topographic index of the region and a distance cost matrix (which uses slope and drainage) are the auxiliary variables for determination of this map. Both variables use the digital terrain model. Analysis of risk is essential for planning and intervention in areas susceptible to inundation. Both characterizations of hazard and vulnerability are needed to evaluate risk. The results of the study in Ipojuca can be used for hazard characterization.
Keywords: Natural disasters. Hazard map. Hydrological modelling.
Estudos envolvendo vulnerabilidade de cidades à inundações necessitam do mapeamento de perigo e das áreas com potencial para inundação. O objetivo do artigo é desenvolver metodologia para mapeamento de indicadores de perigo e áreas inundáveis na escala de município. A área de estudo é o município de Ipojuca no Estado de Pernambuco com área de 527,11 km² e uma população de 80.637 habitantes. A primeira metodologia consiste na simulação hidrológi-ca-hidráulica para o baixo curso do rio Ipojuca com uso dos modelos HEC-HMS e HEC-RAS. A vazão gerada no modelo hidrológico do tipo chuva-vazão é utilizada como entrada do modelo hidráulico que simula o peril da linha d’água no rio para a região de interesse. Com o peril da linha da água, pode-se determinar a profundidade e a velocidade da água, que são elementos chave para a deinição de indicadores de perigo. Com os resultados do modelo hidráulico, geraram-se seis indicadores de perigo: profundidade da água, velocidade do luxo, combinação profundidade e velocidade, carga de energia, força do escoamento e intensidade (velocidade x profundidade). A outra metodologia procura identiicar as áreas inundáveis de todo o território do município. Para isso, faz-se uso do índice topográico da região e de uma matriz de custo de distância (que utiliza declividade e hidrograia), todos calculados com o modelo digital do terreno. A análise de risco é essencial para o planejamento e intervenção em áreas sujeitas a inundações. Para se avaliar risco, é necessária a caracterização do perigo e da vulnerabilidade. Os resultados do estudo em Ipojuca podem ser utilizados para a caracterização do perigo principalmente.
Palavras Chave: Desastres naturais. Mapa de perigo. Modelagem hidrológica.
Methodologies for generation of hazard indicator maps and lood prone areas:
municipality of Ipojuca/PE.
Metodologias para Geração de Mapa de Indicadores de Perigo e Áreas Inundáveis: Município de Ipojuca/PE
INTRODUCTION
The proximity to watercourses determines the location of numerous human settlements evolving into the cities of today. Water supply, irrigation and transport are only some examples of beneits (TURRERO et al., 2013). Proximity to watercourses as well as other more modern risk factors, such as unplanned urbanization, ends up highlighting and maximizing the risks and disasters (VIGLIONE et al., 2014).
The theoretical basis on the theme of natural disas-ters is vast and diverse, consisting of numerous concepts and methodological practices. But even if there is no universal standard, it is possible to identify some guidelines to qualitative and quantitative categories of disasters and their components. The starting point is the disaster itself, which is characterized by changes originating from the interaction between hazardous natural phenomena and the characteristic conditions of a commu-nity, resulting in negative impacts on people, the economy, the environment, the municipal infrastructure, and public health, among other factors. The possibility of occurrence of this kind of situation creates the risk (LAVELL et al., 2012), repeatedly deined by the association between hazard and vulnerability (BIRKMANN, 2006; BIRKMANN et al., 2013; MERZ et al., 2010, GOERL et al., 2012). For Stephenson (2002), hazard is obtained by the product of water depth and low velocity; and risk is the probability associated to hazard occurrence. In the risk analysis, the Intergovernmental Panel on Climate Change (IPCC) also adds the exposure factor to vulnerability and hazard (LAVELL et al., 2012).
The extent of losses that an element might suffer due to geographic location deines its exposure. The danger is deined by the presence of an extreme natural and potentially hazardous event (lood in the case of this study). For the classiication of hazard, in addition to occurrence, the possibility of injury, loss and damage must also be taken into account (LAVELL et al., 2012). Vulnerability, in turn, is determined by the proile of the affected population.
According to Merz et al. (2010), vulnerability is described as the result of the sum of exposure, susceptibility and capacity for response. Birkman et al. (2013) also deined this structure and highlighted the multidimensional, dynamic, complex and broad nature of the concept and components of vulnerability. This is evidenced by the intrinsic character of vulnerability in the composition of the community.Adger (2006) states that these components are translated into the skills of dealing with, recovering from, or resisting hazard situ ations, together with an understanding developed by the United Nations for what can be called resilience (UNISDR, 2009). Given this vast quantity of components, ranging from individuals to whole communities, Zhou et al. (2014) justify the lack of uniformity in deining the concept of vulnerability and the dificulty in establishing measurement methods in analyses of different scales.
An important aspect in mapping hazard and vulnera-bility is the deinition of the physical indicators. With regard to hazard indicators, more speciically, might include water depth, low velocity, duration, lood routing, water rising rate and ex
-tent of the looded area (the most common in map generation) (MOEL et al., 2009).
Kreibich et al. (2009) and Thieken et al. (2005) applied hazard indicators in a huge lood that occurred in the Elba and Danube rivers in August 2002. Return periods even exceeded 500 years at some tributaries of the Elbe River (THIEKEN et al., 2005). The study by Kreibich et al. (2009) sought to deine the relevance of the parameters of impact for the losses deri-ved from the lood. Data sets were collected from interviews and post-event ield surveys. 2D hydraulic simulations for the events of 20, 50 and 100 years of return period were designed to provide information about water depth and velocity used in risk mapping and cost-beneit analyses. On the other hand, the study by Thieken et al. (2005) examined the damage to properties with data obtained from interviews collected after the 2002 lood event. The survey investigated a number of indicators, with emphasis on hazard, but also covering vulne-rability. These indicators were water depth, velocity, duration, water contamination, warning systems, emergency measures, forecasting measures, experience from previous events and the socioeconomic status of the population.
Merz et al. (2007) propose a methodology that divides vulnerability into exposure and susceptibility. The study includes key elements for risk classiication. The irst component, expo -sure, is quantiied by the number of exposed elements, that is, the quantity of buildings in the lood prone area. The second item, susceptibility, is characterized by relative damage func-tions, answering the question “How will the affected elements be damaged?” The estimated degree of damage to buildings is based on analysis of inancial loss associated with the use of the building and lood depth, translated into depth-damage curves.
In Brazil, it is worth mentioning the studies by Goerl et al. (2012), who used census data to deine a vulnerability index; Monteiro and Kobiyama (2013), who used hydrological and hy -draulic models to estimate the hazard in the Braço do Baú basin in Santa Catarina; Machado et al. (2005) with the development of a damage x depth function for the municipality of Itajubá in Minas Gerais; and Zonensein (2007), who proposed a lood risk index applied to the Joana River basin in Rio de Janeiro, based on indicators such as inadequate sanitation, trafic, income and household density.
prone areas on a municipal scale. This information can be used in the planning of the land occupation expansion in documents such as geotechnical charts and urban drainage master plans, especially in municipalities under pressure due to the process of population growth and urbanization, as in the case of Ipojuca.
This study was developed under an agreement between the Ministry of Cities and GEGEP/UFPE in the project “De -velopment of geotechnical charts of suitability to urbanization in municipality of Ipojuca in the Metropolitan Region of Recife, Pernambuco state” (COUTINHO, 2014).
METHODOLOGY
Study area
The municipality of Ipojuca in the Metropolitan Region of Recife covers an area of 527.11 km², has a population of 80,637 (IBGE, 2010), is located 49 km from the state capital, and within its boundaries contains the estuary of the Ipojuca River. Ipojuca has an outstanding tourist and economic potential, including some of the most popular beaches on the southern coast of Pernambuco and the Suape industrial and port complex.
With respect to the municipality’s environmental and physical aspects, it has a wet tropical climate with dry summers and a rainy season beginning in the autumn and winter months (April-August), with an annual average rainfall of more than
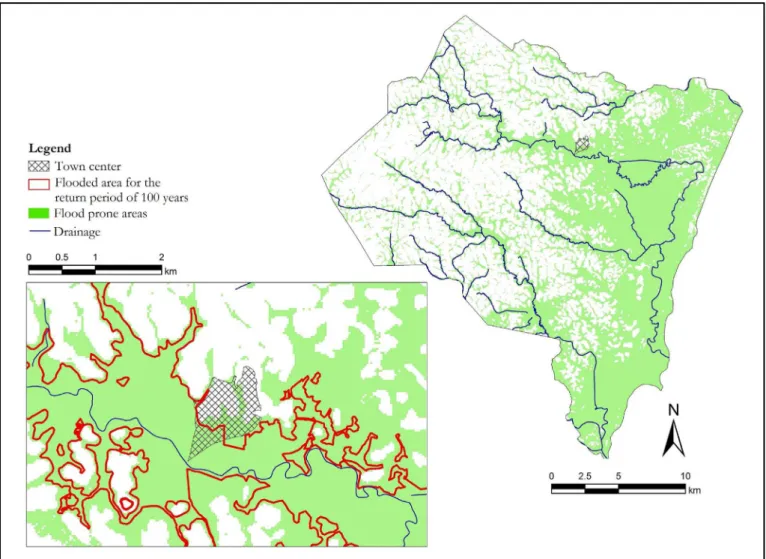
1300 mm. The relief terrain with reworked surfaces of deep valleys consists basically of hills in the coastal region (MAS -CARENHAS et al., 2005). Figure 1 shows the location of Ipojuca municipality in Pernambuco and the boundary of the Ipojuca River basin covering an area of 3,435.34 km2. Figure 2
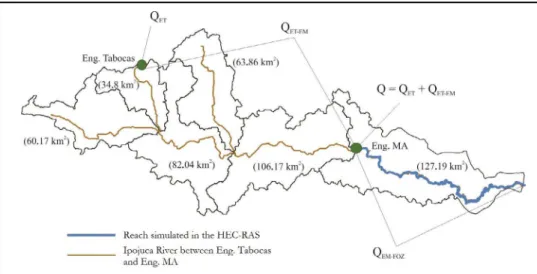
highlights the drainage basin of the Ipojuca River considered in the hydrological simulation, covering an area of 474.23 km2.
Figure 2 – Area of the Ipojuca river basin simulated by the models
Digital Terrain Model (DTM)
The altimetry of the study area is necessary to delineate the sub-basins for hydrological modeling, to characterize the geometry of the Ipojuca River and to generate a map of the lood prone areas. Two types of altimetry data were used.
Characterization of the geometry of the Ipojuca River was based on the DTM, produced with data from Condepe/ Fidem on a scale of 1/25,000, together with ield surveys. The resulting DTM has a spatial resolution of ive meters.
The other DTM is the result of the Shuttle Radar Topography Mission (SRTM) project. The Brazilian National Institute for Space Research (INPE) accomplished corrective and standardizing work of the SRTM data, eliminating “NoData” pixels, shadows and distortions. The data corrected by INPE, called Topodata, were also resampled to a 30-meter resolution, allowing a better use of the information (VALERIANO et al., 2009). The Topodata DTM was used as input for the dis -cretization of the sub-basins and calculation of the slope and topographic index.
Hydrological simulation
The HEC-HMS (Hydrologic Modeling System) (FELD -MAN, 2000) simulates the transformation of rainfall into runoff and natural and controlled propagation processes (e.g. rivers and canals with hydraulic structures). The HEC-HMS model consists of the following components: i) calculation of losses (interception in vegetation and soil surface); ii) separation of the low; iii) baselow, and iv) river low propagation. The parameters related to these methods are the sub-basin area, time of con-centration, loss factors through iniltration, evapotranspiration and river cross sections. The HEC-HMS model uses the Curve Number and the triangular unit hydrograph, developed by the U.S. National Resources Conservation Center, to determine the design hydrograph in the reach under study.
The pre-processing activities of the input data for the
HEC-HMS hydrological model consist of discretisation and delineation of the area into sub-basins, determining the length of the longest watercourse, length of the main river and diffe-rence in elevation between the farthest point from the largest watercourse and the outlet of the sub-basin. This information is used to calculate the time of concentration of each sub-basin using the Kirpich equation (TUCCI, 1998):
385 , 0 3
c
57
L
H
t
1
0,7721 1124 , 0 21 t T 97 , 1423 i (2)Energy head = y + v2/2g (3)
Indicatorfor flow force = y. v2 (4)
Intensity = v. y (5)
i i tg a ln IT 6
Cellnorm = (Cell-MinValue)/(MaxValue-MinValue) 7
Cellnorm = (MaxValue-Cell)/(MaxValue-MinValue) 8
(1)
where
tc is the time of concentration in min
L is the length of the largest watercourse in km H is the difference in level between the highest and lowest points of the basin in meters
For the process of watershed delineation, the Topodata was used with a 30-meter resolution. In the operations, the ge -oprocessing package ArcGIS 10.1 was used together with the ArcHydro 2.0 extension (MAIDMENT, 2002). Figure 3 shows the area simulated with discretisation in sub-basins (whose areas are shown in brackets). These simulations need the design rainfall as an input for the selected return period, which, for this study, was 100 years.
Hydraulic simulation
The hydrodynamic model HEC-RAS (USACE, 2012) facilitates the simulation of streamlows in natural (rivers) or artiicial (e.g., irrigation canals) channels. This software enables the calculation and hydraulic analysis of one-dimensional steady and unsteady low. In the unsteady low simulation, the model applies complete Saint-Venant equations and the Preissmann’s four point implicit inite difference scheme (BRUNNER, 2010). In the steady low simulation, the model calculates the proile of the water surface, solving the energy equation by using the
Figure 3 – Input streamlows scheme in the HEC-RAS: QET is the maximum low obtained from the statistical analysis of the Eng. Tabocas series; QET-EM is the maximum incremental streamlow of the area between Eng. Tabocas and Eng. Maranhão obtained from HEC-HMS and QEM-FOZ is the maximum incremental streamlow of the area between Eng. Maranhão and the mouth, obtained with
Standard Step method. The simulation in this study was done in steady low and the downstream boundary condition is the option “Normal Depth” calculated by the Manning equation. Since this is a one-dimensional model, the hydraulic variables such as water depth and velocity refer to average conditions in the cross section.
The input data of the HEC-RAS model is pre-processed in the package ArcGIS 10.1. The HEC-GeoRAS extension, also developed by USACE, permits representation of the main river channel and river banks, in addition to the cross sections from which the geometric characteristics will be taken using DTM.
The HEC-RAS hydrodynamic model was simulated in the reach between the Engenho Maranhão streamgauge and the mouth of the river (~30 km). The upstream boundary con -dition must be the streamlow in the EngenhoTabocas station (39360000) plus the lateral contribution between Eng. Tabocas and Eng. Maranhão (see Figure 3). Moreover, the incremental discharge in the reach between Eng. Maranhão and the mouth also had to be determined. In both cases, the incremental dis -charge was calculated with the HEC-HMS model.
The series of streamlow data of the Engenho Tabocass -treamgauge was used to deine the annual maximum discharge in this section for different return periods. The series, available in the Brazilian National Water Agency database, from January 1967 to December 2006 was used. The series provides 38 annual values of daily maximum streamlow. Gumbel’s distribution function was it to calculate the streamlow corresponding to the 100-year return period. This was not done for Engenho
Maranhão because its series is too short for a statistical analysis. Table 1 shows the streamlow values of Figure 3 referring to the 100-year recurrence.
Table 1 – Input streamlowsin theHEC-RAS model
Streamlow Value (m3/s)
QET 413.73
QET-EM 873.00
QET + QET-EM 1286.73
QEM-FOZ 340.50
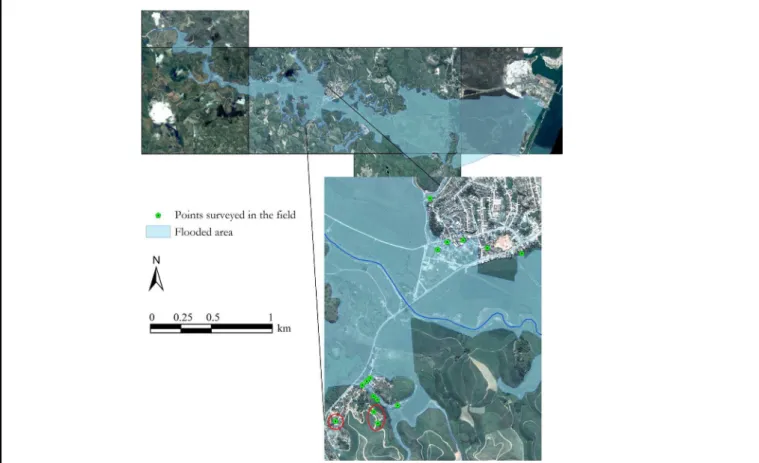
After the steady low simulation with the HEC-RAS model, looded area maps were prepared for the 100-year return period. To assess whether the maps produced are consistent with past events, a ield survey was made to identify different points referring to the boundaries of the area affected by the lood event in June 2010. Eighteen points were surveyed along the Ipojuca River, with greatest emphasis on the region of the city of Ipojuca.The points were identiied with the help of the residents in the affected places.
Using the time series of the Engenho Tabocas stream-low, we conirmed that the June 2010 lood event had a return period of approximately 150 years, with recorded low of 441
m3/s. The points surveyed in the ield were compared to the
map produced, based on the HEC-RAS simulation with the 100-year return period. The distance between each point and the boundary delineated by the map was regarded as an error. The average error of the 18 points was 48.11 meters long on the plane. There are some points where it is not clear if the lood came from the main channel of the Ipojuca River or from its small tributaries. The points highlighted in the Figure 4 are examples of this situation (red circle). If these points are removed from the calculation, the average error decreases to 18.59 meters.
Cross sections
Hydraulic modeling requires bathymetric information about the cross sections of the river with an altimetric referen-ce, to enable the determination of not only the area and wet perimeter, but also the longitudinal gradient of the riverbed. For this reason, an altimetric survey was carried out to determine the reference level of the Engenho Maranhão streamgauge station (shown in Figure 3). The elevation of the zero level in the streamgauge is able to be determined and, consequently, the elevation of the cross section in relation to sea level.
In addition to the Engenho Maranhão station, it was necessary to survey two other cross sections for better repre-sentation of the geometry and the bottom river slope, as shown in Figure 2.
Design storm
Instead of using a set of raingauge data, the design storm was deined using the intensity-duration-frequency equa -tion determined by Ramos (2010), with pluviographic data from Recife airport. The equation is as follows.
385 , 0 3 c
H
L
57
t
1
0,7721 1124 , 0 21 t T 97 , 1423 i (2)Energy head = y + v2/2g (3)
Indicatorfor flow force = y. v2 (4)
Intensity = v. y (5)
i i tg a ln IT 6
Cellnorm = (Cell-MinValue)/(MaxValue-MinValue) 7
Cellnorm = (MaxValue-Cell)/(MaxValue-MinValue) 8
(2)
where
i is rainfall intensity in mm/h T is return period in years
t is duration of the rainfall in minutes
This equation was used to calculate the design storm. According to Porto Alegre (2005), a design storm is the critical event generated artiicially based on the statistical characteristics of natural rainfall and on the parameters of response of the catchment area. These elements are represented by the return period of the design storm in years and the critical duration of the event (adopted here as twice the time of concentration). The time distribution of the rainfall was based on the methodology described by Porto Alegre (2005). The so-called alternating block method distributes the precipitation over time to ind a critical rainfall scenario. This scenario is based on slight and medium precipitation at the beginning and end of the time and heavy precipitation in the middle of the duration, producing high peak low hydrographs.
Parameter CN
The parameter CN of the Curve Number method is a function of land use and soil type in the catchment area. Land use was obtained from Landsat images. The satellite image was classiied using SPRING software, where the maximum likelihood method was used. From the classiication result, the following land use classes were identiied: water, forest, bare soil/urban area and pasture combined with crops.
The soil type, the other information required to dei -ne the parameter CN, was obtai-ned from the map on a scale 1:100,000, produced by the Pernambuco State Agro-Ecological Zoning project (ZAPE). The soil group classiication was carried out based on the method presented by Sartori et al. (2005), in which the hydrological group of the soil is deined based on the soil type.
The next step was to combine the land use and soil group maps to deine the value of the parameter CN. The U.S. Department of Agriculture’s Technical Release 55 (USDA, 1986) presents tables that relate the values of CN with classes resulting from the combination of the land use and soil group maps.
In the water and mangrove areas, the value of CN is 100, assuming that in these classes all rainfall causes surface runoff. The area of the classes is used as a weighting factor to reach the inal CN in each sub-basin (the values vary between 58.5 and 68.5).
Hazard areas mapping
According to UNISDR (2009), hazard is described as the frequency of occurrence of different intensities for different areas based on historical data. Tominaga et al. (2009) state that hazard refers to the probability of a potentially damaging natural phenomenon or process occurring in a certain place over a spe-ciied time. Considering these concepts, the idea is to generate a hazard map for the areas adjacent to the Ipojuca River, using indicators based on water depth and low velocity provided by the HEC-GeoRAS (extension of pre and post-processing of the HEC-RAS model).
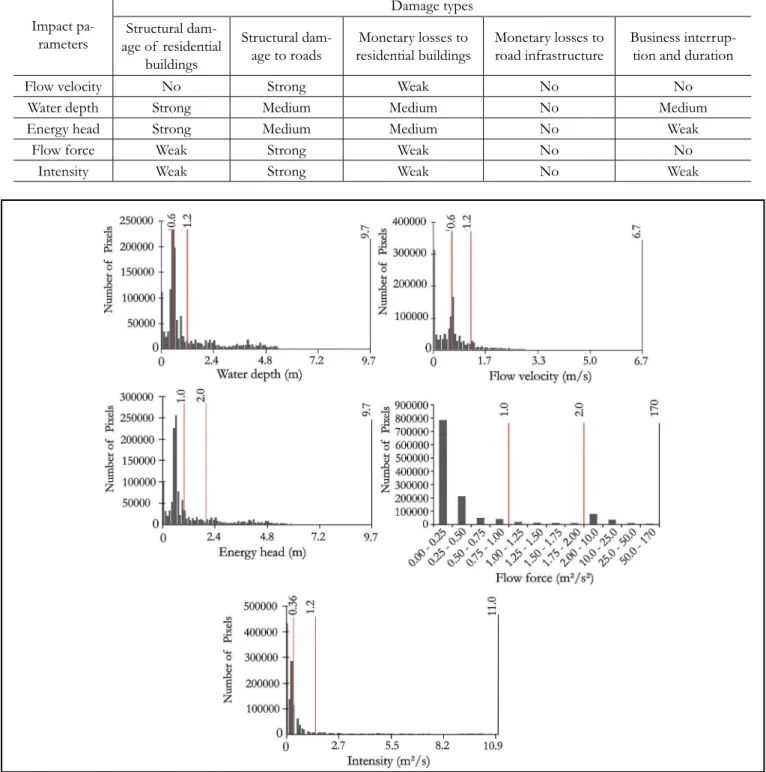
Alternatively, we deined indicators that could represent or are related to water energy. Kreibich et al. (2009) argue for the use of other variables derived from the water depth and low velocity to relate to the structural damage to houses, ro -ads, inancial losses and business interruption. The suggested indicators are as follows:
Energy head = y + v2/2g (3)
Indicator for low force = y. v2 (4)
Intensity = v. y (5)
where
yis water depth (m) vis low velocity (m/s)
Table 2 shows which indicator has the strongest inluence on damages caused to different types of land use (KREIBICH et al., 2009).
According to Wright (2008), loods with water depth more than 0.60 meters or low velocity over 1.2 m/s result in deinitive hazard for people. These values were used for Ipo -juca River as a basis for deining three levels of severity of the lood related to water depth and low velocity. Figure 5 shows the histograms with simulated values for water depth and low velocity in the study area, together with the thresholds values:
0.6 and 1.2 meters and 0.6 and 1.2 m/s. The two maps were reclassiied attributing a value of 1, 2 and 3 for depths of 0-0.6 m, 0.6-1.2 m and over 1.2m, respectively, and for low velocities of 0-0.6 m/s, 0.6-1.2 m/s and over 1.2 m/s, respectively. For water depth, the value (0.60 m) and the double of this value were adopted as thresholds for deining the classes. In the case of low velocity, it was decided to use the threshold (1.2 m/s) and its half. These thresholds constitute a class with a well-balanced frequency distribution, as shown in Figure 5.
A similar procedure was adopted to deine the threshol
-Impact pa -rameters
Damage types Structural dam
-age of residential buildings
Structural dam -age to roads
Monetary losses to residential buildings
Monetary losses to road infrastructure
Business interrup-tion and durainterrup-tion
Flow velocity No Strong Weak No No
Water depth Strong Medium Medium No Medium
Energy head Strong Medium Medium No Weak
Flow force Weak Strong Weak No No
Intensity Weak Strong Weak No Weak
Figure 5 – Histograms with indicator values
384 DOI: htp://dx.doi.org/10.21168/rbrh.v21n2.p377-390
ds of the other indicators in Figure 5. According to Kreibich et al. (2009), the values representing a signiicant increase in damage in the region affected by the lood are two meters for the energy head (Eq. 3), 2 m3/s2 for the low force (Eq. 4) and
1.5 m2/s for the intensity (Eq. 5). Table 3 shows the thresholds
used to deine the low, medium and high hazard classes for the adopted indicators.
Table 3 – Thresholds of indicators to build a hazard map
Indicator Low Medium High Water depth (m) 0-0.60 0.60-1.20 > 1.20 Flow velocity (m/s) 0-0.60 0.60-1.20 > 1.20 Energy head (m) 0-1.0 1.0-2.0 > 2.0 Flow force (m3/s2) 0-1.0 1.0-2.0 > 2.0
Intensity (m2/s) 0-0.36 0.36-1.50 > 1.50
Definition of the flood prone areas
The second methodology adopted provides an overview of the Ipojuca municipality with regard to its susceptibility to looding. Physical indicators are used to help explain in nume -rical terms the extent of this degree of susceptibility. Studies carried out in other countries have been taken as a reference, with indicators such as land use, soil type, land cover, slope, proximity to watercourses, low accumulation and land elevation (PRADHAN, 2009; SANTANGELO et al., 2011; MORAES et al., 2014).
In the application to the municipality of Ipojuca, the lood prone areas were deined with two maps:
topographic index distance cost matrix.
The topographic index of the hydrological Topmodel (BEVEN et al., 2012) represents the potential of a point in the basin to saturate. This is a function of the low accumulation and slope in the point.
(6)
where
IT is the topographic index;
ai is accumulated drainage area upstream in m2,
tgbi is the topographic gradient given by the slope of the terrain in degrees.
The second map used - the distance cost matrix - gives to each pixel a displacement cost value to the hydrography and weighs it with the value of the slope terrain. The cost has a direct relation with the terrain slope and with the distance to the river or canal. The cost may represent the susceptibility to looding because the lower the cost, the easier to accumulate water. The result of the operation will be a matrix in which each cell con-tains the value of the lowest distance cost between the point and the watercourse. This operation was made in the package ArcGIS 10.1. Details about the calculation of the distance cost
matrix can be obtained in ESRI (2016).
The maps used to identify lood prone areas have different ranges of variation in the values. To overcome this characteristic and permit the later combination of these maps, they were normalized so that the inal scale indicates that the closer the pixel is to 1, the more susceptible the area is to loo -ding, and the closer to 0 the less susceptible.
Equation 7 is used to normalize the values of the topographic index (increase in value of the original variable indicates more susceptible to looding).
Cellnorm = (Cell-MinValue)/(MaxValue-MinValue) (7)
Equation 8 is used to normalize the values of the dis-tance cost matrix (the increase in value of the original variable indicates less susceptibility).
Cellnorm = (Max Value-Cell)/(Max Value-MinValue) (8)
where
Cellnorm is the normalized value
Cell is the original value of the pixel Max Valueis the pixel with highest value Min Valueis the pixel with lowest value
Equal weights were used to match the two normalized maps.
RESULTS AND DISCUSSION
Hazard map
Six hazard indicators were used: water depth, low velocity, combination of depth and velocity, energy head, low force and intensity. Figure 6 shows a map with the water depth indicator.
The indicator deined by the combination of the water depth and low velocity is a raster with pixels that vary from 1 to 9. A new reclassiication was made to have a map with values 1, 2 and 3. The value is reached by taking the arithmetic mean of the depth and velocity classes. When the result is fractioned (e.g., (3 + 2 ÷ 2 = 2.5), the value immediately above is adopted (in this example, the resulting value would be 3). Table 4 shows how the result of the combination is deined to generate the hazard indicator map as can be seen in Figure 7.
385 , 0 3 c
H
L
57
t
1
0,7721 1124 , 0 21 t T 97 , 1423 i (2)Energy head = y + v2/2g (3)
Indicatorfor flow force = y. v2 (4)
Intensity = v. y (5)
i i tg a ln IT 6
Cellnorm = (Cell-MinValue)/(MaxValue-MinValue) 7
Cellnorm = (MaxValue-Cell)/(MaxValue-MinValue) 8 Table4 – Combination of water depth and low velocity maps
Depth Velocity Combination Hazard
1 1 1 Low
2 1 2 Medium
3 1 2 Medium
1 2 2 Medium
2 2 2 Medium
3 2 3 High
1 3 2 Medium
2 3 3 High
Figure 8 - Hazard indicator map as a result of looding for the 100-year return period: indicator Intensity
Figure 6 – Hazard indicator map as a result of looding for the 100-year return period: water depth at low (0-0.60 m), medium (0.60-1.2 m) and high (> (0.60-1.2 m) levels
For the last three indicators, map algebra was used to reach the desired result. As in the irst hazard indicators, three classes were deined according to the indicator value as shown in Table 3. The map resulting of the indicator “intensity” (Eq. 5) is provided in Figure 8.
Definition of flood prone areas
The topographic index was normalized according to
Equation 7, where the increase in value of the original variable indicates an increase in lood prone level (Figure 9).
For the distance cost matrix, the method used as va-riables the terrain slope and proximity to watercourses. The distance cost was normalized by applying Equation 8, where the decrease in value of the original variable indicates higher lood prone level (Figure 10).
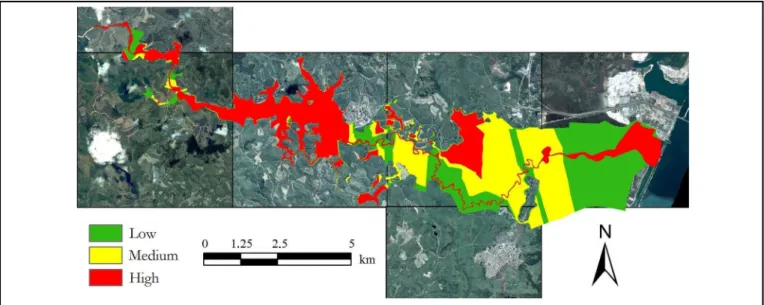
Finally, the map of lood prone areas was obtained by adopting a weighted average of the normalized values of the topographic index and distance cost matrix. Both values had weight equal to 0.5. The resulting values were grouped into three lood prone classes with an equal variation interval: low, medium and high. Figure 11 illustrates the map with the adop-ted method where the low and medium classes are combined (white) to differentiate from the high lood prone class (green).
DISCUSSION OF THE RESULTS
The results of mapping the hazard indicators have helped to identify on the Ipojuca River loodplain the areas with highest potential damage to the population. In the area near to the town center of the municipality, for example, the map with the water depth indicator shows a high hazard level. In all indicators evaluated, the high hazard level predominates in the reach of the river upstream from the town center of Ipojuca, mainly due to the high slopes of the riverbed resulting in high low velocity and water depth. Areas with a medium and low hazard downstream from the town center prevail due to the low slopes of the riverbed. This analysis is only possible thanks to the capacity of the HEC-RAS model to produce maps of water depth and low velocity in addition to looded area mapping.
The area corresponding to the class of high hazard is found to be very similar in the different maps produced with the indicators. However, a signiicant difference is found between the medium and low hazard classes. This is due to the choice of the lower threshold that deines the separation of these two classes. Tests can be performed with other threshold values for water depth and low velocity.
A reasonable similarity is also found between four maps of hazard indicators: water depth, low velocity, combined dep -th-velocity, and intensity. The choice of one or other indicator can follow the instructions provided by Kreibich et al. (2009), which relate types of damage (building and road structures, inancial damage, business interruption and so on) to the ha -zard indicators. In this analysis of the Ipojuca municipality, the water depth indicator is a good choice because the land use is predominantly residential, associated with a road infrastructure. Water depth was also the indicator adopted by Monteiro and Kobiyama (2013) when areas of looding hazards in the mu -nicipality of Ilhota (Santa Catarina state) and by Masood and Takeuchi (2012) and Gain et al. (2015) to determine risk indices in Dhaka, capital of Bangladesh.
The result of mapping the lood prone areas throughout the municipality shows the positive potential of the method to identify places that might suffer lood damage. Together with the lood prone areas, Figure 11 illustrates the boundary of the
Figure 9 – Normalized topographic index
Ipojuca River looded area for a 100-year return period (Tr = 100 years) obtained from the HEC-RAS model. A reasonable proximity is noted between the result of the hydraulic model and lood prone area. Like other approaches, the methodology applied to Ipojuca proved effective in identifying lood prone areas using DTM as basic information. Moraes et al. (2014) tes -ted calculation techniques for low accumulation and associa-ted this to the potential looding of the terrain. The HAND model, developed by Nobre et al. (2011) to deine classes related to the groundwater level, has been used to identify areas susceptible to looding (NOBRE et al., 2016; SCHLAFFER et al., 2012; SILVA et al., 2013).
CONCLUSIONS
Risk analysis is essential for planning and intervention in lood prone areas. As previously emphasized, for risk asses -sment it is necessary to characterize both hazard and vulnera-bility. The results of the Ipojuca study can be used mainly to characterize hazard. This could help, for example, in preparing geotechnical charts to identify areas more suitable to occupa-tion in the municipality. Geotechnical charts are essential for
planning land occupation expansion, aiming to reduce damage and losses for the population and public authorities as a result of natural disasters (COUTINHO, 2014). In cases where the areas are already occupied, e.g., in part of the town center of Ipojuca municipality, the result could be useful for deining the necessary measures to address potentially damaging events.
In Brazil, few studies involve mapping to assess poten -tial lood damage. Spa-tial details of the hazard indicators are a valuable tool for lood risk management since the map provides a more direct and speedy assessment than other methods.
In the study, the simulated peak low in the study area attracted our attention when compared with the low generated in the upper and middle Ipojuca River. To reduce uncertainties, we would need to make a more detailed assessment of the intense rainfall regime in the upper, middle and lower courses of the Ipojuca River to verify the inluence of climate on the magnitudes of rainfall events. Moreover, the suitability of the methods used in the HEC-HMS model need to be evaluated with respect to their application in nearby river basins that have streamlows series for comparison.
Nevertheless, the comparison between the looded area and a ield survey has shown a suitable performance of both models used to represent the hydrological and hydraulic processes.
It is worth mentioning that the methodologies developed and applied in the Ipojuca municipality are able to be reproduced in other municipalities in Brazil. The mapping methodology of lood prone areas could be particularly useful for regions with lack of streamgauge data (water level, streamlow, bathymetry), where the use of hydrodynamic modeling is dificult. In general, the most limiting factor that can be considered for adopting the methods are currently the availability of an altimetric survey for characterizing the relief in rivers impacted by lood events.
These results are the irst step to reach a lood risk analysis, which requires hazard, exposure and vulnerability mapping. Efforts should be made to characterize vulnerability by assessing susceptibility (damage-depth curves) and resilien -ce (elements such as warning systems, Civil Defense actions, rebuilding operations, among others).
ACKNOWLEDGEMENTS
This study was funded by the Ministry of Cities under the agreement signed with the Federal University of Pernambuco through the Group of Geotechnical Engineering of Hillsides, Plains and Disasters (GEGEP), process 23076.044645/2012-18, project “Development of geotechnical charts of suitability to urbanization in municipality of Ipojuca in the Metropolitan Recife Region, Pernambuco state”.
The authors thank the Coordination for Improve -ment of Higher Education Personnel (Capes) and Ipojuca Town Hall for their support given in the fieldwork and to the GEGEP team, which contributed to this study.
REFERENCES
ADGER, W.N. Vulnerability. Global Environmental Change, v.16, n. 3, p. 268-281, 2006.
BEVEN, K.; LAMB, R.; QUINN, P.; ROMANOWICZ, R.; FREER, J. Topmodel. In: SINGH, V.P. (Ed.). Computer Models of Watershed Hydrology. Water Resources Publications, Highlands Ranch, 2012. Chap. 18, p. 627-668
BIRKMANN, J. (Org.). Measuring vulnerability to natural hazards: towards disaster resilient societies. New York: United Nations University Press, 2006. Chap. 1, p.7-54
BIRKMANN, J.; CARDONA, O.D.; CARREÑO, M.L.; BARBAT, A.H.; PELLING, M.; SCHNEIDERBAUER, S.; KIENBERGER, S.; KEILER, M.; ALEXANDER, D.; ZEIL, P.; WELLE, T. Framing vulnerability, risk and societal responses: the MOVE framework. Natural Hazards, v. 67, p. 193-211, Feb., 2013.
BRUNNER, G. W. HEC-RAS. River Analysis System Hydraulic: Reference Manual. Davis, California, USA: U.S. Army Corps of Engineers, January 2010. Available at::<http://www.hec. usace.army.mil/software/hec-ras/documents/HEC-RAS_4.1_ Reference_Manual.pdf>. Accessed: 27 May 2012.
COUTINHO, R.Q. (Coord.). Elaboração de cartas geotécnicas de aptidão à urbanização no município do Ipojuca, localizado na Região Metropolitana do Recife, Estado de Pernambuco. Ministry of Cities-GEGEP/UFPEProject, Final Technical Report, 2014.
ESRI.ArcGIS Help Library.2016. Available at: <http://resources. arcgis.com/en/help/main/10.1/index.html#/How_the_cost_ distance_tools_work/009z00000025000000/>. Accessed: 11 Feb. 2016.
FELDMAN, A.D. (USACE). Hydrologic Modeling System HEC-HMS: Reference Manual. Davis, Cali-fornia, USA: U.S. Army Corps of Engineers, mar. 2000. Available at: http://www. hec.usace.army.mil/software/hec-hms/documentation/HEC-HMS_Technical%20Reference%20Manual_(CPD-74B).pdf. Access: 18 Dec. 2012.
GAIN, A.K.; MOJTAHED, V.; BISCARO, C.; BALBI, S.; GIUPPONI, C.An integrated approach of lood risk assessment in the eastern part of Dhaka City. Natural Hazards, v. 79, n. 3, p. 1499-1530, 2015.
GOERL, R.F.; KOBIYAMA, M.; PELLEIN, J.R.G.M. Proposta metodológica para mapeamento de áreas de risco a inundação: Estudo de caso do município de Rio Negrinho – SC. Boletim de Geograia, v. 30, n. 1, p. 81-100, 2012.
IBGE. Demographic Census 2010 – CITIES.Available at: http:// www.cidades.ibge.gov.br/xtras/home.php. Access: 05 Nov. 2015.
KREIBICH, H.; PIROTH, K.; SEIFERT, I.; MAIWALD, H.; KUNERT, U.; SCHWARZ, J.; MERZ, B.; THIEKEN, A. H. Is low velocity a signiicant parameter in lood damage modelling? Natural Hazards and Earth System. Sciences, v. 9, p. 1679-1692.,Oct. 2009.
LAVELL, A.; OPPENHEIMER, M.; DIOP, C.; HESS, J.; LEMPERT, R.; LI, J.; MUIR-WOOD R.; MYEONG, S. Climate change: new dimensions in disaster risk, exposure, vulnerability and resilience. In: FIELD, C.B.; BARROS, V.; STOCKER, T. F.; QIN, D.; DOKKEN, D.J.; EBI, K.L.; MASTRANDEA, M.D.; MACH, K.J.; PLATTNER, G.-K.; ALLEN, S. K.; TIGNOR, M.; MIDGLEY, P.M. (Ed.). Managing Risks of Extreme Events and Disasters to Advance Climate Change Adaptation. A Special Report of
Working Groups I and II of the Intergovernmental Panel on Climate Change (IPCC). Cambridge, New York: Cambridge University Press, 2012. Chap.1, p. 25-64.
MACHADO, M. L.; NASCIMENTO, N.; BAPTISTA, M.; GONÇALVES, M.; SILVA, A.; LIMA, J. C. de; DIAS, R.; SILVA, A.; MACHADO, E.; FER-NANDES, W. Curvas de danos de inundação versus profundidade de submersão: desenvolvimento de metodologia. Revista de Gestão de Água da América Latina, v. 2, n. 1, p. 35-52, January/June 2005.
MASCARENHAS, J.C.; BELTRÃO, B.A.; SOUZA JUNIOR, L.C.; GALVÃO, M.J.T.G.; PEREIRA, S.N.; MIRANDA, J.L.F. (Org). Projeto cadastro de fontes de abastecimento por água subterrânea. Diagnóstico do município de Ipojuca, estado de Pernambuco
[Draft registerofsourcesofgroundwatersupply. Diagnosis of Ipojuca
municipality, state of Pernambuco] Recife: CPRM/Prodeem, 2005. MASOOD, M.; TAKEUCHI, K. Assessment of lood hazard, vulnerability and risk of mid-eastern Dhaka using DEM and 1-D hydrodynamic model. Natural Hazards, v. 61, n. 2, 757-770, 2012
MERZ, B.; HALL, J.; DISSE, M.; SCHUMANN, A. Fluvial lood risk management in a changing world. Natural Hazards and Earth System Sciences, v. 10, p. 509-527, March 2010.
MERZ, B.; THIEKEN, A. H.; GOCHT, M..Flood Risk Mapping at the local scale: Concepts and Challenges. In: BEGUIM, S.; STIVE, M.; HALL, J. W. (Eds.). Flood Risk Management in Europe: Innovation in Policy and Practice. Netherlands: Springer, 2007. Chap. 13, p. 231-251.
MOEL, H.; VEN ALPHEN, J.; AERTS, J.C.J.H. Flood maps in Europe – methods, availability and use. Natural Hazards, v.9, p. 289-301, Mar. 2009.
MONTEIRO, L. R.; KOBIYAMA, M. Proposta de metodologia de mapeamento de perigo de inundação. REGA, v. 10, p. 13-25, July/Dec. 2013.
MORAES, I.C.; CONCEIÇÃO, F.T.; CUNHA, C.M.L.; MORUZZI, R.B. Comparação de Metodologias na Deinição de Fluxos Acumulados a Partir de Modelos Digitais de Elevação do Terreno Aplicado a Suscetibilidade de Inundações. Revista Brasileira de Recursos Hídricos, v. 19, n. 2, p. 223-235, abr./jun. 2014.
NOBRE, A. D.; CUARTA, L. A.; MOMO, M. R.; SEVERO, D. L.; PINHEIRO, A.; NOBRE, C. A. HAND contour: a new proxy predictor of inundation extent. Hydrological Processes, v. 30, n. 2, 2016.
NOBRE, A.D., CUARTAS, L.A., HODNETT, M., RENNÓ, C.D., RODRIGUES, G., SILVEIRA, A., WATERLOO, M., SALESKA, S. Height above the nearest drainage – a hydrologically relevant new terrain model. Journal of Hydrology, v. 404, p. 13-29, 2011.
PORTO ALEGRE. Plano Diretor de Drenagem Urbana. Manual de Drenagem Urbana. Volume VI. Porto Alegre: Federal University of Rio Grande do Sul, Set. 2005, 159 p.
PRADHAN, B. Flood susceptible mapping and risk area delineation using logistic regression, GIS and remote sensing.
Journal of Spatial Hydrology, v. 9, n. 2, 2009
RAMOS, A. M. Inluência das mudanças climáticas devido ao efeito estufa na drenagem urbana de uma grande cidade. 2010. 160 f. Thesis (Doctorate in Civil Engineering) -Federal University of
Pernambuco, Recife, 2010.
SANTANGELO, N.; SANTO, A.; DI CRESCENZO, G.; FOSCARI, G.; LIUZZA, V.; SCIARROTTA, S.; SCORPIO, V. Flood susceptibility assessment in a highly urbanized alluvial fan: the case study of Sala Consilina (southern Italy). Natural
Hazardsand Earth System Sciences, n. 11, p. 2765–2780, Oct. 2011.
SARTORI, A., LOMBARDI NETO, F., GENOVEZ, A. M. Classiicação Hidrológica de Solos Brasileiros para a Estimativa da Chuva Excedente com o Método do Serviço de Conservação do Solo dos Estados Unidos Parte 1: Classiicação. RBRH: Revista Brasileira de recursos hídricos, v. 10, n. 4, out./dez.r 2005.
SCHLAFFER, S.; HOLLAUS, M.; WAGNER, W., MATGEN, P. Flood delineation from synthetic aperture radar data with the help of a priori knowledge from historical acquisitions and digital elevation models in support of near-real-time lood mapping. In: CIVCO, D.L.; EHLERS, M.; HABIB, S.; MALTESE, A.; MESSINGER, D.; MICHEL, U.; NIKOLAKOPOULOS, K.G.; SCHULZ, K. (Eds.). Earth Resources and Environmental Remote Sensing/GIS Applications III. Proceedings, v. 8538, 2012.
SILVA, W. F.; MOLLERI, G. S. F.; PINTO, M. B. P.; ARAÚJO JUNIOR, G. J. L. D. Análise do modelo HAND para a indicação de áreas suscetíveis a eventos críticos de cheias. In: SIMPÓSIO BRASILEIRO DE SENSORIAMENTO REMOTO, 16., 2013, Foz do Iguaçu. Anais …São José dos Campos: INPE, 2013. p. 7001-7008.
STEPHENSON, D. Integrated lood plain management strategy for the Vaal. Urban Water, v.4, p.425-430, December 2002.
THIEKEN, A.H.; MULLER, M.; KREIBICH, H.; MERZ, B. Flood damage and inluencing factors: new insights from the August 2002 lood in Ger-many. Water Resources Research, v. 41, p.1301-1323, Dec. 2005.
TOMINAGA, L. K; SANTORO, J.; AMARAL, R. (Org.).Desastres
Naturais: Conhecer para prevenir. São Paulo: Instituto Geológico, 2009. 196 p.
TUCCI, C.E.M. Modelos Hidrológicos. Porto Alegre: Editora da Universidade UFRGS/ABRH, 1998.
TURRERO, P.; JOSÉ DOMÍNGUEZ-CUESTA, M.; JIMÉNEZ-SÁNCHEZ, M.; GARCIA-VÁSQUEZ, E. The spatial distribution of Palaeolithic human settlements and its inluence on palaeoecological studies: a case from Northern Iberia. Journal
of Archaeological Science, v. 40, p. 4127-4138, June 2013.
UNISDR. Terminology on Disaster Risk Reduction.United Nations. 2009. 31 p.
390 DOI: htp://dx.doi.org/10.21168/rbrh.v21n2.p377-390
USDA-United States Department of Agriculture.Technical Release 55 (TR-55).Urban Hydrology of Small Watersheds. Washington, DC: USDA, NRCS, June 1986.
VALERIANO, M. M. TOPODATA: Guia para Utilização de Dados Geomorfológicos Locais. São José dos Campos: INPE, 2008. 72 p. Technical Report: INPE-15318-RPQ/818. Available at: <http://mtc-m18.sid.inpe.br/col/sid.inpe.br/ mtcm18@80/2008/07.11.19.24/doc/publicacao.pdf>. Aceess: 11 maio 2012.
VIGLIONE, A.; DI BALDASSARRE, G.; BRANDI-MARTE, L.; KUIL, L.; CARR, G.; SALINAS, J.L.; SCOLOBIG, A.; BLÖSCHL, G. Insights from socio-hydrology modelling on dealing with lood risk – Roles of collective memory, risk-taking attitude and trust. Journal of Hydrology, v. 518, p. 71-82, 2014.
WRIGHT, J. M. Floodplain Management: Principles and Current Practices. Knoxville: The University of Tennessee, 2008.
ZHOU, Y.; LI, N.; WU, W.; WU, J. Assessment of pro-vincial social vulnerability to natural disasters in China.Natural Hazards, v. 71, p. 2165-2186, December 2014.
ZONENSEIN, Juliana. Índice de risco de cheia como ferramenta de gestão de enchentes. 2007. 105f. Dissertation (Master in Civil Engineering) –Federal University of Rio de Janeiro, Rio de Janeiro, 2007. Available at: http://wwwp.coc.ufrj.br/teses/ mestrado/rh/2007/Teses/ZONENSEIN_J_07_t_M_rhs.pdf Access: 20 Feb. 2015.
Authors’ contribution:
Alfredo Ribeiro Neto: pre e post-processing input data of the models HEC-HMS and HEC-RAS; model simulation; mapping of looded area, water depth, low velocity, hazard indicators and lood prone areas; ield survey; literature review; text writing.
Larissa Ferreira David Romão Batista: pre e post-processing input data of the models HEC-HMS and HEC-RAS; model simulation; mapping of looded area, water depth, low velocity and hazard indicators; literature review; text writing.