RBRH, Porto Alegre, v. 23, e30, 2018 Scientific/Technical Article
https://doi.org/10.1590/2318-0331.231820170074
Uncertainty assessment in hydrodynamic modeling of floods generated by dam break
Avaliação de incertezas em simulações hidrodinâmicas de ondas geradas por rompimento de barragens
Arthur da Fontoura Tschiedel1 and Rodrigo Cauduro Dias de Paiva1
1Instituto de Pesquisas Hidráulicas, Universidade Federal do Rio Grande do Sul, Porto Alegre, RS, Brasil
E-mails: [email protected] (AFT), [email protected] (RCDP)
Received: September 18, 2017 - Revised: March 14, 2018 - Accepted: May 15, 2018
ABSTRACT
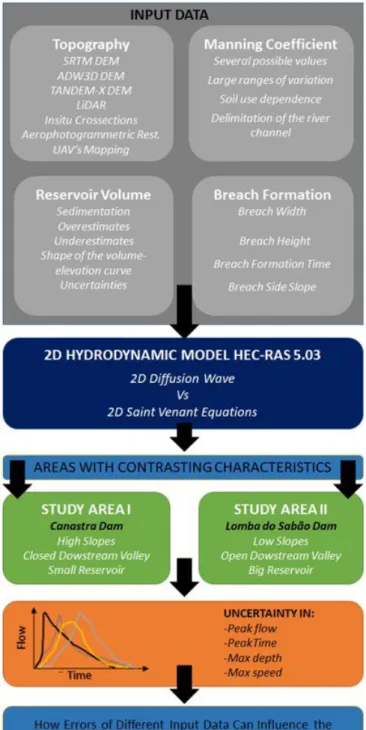
The objective of the present work was to evaluate sources of uncertainty in dam break simulations for areas with contrasting characteristics: one in a narrow valley with high slopes, and another an open valley with low slopes. A sensitivity analysis of the hydrodynamic model
Hec-Ras 5.03 was performed, varying the input data of the model (Manning coefficient, breach configurations, reservoir volume, type of valley topography and equation considered). These variations cause different changes in peak flow, peak time, maximum depth and a maximum speed for different sections of the downstream watercourse. It was concluded that there are uncertainties in determining the input data that impacts in many ways at the generated flood wave, considering both a hydraulic variable of interest, the distance
of the section from the dam and the mean geomorphological characteristic of the downstream valley. Topography is not always the most important input data, which allows the possibility of use of low resolution topographies to estimate the peak time in some
sections, depending on the valley. Finally, safety coefficients for dam break studies are suggested, aiming to represent uncertainties of
the input data in the generated results.
Keywords: Geoprocessing; Hec-Ras 5.03; 2D Hydrodynamic modeling; Dam break; Safety coefficients.
RESUMO
O presente trabalho teve como objetivo realizar uma avaliação de fontes de incerteza em simulações de onda de cheia de rompimentos
de barragens para áreas de características contrastantes: uma em vale encaixado e altas declividades e outro com vale aberto e baixas
declividades. Uma análise da sensibilidade do modelo hidrodinâmico Hec-Ras 5.03 foi realizada, perturbando-se os dados de entrada do
modelo (coeficiente de Manning, configurações da brecha, volume do reservatório, topografia do vale de jusante e tipo de equacionamento considerado). Após observou-se como essa variação alterava a vazão de pico, tempo de pico, profundidade máxima e a velocidade máxima para diferentes seções localizadas ao longo dos cursos hídricos. Concluiu-se que as incertezas existentes na determinação dos
dados de entrada impactam de forma variada na onda de cheia gerada, considerando tanto a variável hidráulica de interesse como o
distanciamento da seção em relação ao barramento e a característica geomorfológica média do vale de jusante. A topografia nem sempre é o dado de entrada de maior importância, o que permite, até certo ponto, a utilização de topografias de baixa resolução para estimar tempo de pico em algumas seções, dependendo do vale. Por fim, sugerem-se coeficientes de segurança para estudos de rompimento
de barragens, que visam representar as incertezas dos dados de entrada nos resultados gerados.
Palavras-chave: Geoprocessamento; Hec-Ras 5.03; Modelagem hidrodinâmica 2D; Rompimento de barragens; Coeficientes de
INTRODUCTION
Dam construction in Brazil has grown year by year, increasing the risk associated with the implantation of these structures. By the year 2016, a total of 22,920 dams had been counted in the 2016 Annual Report on Dam Safety (ANA, 2017), considering both dams used for energy purposes and those used for supply, aquaculture, water catchment, regularization, industrial use and waste storage.
Regardless of the arrangement and purpose of the dam, possible ruptures of these structures have a high potential for damage, involving not only economic damage, but also many human losses at the downstream locations of these dams (BRASIL, 2010). Even though this type of accident is not frequent, several cases have already been observed at both the international and national levels (AGUIAR, 2014), the most catastrophic being in Brazil in the Mariana district of Minas Gerais (BRASIL, 2015).
Silveira and Machado (2005) points out that the constructive aspects of dam structures are carried out in such a way as to make the annual probability of rupturing equivalent to 0.1%, and it is therefore accepted that the dam can break in a period of 10,000 years. Thus, considering that the Brazilian reality already
exceeds 10,000 existing dams, a cumulative probability can be expected of at least one collapse of a Brazilian embankment per year.
This occurrence is shown in Table 1, which presents a compilation of the accidents recorded by Lauriano (2009), Carvalho (2015) and ANA (2015a,b, 2016a) for the last two decades. In the table mentioned, the names of the dams or (or sites where the ruptures occurred) are shown), so that 19 accidents are observed for the last 17 years. This compilation also pointed out 11 large accidents that occurred in Brazilian soil between the years 1950 and 2000 (TSCHIEDEL, 2017).
Not only the frequency of accidents observed, but also the potential damages related to the rupture of these structures have led to the need to implement regulation in the sector (WILLINGHOEFER, 2015; VERÓL, 2010). This regulation was approved by the National Plan for Dam Safety - PNSB, (BRASIL, 2010). The PNSB points out that studies on the prediction of possible damage caused by dam breaks are very important and are elaborated through hydraulic modeling to support Emergency Action Plans (EAPs) to be triggered in case of dam breaks (BRASIL, 2010).
Many research studies involving the topic of dambreaks have already been developed under the most diverse aspects and
objectives. As an example, both in the national scenarios (TUCCI; COLLISCHONN, 1997; BRASIL, 2005; MENDES, 2008; ABREU JÚNIOR, 2015; ROCHA, 2015) and at the international level (ZAGONJOLLI, 2007; XU; YANG; ZHOU, 2017; HUANG et al., 2017) hydraulic software and models have being used in these studies. These models are applied to predict hydraulic variables
(levels, flows, maximum velocities and maximum depths), for example, DAMBRK (used by, among others, Tucci and Collischonn (1997) and George and Nair (2015)), and Hec-Ras (used by, among others, Rocha (2015), Yakti et al. (2018) and Basheer et al. (2017).
Other models such as Lisflood-FP, Telemac-2D, MIKE, XPSWM, each with their simplification and dimensionality characteristics,
are also considered as consolidated in the market and are widely used in hydraulic studies of dam breaks (TENG et al., 2017;
KUMAR et al., 2017). The information used as input data in
these models is for the most part: (i) Manning coefficient of the downstream valley; (ii) Breach Configuration; (iii) Reservoir
volume; (iv) Topography of the downstream valley and; (v) Type of equation considered.
In addition to these input data, definitions of the
two-dimensional mesh size or distancing between sections (dx) and
the calculation step (dt), in addition to upstream and downstream
boundary conditions must also be defined. However, these definitions are not part of the scope of this paper.
Obtaining accurate input data in dam break studies is in most cases not simple and usually uncertain, since it can not be
guaranteed with any certainty that, for example, the Manning coefficient used to represent the roughness of a valley that has never been flooded is correct considering that the possibility of calibration is zero, in this example. Another example considering
the uncertainty of input data used in dambreak studies that can be cited is related to the topography of the downstream valley, that can not be representative of the real world. These uncertainties associated with the accuracy of the input data in dam rupture
studies can therefore generate significant variations in the results
obtained at the end of the simulations.
These relationships have been the object of study by several
researchers, who at times find different behaviors. Tucci and Collischonn (1997) and Gallegos, Schubert and Sanders (2009) state that the reservoir volume is one of the input data whose change
most impacts the downstream flood wave, followed by the Manning coefficient. Huokuna (2001) and Hooshyaripor, Tahershamsi and Razi (2017), however, show that the configuration of the breach is one of the main determinants of the shape and intensity of the hydrograph formed downstream, as well as the volume of the reservoir (in the case of the second author). Kuhlkamp (2016), Souza (2016) and Kim and Sanders (2016) state that the
hydrographs generated from different breach configurations tend
to converge to similar values in the downstream valley, with larger differences for sections near the dam. Souza (2016) also mentions
the impact that different Manning coefficients applied in the flood valley can generate in the results in relation to the peak flow.
On the other hand, Rocha (2015) and Alvarez et al. (2017) affirm
that topography may be the main influencing factor in floodplain
prediction, among other hydraulic variables of interest. In this Table 1. History of disruptions since the 2000s.
Decade
2000 2010
Rio Verde Itabirito
Cataguases Fundão
Miraí Laranjal do Jari
Espora Herculano
Apertadinho Camocim
Algodões Analândia
Camará Boa Vista do Uru
Nova Lima Vacaro
Coronel Sapucaia Zampieri
sense many research studies have been developed that connect the use of topography estimated by orbital sensors and large scale hydrodynamic modeling, presenting good results (YAN et al., 2015; ALSDORF et al., 2005; SCHUMANN et al., 2010). Also, within the scope of dam break studies, ANA (2016b) considers the use of topography on a 1:250,000 scale from the Digital Elevation Model (DEM) generated from the SRTM (Shuttle Radar Topography Mission) mission, with 90 meters of spatial resolution, as adequate to subsidize ruptures studies of small dams, in order to meet some studies applied on large scales and in the light of studies applied
on small scales. In these cases, even considering the existence of
more detailed DEMs (such as the SRTM DEM with 30 meters of spatial resolution), more detailed topographies should be required, since the altimetric error of DEM SRTM (FARR et al., 2007) is on the order of 6 meters for South America (RODRÍGUEZ; MORRIS; BELZ, 2006). And this altimetric error can be on the same order of the height of the dam in question.
It is therefore observed that there are several studies emphasizing that for different cases, different input data impact differently on the results obtained in the simulations. However, they do not propose how these uncertainties should be taken into
account in the evaluation of the final results.
The present work aimed at evaluating the impact of
uncertainty on different factors in the flood simulation results
from dam breaks. From these analyses, we propose preliminary
safety coefficients to be applied in studies of this type when the
input data used are not fully reliable.
For that, two areas of contrasting characteristics were evaluated: one in a narrow and steep downstream valley and the other in a wide and plane downstream valley. For each area, several simulations were performed using different input data for
factors such as Manning Coefficient, Reservoir Volume, Breach Configuration and Topography, as well as the type of simulation
model, in order to evaluate the impact of the uncertainty of each of these factors in the model output results, such as Peak Flow,
Peak Flow Time, Maximum Depth, and Maximum Velocity. A flow chart of the general approach adopted in this study is
presented in Figure 1.
Next, in the item “2D Hydraulic Modeling”, the equations considered in the Hec-Ras 5.03 model are explained. Subsequently,
the input data used in dam rupture studies are better presented.
2D HYDRAULIC MODELING
The two-dimensional shallow water models work with average velocity at depth, after integrating the Navier-Stokes equations
along the vertical axis and solving the equations of conservation of mass and conservation of momentum in the x and y axes of
the modeled water course (MARTIN; MCCUTCHEON, 1998), originating the 2D equations of Saint Venant.
The use of the two-dimensional Hec-Ras 5.03 module allows the use of two options for equations: The equations of
Saint Venant 2D (also called “Full Momentum Equations”) or its simplification: the 2D Diffusion Model (or Diffusion Wave),
which originates from the suppression of certain terms of the 2D momentum conservation equation (USACE, 2016). The model given by the equations of Saint Venant 2D is composed of the
mass conservation equation (Equation 1) and the momentum
conservation equation in the x and y axes (Equation 2), according
to USACE (2016).
( ) ( )
/ / /
∂H t∂ + ∂ uh ∂ + ∂x vh ∂ + =y q 0 (1)
/ .
∂ ∂ + ∇ = − ∇ + ∇2 − + ×
t f
V t V V g H v V c V fk V (2)
In Equation 1, “t” is time; “u” and “v” are the velocity components on the “x” and “y” axes respectively, and “q” is the flow input or output term.
In Equation 2, the nabla operator ∇ is given by ∇ = (∂ / ∂x, ∂ / ∂y), while k is the unit vector in the vertical
direction. In this equation, the terms represent from left to right: (i) local acceleration; (ii) convective acceleration; (iii) gravity term; (iv) turbulent viscosity; (v) bottom friction; and (vi) Coriolis term.
The Hec-Ras 2D Diffusion Wave model comes from the use of the 2D Mass Conservation Equation and the Momentum Conservation Equation with only two terms considered: The terms of gravity (iii) and background friction (v). That is, the Momentum Conservation Equation, in the 2D Diffusion Wave model is summarized, in its vector notation, to:
∇ + f =
g H c V 0 (3)
As in the one-dimensional diffusive model (FAN et al., 2014), the 2-dimensional diffusion model does not include terms of local accelerations, which refer to changes in velocity with respect to time (term i), and terms of convective accelerations, which refer to changes in speed relative to distance (term ii). According to USACE (2016), these terms may be important in dam break studies, especially regarding the stability of the downstream model of the dam.
The solution of both 2D Diffusion Wave model and
Saint Venant 2D model is given by an implicit finite volume algorithm, which allows longer time steps than explicit methods. The finite volume method gives the model an increase in stability and robustness when compared to traditional finite difference
methods. Additionally, the algorithm is able to solve subcritical,
supercritical and mixed regimes (USACE, 2016).
The errors from the simulations performed by the 2D Hec-Ras 5.03 are controlled by accounting for the difference between
initial and final volumes in the 2D modeled area. Thus, for each
simulation performed, Hec-Ras 5.03 provides the total volume quantity created during the simulations and the total percentage error obtained, considering inputs and outputs (USACE, 2016).
INPUT DATA
In addition to the choice of the type of equation to be used in dam break studies under Hec-Ras 5.03 (2D Diffusive Model or Saint Venant 2D Equations), as seen in the previous item, 4 other
additional input data must be defined.
Manning coefficient
According to Lyra et al. (2010) one of the greatest difficulties in the elaboration of studies involving hydraulic modeling lies in the correct choice of the values of some input data, such as,
mainly, Manning’s coefficient. The nature variation relative to the values of the Manning coefficients is compiled in Table 2 where it can be observed that for the same type of soil use the
variation range of the coefficient can be up to 50% in relation to
a given central value. The work performed by Kalyanapu, Burian and McPherson (2009) can be used as an example of how the
values related to the Manning coefficient can change for the same soil use. The author has used, for example, a coefficient of
0.4 s.m-1/3 to represent forests, while USACE (2016) recommends
the use of coefficients of the order of 0.2 to represent dense
forests. In addition, it is emphasized that Manning’s equation
was developed for permanent and uniform flow, and is valid for hydraulically rough flows.
Breach formation
The uncertainties related to the definition of how a
breach is formed can be represented in Table 3, which shows
the expected values for breach formation time, breach width and
breach slope for different types of dams, according to USACE (2014), so that “h” refers to the height of the embankment and
“L” to the length. This information should be used only as general
guidelines to estimate how the dam breach can be formed (USACE, 2014), since there are regression equations that seek to relate the
Table 2. Manning coefficients used in dam rupture studies.
Location Description Min Avarage Max
Lined or Built-Up Channels Concrete, for different situations 0.011 0.018 0.027 Asphalt for various situations 0.013 0.016 0.016
Natural Streams
Clean, straight, full, no rifts or deep pools 0.025 0.030 0.033 Same as above, but more stones and weeds 0.030 0.035 0.040 Clean, winding, some pools and shoals 0.033 0.040 0.045 Clean, winding, some pools and shoals with stones and weeds 0.045 0.050 0.060 Sluggish reaches, weedy, and deep pools 0.050 0.070 0.080
Very weedy reaches, deep pools, or floodways with heavy stands of
timber and brush 0.070 0.100 0.150
Flood Plains
Pasture with no brush 0.025 0.032 0.050
Cultivated areas 0.020 0.035 0.050
Medium to dense brush 0.045 0.085 0.160
Cleared land with tree stumps and no sprouts 0.030 0.040 0.050
Light brush and trees 0.035 0.055 0.080
Heavy stand of timber, few low trees, little undergrowth with flow into
branches 0.080 0.100 0.120
characteristics of the breach to attributes of the dam itself, such as reservoir volume, height and length of the embankment among other characteristics. Among these equations, the work of Von Thun and Gillette (1990) and Froehlich (1995) can be highlighted. Saraiva (2014) presents a complete compilation of all the predictor
equations and simplified methods applied in dam break studies.
Downstream topography
Other input data required in dam rupture studies are related to downstream topography. This information can be obtained in a variety of ways, ranging from obtaining information through in situ topography to information obtained via satellite. The in situ survey, carried out using instruments such as Total Station
and GPS, has the advantage of providing extremely accurate data, but in return the fieldwork demands high costs per acquired
point. Topographic surveys performed by Aerophotogrammetry and LiDAR (Light Detection and Ranging) are presented as interesting alternatives when it is desired to survey large altimetric areas with a good level of precision (JENSEN, 2009). However,
with the technological advance in the field of remote sensing,
DEMs obtained by satellite have been presented as competitive alternatives to surveys carried out via aerophotogrammetry and LiDAR, depending on the desired boundary conditions.
Reservoir volume
Often, in studies involving rupture of dams, the elevation-volume
curve of a reservoir is well defined, considering that it is important
for the company that owns the dam to monitor the silting-up for power generation purposes (BARBOSA; PINTO; CASTRO, 2014). However, there are uncertainties in the determination of the input data and they are usually related to inaccuracies in the topobatimetric surveys of reservoirs and silting-up process (COLLISCHONN; CLARKE, 2016).
In addition, this information often refers only to the useful volume of the reservoir, that is, the volume of water used for power generation. If an elevation-volume curve of this nature is used in a rupture study, the total volume to be discharged may be
underestimated by excluding the dead storage from the reservoir. The next item will present the two areas used in this study,
highlighting the contrasting characteristics between them.
STUDY AREAS
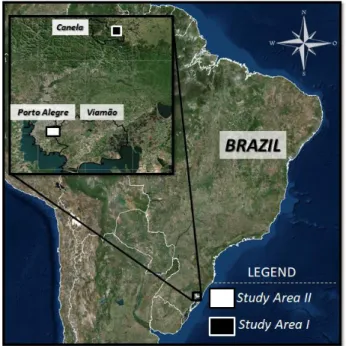
Figure 2 shows the locations of the two study areas
considered here. The first one, the Canastra Dam, is located
in Rio Grande do Sul, about 150 km from Porto Alegre city. The reservoir of the Canastra Dam is considered small and narrow, while the downstream valley is steep and narrow. On the other hand, Study Area II, the Lomba do Sabão Dam, is located in a very plane region of the State, between the cities of Porto Alegre and Viamão, with a reservoir considered large and a wide and plane downstream valley.
The hypsometric differences between the two areas are represented by Figure 3, which shows the discrepancy between
the longitudinal profiles of the studied water courses, together
with the height of the respective embankments.
The differences in downstream valley configurations are
represented by Figure 4, which shows, for the Canastra Dam, a
flood zone on the order of 400 meters of transversal extension
along an 8.5 km stretch of river, featuring a narrow and steep
valley. As for the Lomba do Sabão Dam, the transverse extension of the flood zone goes from 600 meters to 4000 meters along a
13 km stretch of river, thus characterizing a plane and wide valley.
This definition follows recommendations by Silva, Gonçalves and Tanajura (2012), which classify narrow and steep valleys as those that lead to higher runoff velocities in the main river, since it is closer to the concave areas of the relief. The plane and wide
valleys, however, are those in which the flood plains become wider, providing usually lower flow velocities.
The contrast between the two studied areas also involves the size of the reservoirs of both dams. While the Lomba do Sabão Dam has a reservoir with a volume of about 3 hm3
(MAIZONAVE et al., 2005), the reservoir volume of the Canastra Dam is on the order of 0.3 hm3 (CEEE, 2011).
The next item will show how the input data used for each study area were defined.
METODOLOGY
The input data used in this work will be presented in this item together for the two study areas, in the following order: (i) Type of equation used; (ii) Topography of the Downstream
valley; (iii) Manning coefficient; (iv) Breach Configuration and;
(v) Reservoir Volume. In the end, it is shown how these input data were grouped within the scope of the simulations.
Table 3. Characteristics of breach formation parameters.
Dam Type Average Breach Width Breach lateral slope Failure Time (hours) Agency
Earthen / Rockfill (1 to 5)h 0 to 45º 0.1 to 1 FERC
(2 to 5)h 0.1 to 1 NWS
(0.5 to 5)h 0.1 to 4 USACE
Concrete Gravity Usually < 0.5L Vertical 0.1 to 0.3 FERC
Usually < 0.5L 0.1 to 0.2 NWS
Multiple Monoliths 0.1 to 0.5 USACE
Concrete Arch Entire Dam 0 to slope of the natural terrain
<0.1 FERC
0.8L to L NWS
0.8L to L USACE
Type of equation used
As presented in item “2D Hydraulic Modeling”, it is
possible to choose between two types of equations in Hec-Ras 5.03: the 2D Saint-Venant equations or the 2D Diffusion Model.
In order to identify the impact of the choice of one or the other equation on the results, two simulations were performed, setting all input data equal and varying only the type of equation between Saint-Venant 2D and 2D diffusion model for each study area.
Downstream topography used
Several topographies were used to represent the downstream valley of the studied areas, varying from the use of DEM from the SRTM, with a spatial resolution of 30 meters, to surveys via LiDAR, with a spatial resolution of 1 meter. Table 4 shows all the variations used, whose nomenclatures and characteristics are
defined below. In this table, topographies highlighted in bold are considered as “reference data”.
Considering the use of the DEM from SRTM mission data, 4 versions were used: (i) SRTM_30m, which represents the
DEM with a spatial resolution of 30 meters and filling up of
downstream valley depressions, as recommended by Anornu,
Kabobah and Kortatsi (2012); (ii) SRTM_1m, which represents a downscaling of SRTM_30m to 1 meter of spatial resolution; (iii) SRTM_1M_CALHA, adding to the SRTM_1m DEM a fictitious rectangular stream 3 meters wide and 1 meter deep, in keeping with
the reality found in the field; (iv) SRTM_1M_CALHA_VANT, which adds to the SRTM_1M_CALHA DEM, cross sections obtained locally in some areas of interest, with the aid of Total
Station, RTK (Real Time Kinematic) GPS and a DJI Phantom
II UAV with a Go-Pro Hero3+ on board. Figure 5 shows the difference between the SRTM_1M_CALHA_VANT and the SRTM_1M_CALHA for Section 05, which is distant 7.2 km from the Canastra dam. Further details on obtaining these DEMs can be obtained from Tschiedel (2017).
In addition to DEMs from the SRTM mission, the DEM AW3D_1M, as presented in Table 4, was also evaluated
exceptionally for the Canastra dam. This constructed product is
a downscaling (for a 1m spatial resolution) of the global DEM AW3D30, made available by JAXA (Japan Aerospace Exploration Agency) which has 30 meters of spatial resolution. This DEM was
generated by stereoscopy from the use of approximately 6.5 million images of the “Pancromatic Remote Sensing Instrument for Stereo Mapping” (PRISM) sensor, shipped on the ALOS Satellite
(TADONO et al., 2014).
We also considered altimetric information obtained locally for the two study areas. For the Canastra Dam, the DEM
Figure 4. Cross-Sections of Upstream and Downstream. Figure 2. Study Areas.
Figure 3. Profiles of Study Areas.
Table 4. Downstream topography.
Topography Study Area
Canastra Lomba do Sabão
SRTM 30M X
SRTM_1M X X
SRTM_1M_CALHA X X
SRTM_1M_CALHA_VANT X
AW3D_1M X
MDE_AEROGEO X
MDE_EXERC X
LiDAR_SP X
MDE_AEROGEO was used, which refers to a DEM of 1 meter of spatial resolution generated from the contour lines from a 1: 30,000 aerial photogrammetric survey carried out in the region by the AEROGEO company. The MDE_EXERC was also used for the Canastra DAM, and refers to a topography with a 1 meter resolution generated from the 1: 50,000 topographic survey carried
out by the Brazilian Army in the late 1970s, from an extensive
study involving aerial-photogrammetry techniques and points
quoted in the field.
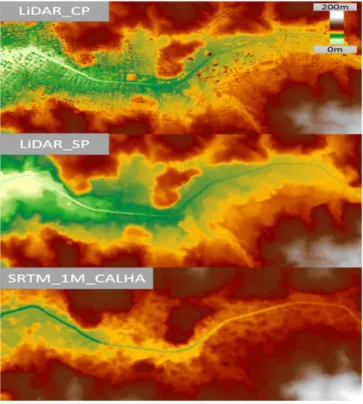
For the Lomba do Sabão dam, in addition, a LiDAR survey (ZANARDI et al., 2013) was used to characterize the downstream valley. From this material, the so-called LiDAR_SP was generated,
in which only the topographic configurations of the terrain were considered, excluding the buildings and trees of the DEM, as
well as LiDAR_CP, which took into account the buildings and the terrain itself (Figure 6).
Manning coefficients used
The Manning coefficients were defined based on the
values presented in Table 2, electing reference values to represent the channel and banks (in bold), obtained from the comparison between the characteristics of the downstream valleys studied and the tables published by USACE (2016). A multiplication factor (Mf) equal to unity was assigned to these values, so that other
Manning coefficients were by applying different multiplier factors.
These factors are presented in Table 5, so that “NE” stands for
“Not Evaluated”.
Breach configuration adopted
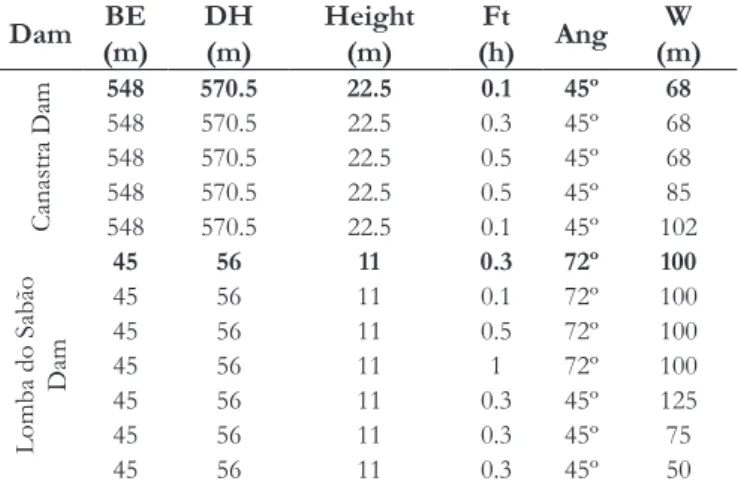
The breach configurations adopted followed the recommendations in Table 3, using a trapezoidal format. The base width of the trapezoid (W), the angle generated between the base and the trapezoidal generator, and the breach formation time (Ft) were varied.
In Table 6 the breach configurations adopted for both
barrages are presented, where “BE” is the Final Breach Bottom Elevation and “DH” is the maximum dam height. In this table, values highlighted in bold are considered as “reference data”.
Reservoir volumes used
The volumes of the two reservoirs studied were varied
based on the definition of a more likely elevation-volume curve.
This variation was based on the multiplication of volume values by factors that ranged from 0.6 to 1.4 as can be observed in Figure 7, for the Lomba do Sabão Dam and in Figure 8 for the Canastra Dam. The elevation-volume curves with Mf = 1 are the reference curves.
The following is the methodology used to group these input data into the simulations.
Crossing of simulations
This study had a total of 38 simulations in Hec-Ras 5.03, (20 for the Canastra Dam and 18 for the Lomba do Sabão Dam). The logic behind the organization of the simulations consists,
for each one, of varying one input data and fixing all the others.
Figure 5. Differences between DEMs (7 km from the Canastra dam).
Thus, there are two “base scenarios” (one for each study
area), correspond to simulations where only reference input data are used (bolded information in Tables 4, 5 and 6). From these
“base scenarios” additional scenarios were created, which are those in which four input data are fixed as the reference and one
input data varies according to information presented in Table 4, Table 5, Table 6, Figure 7 and Figure 8. Table 7 shows the number of additional scenarios simulated by variation of input data considering only the 2D Diffusion Model as an equation. Besides,
as previously shown, in order to verify the influence of the type
of equation chosen in the simulation results, two simulations were performed using the Saint Venant 2D equations, one for each study area, using only the data from reference input.
The results of these simulations are titled “evaluation parameters” and refer to: (i) Peak Flow; (ii) Peak Flow Time; (iii) Maximum Depth and; (iv) Maximum Local Velocity.
This approach allowed us to obtain groups of values (for a given evaluation parameter) from the variation of a single input data.
For example, the 5 peak flow values (for a given interest section) obtained through 5 Manning coefficient variations can be statistically grouped, generating a group of values that contains a maximum,
a minimum, a mean and a standard deviation.
In order to evaluate how important input data are in the
simulation performed, compared with other input data, the coefficient
of variation, cv, can be used, and is presented in Equation 4.
=Standard Deviation Cv
Mean (4)
The higher the quotient between standard deviation and mean, the greater the representativeness that this standard deviation has, compared to the mean, which represents less convergence around a central value.
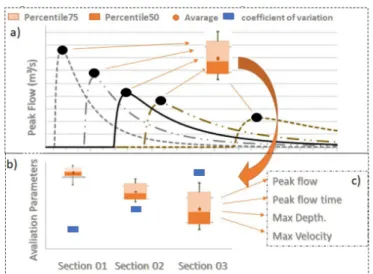
The results of this study are presented in three ways: Initially,
a cross-section is chosen arbitrarily in the first study area and, for
this section, it is shown how the perturbation of different input data impacts on the hydrograph of the section.
As an example, a set of 5 simulations performed based on the Manning coefficient variation and maintenance of the
other input data generates 5 hydrograms with 5 different peak
flow values (Figure 9a).
From this group of 5 peak flow values it is possible,
therefore, to generate statistical quantities such as mean and
percentiles and present them as a box plot graph (Figure 9a). In addition to these, it is also possible to obtain, for this group
of 5 peak flow values, the standard deviation and consequently the coefficient of variation.
Thus, obtaining the averages, percentiles and the coefficient
of variation can be applied to all sections of analysis, thus generating
Table 6. Breach configurations adopted. Dam BE
(m)
DH (m)
Height (m)
Ft (h) Ang
W (m)
Canastra Dam
548 570.5 22.5 0.1 45º 68
548 570.5 22.5 0.3 45º 68 548 570.5 22.5 0.5 45º 68 548 570.5 22.5 0.5 45º 85 548 570.5 22.5 0.1 45º 102
Lomba do Sabão
Dam
45 56 11 0.3 72º 100
45 56 11 0.1 72º 100
45 56 11 0.5 72º 100
45 56 11 1 72º 100
45 56 11 0.3 45º 125
45 56 11 0.3 45º 75
45 56 11 0.3 45º 50
Figure 7. Volumes for the Lomba do Sabão Dam.
Figure 8. Volumes for the Canastra Dam. Table 7. Number of additional scenarios.
Input Data Canastra Dam Sabão DamLomba do
Topography 6 3
Manning Coefficient 4 3
Volume 4 4
Breach 4 6
Total 18 16
Table 5. Manning coefficients used. Multiplier
Factor (Mf)
Manning Coefficient
Canastra Lomba do Sabão Main
Channel Other
Main
Channel Other
1 0.075 0.15 0.020 0.030
1.50 NE NE 0.030 0.045
2.00 0.15 0.30 NE NE
0.50 0.0375 0.075 NE NE
a graph that shows different coefficients of variation for each cross-section, considering only the peak flow as a parameter of
evaluation (Figure 9b). This approach allows to verify, therefore, the representativeness of the variation of the input data in different sections for a certain parameter of evaluation in the study area
(in the case of the example, how the variation of the Manning coefficient impacts the peak flow in different sections of the
downstream area of the Canastra Dam).
This approach is then applied to the other evaluation parameters (Figure 9c) and not only to the parameter initially
chosen (peak flow). After this mapping, it is possible to use the information generated to create preliminary safety coefficients to
be used in dam rupture studies.
RESULTS
This chapter is divided into three parts, the first one referring to the presentation of some of the hydrograms and coefficients of
variation obtained for the Canastra Dam. The second one refers to
the cross-comparison between all coefficients of variation obtained
for the two study areas. The third part presents a proposal of
initial safety coefficients to be applied in studies of dam breaks
located in valleys similar to those studied in this work. Overall, all 38 simulations performed in this work presented mean volume
errors on the order of 0.25%, and the maximum observed error
was equivalent to 6%, giving reliability to the results obtained in the water balance.
Canastra Dam results
The results obtained for the Canastra Dam allowed to
identify how the modification of the input data in the simulations
performed alter values of the evaluation parameters, such as the
peak flow and the peak flow time of the hydrograms formed.
In order to illustrate these results, Figure 10, Figure 11, Figure 12
and Figure 13 show how the hydrograph varies for the same
cross-section when the reference input data is exchanged, respectively:
(i) the topography of downstream; (ii) the elevation-volume curve;
(iii) the configuration of the breach formed; (iv) the Manning coefficient and; (v) the type of equation considered.
The variation of the topography allows to observe a delay of 9 minutes relative to the peak time for the hydrograms formed
at 7.2 km downstream of the dam, while the peak flow presents a
variation on the order of 350 m3/s according to Figure 10.
From Figure 11, it can be observed that the variation of the curve elevation-volume changes the hydrograph more intensely
than the topography variation. The hydrograph reaches peak flow
variations that differ by up to 200%. However, the variations related
to the peak time are not so significant, with a lag of 5 minutes
between the scenarios studied.
Besides that, the next results obtained allow us to infer that variations of the breach configuration alter the hydrograph
of sites distant from the rupture in steep and narrow downstream Figure 9. Spatial progress of the analyzes: (a) Hydrograms
and grouping of variables of interest for a given cross-section; (b) Statistical analysis by evaluation parameters, by section; (c) Evaluation parameters.
Figure 10. Hydrograms obtained from topography variation at 7.2 km from the dam.
Figure 11. Hydrograms obtained from the variation of elevation-volume curve of the reservoir at 7.2 km from the dam.
Figure 12. Hydrograms obtained from variation of the Breach
very little. In this sense, Figure 12 (where “W” is the width of
the breach and “t” is the breach formation time) shows variations of low magnitude, especially for peak flow (which rotates around
800 m3/s for the milder scenario and 850 m3/s for the most
catastrophic scenario). On the other hand, the peak flow time,
related directly to the breach formation time, varies a little more, being on the order of 7 minutes.
The variation in the Manning coefficient was shown to have a great influence on the downstream hydrograph, even more than the influences caused by the variation of the topography
and by the variation of the volume of the reservoir, as can be observed in Figure 13. In this sense, different values of the
Manning coefficient can cause variation in the peak flow on an order of up to 300%, while for the peak flow times, lags of up
to 32 minutes are observed.
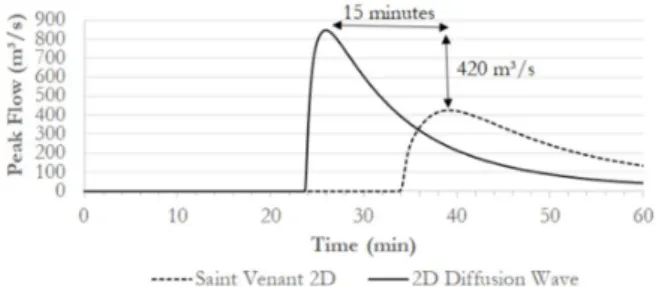
It was observed, lastly, that the adoption of the 2D
Diffusion Model to predict the behavior of the generated flood wave tends to overestimate the peak flow on the order of 100%
for the section in question, in addition to generating a peak time on the order of 65% of the peak time obtained with the application of the equations of Saint Venant 2D.
The hydrographs present in Figures 10 to 14 show the distinct impacts that variations in different input data generate in the dam breaking simulations only for one section, located 7.2 km from the Canastra Dam. However, these impacts were also produced in 6 other sections located along the basin, totaling 7 sections. These results can be visualized from statistical sample groups, as previously shown in Figure 9.
Thereby, for the Canastra Dam, Figure 15 shows how
variations in input data impact peak flow at different locations
and Figure 16 shows how variations in input data change peak
flow time at different locations. It is noteworthy that in addition to the peak flow and peak flow time, the maximum depths and maximum velocities were also studied in the same way.
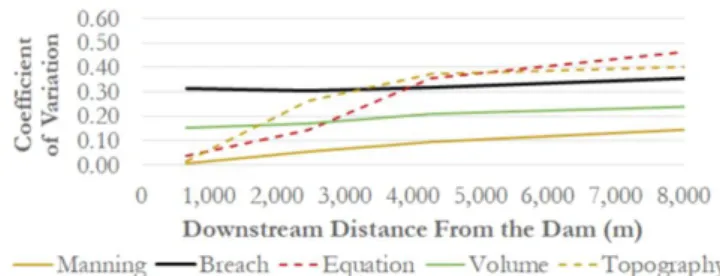
For the peak flow (Figure 15), a growth trend (upstream
to downstream) of the coefficient of variation is observed when variations in the Manning coefficient, elevation-volume curve
and topography are imposed. This means that in places close to the failure, variations of these parameters are not so relevant.
The opposite is observed for changes in the breach configuration, which imposes great variability on the peak flow for the sections
closer to the rupture. For more distant sections, however, variations
in the breach configuration do not generate much difference in the peak flow, which tends to converge to a central value.
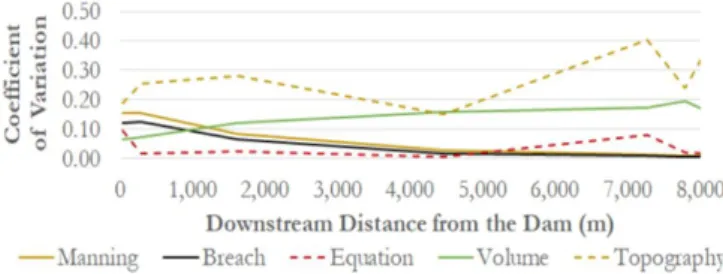
In Figure 16 it is observed that for the peak flow time,
the variations imposed on the Manning coefficient generate quite
different results from 1 km downstream of the dam (with differences reaching 45 minutes to 8.5 km distance from the dam), but, the Figure 13. Hydrograms obtained from the Manning coefficient
variation at 7.2 km from the dam.
Figure 14. Hydrograms obtained from the variation of the equation at 7.2 km from the dam.
impact of the variations in places closer to the rupture is almost
null. On the other hand, when breach configurations are varied, great influence is observed in sections closer to the dam and little influence in more distant places. It is observed that changes
in the elevation-volume curve are those that least change the
peak flow time, followed by alterations in the topography, whose modifications generated peak flow times with a difference on the
order of 20 minutes, to 8.5 km from the dam.
Interpretation of these results also shows that it is possible
to obtain equal peak flow time values in one section of interest
using different downstream topographies from the variation of
other input data. For example, it is possible to obtain equal peak flow time values in the section 8.5 km away from the dam, using
the SRTM_30M (considered a poorly accurate topography) or
using the MDE_AEROGEO (considered here the most accurate
topography). For this, it suffices for the Manning coefficient
adopted in the simulations using the SRTM_30M to be slightly smaller than the one adopted when the MDE_AEROGEO is used to represent the downstream topography.
Cross comparation
In this section the coefficients of variation of all the
evaluation parameters are presented, comparing the two study areas
in the first 8.5 km of river and evaluating the different aspects that the input data exert in simulations performed in steep and
narrow basins (represented by Study Area I - UHE Canastra) and in plane and wide basins (represented by Study Area II - Lomba do Sabão Dam).
It is concluded from Figure 17 and Figure 18 that in steep and narrow basins, the variations are imposed on the formation
of the breach impact on the peak flow only in sections closer
to the dam, whereas for more distant sections, the uncertainties are negligible. In contrast, for wide and plane basins, the breach
configuration directly impacts the peak flow rate for all river sections.
For both study areas, the variations imposed on the
Manning coefficient exert more influence on downstream than on upstream sections. However, the influence in steep and narrow basins is greater, as can be observed at approximately 8 km from the dams, in which this basin has a coefficient of variation on the order of 0.4 and the wide and plane basin a coefficient of 0.15.
Among other contrasting characteristics observed in the graphs of the mentioned tables, it is observed that for wide and plane basins the type of equation considered, together with the
downstream topography are the two input data that most influence
the results, from distances greater than 4 km. For steep and narrow
basins, the inputs that generate the greatest influence at locations distant from the dam are, on the other hand, the Manning coefficient
and the volume-volume curve of the reservoir.
Figure 16. Variations in Peak Time.
Figure 17. Variation coefficients for peak flow of the Lomba
do Sabão Dam.
Figure 19 and Figure 20 show respectively the coefficients
of variation obtained considering the peak flow time for the
Lomba do Sabão dam and the Canastra dam. In these graphs it is observed that the way the breach is generated impacts directly
on the peak flow time in the whole studied valley, for wide and
plane basins. For steep and narrow basins, on the other hand, the
formation of the breach exerts influence on the peak flow time in a
decreasing form, being greater upstream and smaller downstream. It is also observed that the uncertainties associated with
the definition of the Manning coefficient are those that have the greatest influence on the results for steep and narrow and
sloping basins, whereas for wide and plane basins, other input
data such as breach, type of equation and topography influence results. Meanwhile, uncertainties in the correct definition of the elevation-volume curve do not significantly change the peak time of
localized sections at greater distances from collapsed dams. On the
other hand, this input data exerts a great influence on the peak
time for sections located near the dam, in wide and plane basins.
For the maximum depth (Figure 21 and Figure 22), it was
observed that the topography is the input data of greatest influence
along the entire length of river studied, regardless of the type of valley considered. The uncertainties regarding the correct elevation-volume curve also cause coonsiderable differences in the
maximum depth, regardless of the type of downstream valley, for
sections located more than 7 km away for wide and plane basins and more than 2 km for steep and narrow basins, although their
influence is not compared to the influence of topography.
For more distant sections of the dam, both in steep and narrow or wide and plane basins, the type of equation chosen does
not have a great influence on the maximum depth, but in contrast, it is the one that exerts most influence in the first kilometers in
wide and plane valleys.
The uncertainty in the formation of the dam breach does
not significantly change the maximum depth in distant sections,
for both types of basins. On the other hand, for sections close to the dam these input data are important. It is also noted that for the
estimation of maximum depths, the uncertainties in the choice of the Manning coefficient become irrelevant to the uncertainties in the definition of the elevation-volume curve and in the definition
of the topography of the terrain.
The maximum local velocity (Figure 23 and Figure 24) found in the sections studied is strongly related to the type of equation used in the simulations for both study areas. This is mainly due to the fact that one equation considers terms of local and convective accelerations, while the other does not consider such terms. For wide and plane valleys, the second input data that most
influences the results is the breach formation mode, whereas for steep and narrow valleys, this input data is what least influences the maximum depth for more distant sections.
Taking account the velocities, in Figure 23 and Figure 24, it can be seen that, for steep and narrow valleys, the Manning
coefficient is the input data that requires more accuracy for the
elaboration of correct dam break studies, considering this evaluation parameter (when cross-sections located at great distances from the dam are analyzed), while for wide and plan valleys, the Manning
coefficient is not the input data whose variation exerts a greater influence on the maximum velocities. It is also noticed that the
Figure 19. Coefficients of variation for Peak Flow Time of the
Lomba do Sabão Dam.
Figure 20. Variation coefficients for Canastra Dam peak flow time.
Figure 21. Variation Coefficients for Maximum Depth in Lomba
do Sabão Dam.
Figure 22. Variation coefficients for Maximum Depth of Canastra
Dam.
Figure 23. Variation coefficients for Maximum Velocity of the
uncertainties in the definition of reservoir volume do little to change the values of local maximum velocities.
Safety coefficients
The different coefficients of variation generated by this
work were grouped, creating a qualitative relationship between
input data and uncertainties identified for the two study areas. This relationship was established considering that “near the dam” cross-sections are up to 4 km from the embankment, while “far from the dam” cross-sections are placed more than 4 km away (with a maximum limit of 12 km of second study area and 8 km for the first study area). It was then assumed that if the mean of the coefficients of variation generated within the “near” and “far” bands was less than 10%, the influence exerted by the input
data is considered low. Between 10% and 30% considered the
influence exerted as a mean, whereas for values above 30% it was
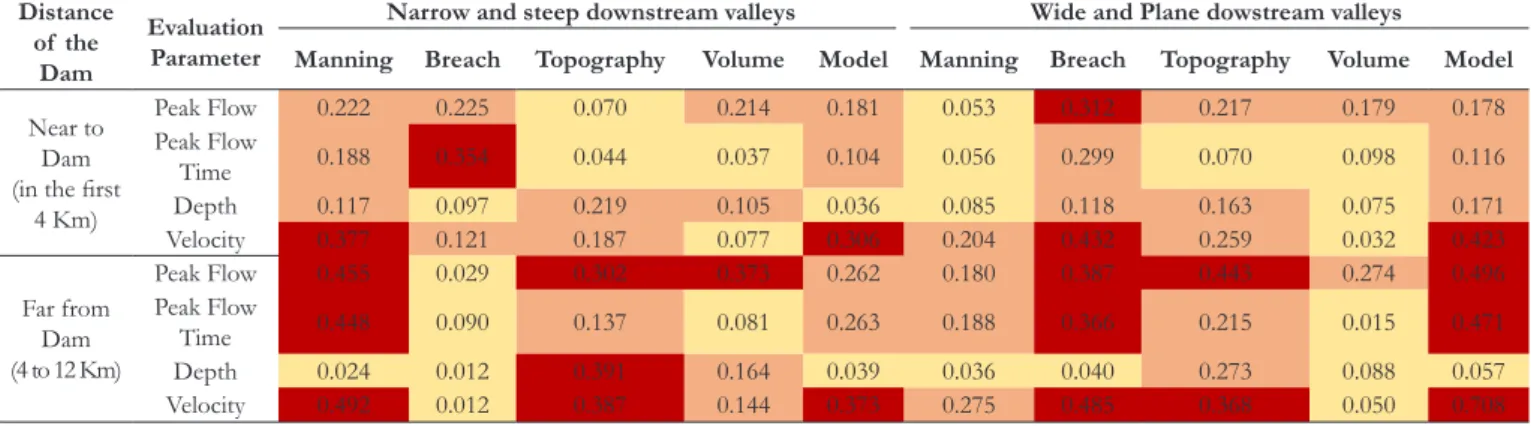
accepted that the uncertainties of the input data may generate a high rate of errors in the results. This information, which seeks to synthesize the results of this study is presented in Table 8, while the values are presented in Table 9.
The coefficients of variation presented in Table 9 can be used quantitatively in studies of dam rupture (since there is similarity between the studied areas), considering them as safety
coefficients that, multiplied by one parameter of evaluation, would result in “conservative evaluation parameters”
Thus, it is proposed that safety coefficients (for peak flow time) be obtained from a product according to Equation 5. For the peak flow, maximum depth and maximum velocity, safety coefficients are obtained from Equation 6 In these equations, where
sc is the safety coefficient, cv (%) is the coefficient of variation and i represents the input data considered.
( )
= =∏n − i
i 0
sc 1 Cv (5)
( )
= =∏n + i
i 0
sc 1 Cv (6)
This safety coefficient is obtained taking into account the
values presented in Table 9, according to: (i) the distance of the section from the dam; (ii) the type of downstream valley; (iii) the input data with low accuracy used; (iv) the hydraulic parameter
of interest, which can be peak flow, peak flow time, maximum depth and maximum speed.
Figure 24. Variation coefficients for Maximum Velocity of the
Canastra Dam.
Table 8. Relation between input data and uncertainties for dam break studies.
Distance of the
Dam
Evaluation Parameter
Narrow and steep downstream valleys Wide and Plane dowstream valleys
Manning Breach Topography Volume Model Manning Breach Topography Volume Model
Near to Dam (in the first
4 Km)
Peak Flow Medium Medium Low Medium Medium Low High Medium Medium Medium Peak Flow
Time Medium High Low Low Medium Low Medium Low Low Medium
Depth Medium Low Medium Medium Low Low Medium Medium Low Medium Velocity High Medium Medium Low High Medium High Medium Low High
Far from Dam (4 to 12 Km)
Peak Flow High Low High High Medium Medium High High Medium High Peak Flow
Time High Low Medium Low Medium Medium High Medium Low High
Depth Low Low High Medium Low Low Low Medium Low Low
Velocity High Low High Medium High Medium High High Low High
Table 9. Variation coefficients to narow/steep and wide/plane valleys.
Distance of the
Dam
Evaluation Parameter
Narrow and steep downstream valleys Wide and Plane dowstream valleys
Manning Breach Topography Volume Model Manning Breach Topography Volume Model
Near to Dam (in the first
4 Km)
Peak Flow 0.222 0.225 0.070 0.214 0.181 0.053 0.312 0.217 0.179 0.178 Peak Flow
Time 0.188 0.354 0.044 0.037 0.104 0.056 0.299 0.070 0.098 0.116 Depth 0.117 0.097 0.219 0.105 0.036 0.085 0.118 0.163 0.075 0.171 Velocity 0.377 0.121 0.187 0.077 0.306 0.204 0.432 0.259 0.032 0.423
Far from Dam (4 to 12 Km)
Peak Flow 0.455 0.029 0.302 0.373 0.262 0.180 0.387 0.443 0.274 0.496 Peak Flow
Once the safety coefficient is obtained for a given cross-section and given a hydraulic parameter, the conservative hydraulic parameter is obtained according to Equation 7. In this equation, x is the hydraulic parameter of interest and x* is the most likely conservative hydraulic parameter.
*
.
=
x x cs (7)
Application example of cs
Suppose that a dam rupture study was carried out in a narrow and steep basin, with a geomorphology similar to Study
Area I, so that the results showed a peak flow on the order of
1,500 m3/s in a section located at approximately 1.6 km from the
dam. If the input data for Manning coefficient, breach configuration
and topography are not reliable (that is, the topography used is
imprecise, the Manning coefficient is inferred without field visits and the breach configuration is obtained only from the literature), Equation 5 is applied with the coefficients of variation 0.222 for the Manning coefficient, 0.225 for the breach configuration, and
0.070 for the topography, obtained from Table 9. The safety
coefficient obtained from the application of Equation 6 is 1.60,
which being applied to Equation 7 results in a conservative peak
flow of 2,400 m3/s.
On the other hand, if the Manning coefficient has been calibrated (based, for example, on the record of major past floods)
and the topography is considered accurate (obtained via LiDAR,
for example), the uncertainties of this input data can be eliminated
and considered as close to zero and consequently disregarded in
the context of Equation 6, resulting in a safety coefficient relative only to the breach configuration, which would be equal to 1.225. Thus, the conservative peak flow rate would be 1837 m3/s in the
section of interest. This example used data present in this work,
and can be better interpreted from the visualization of Figure 15.
FINAL CONSIDERATIONS
This work was based on an approach that analyzed the cause-and-effect relationship between the change of input data and the results obtained from hydrodynamic simulations used in dam break studies for areas with contrasting characteristics.
This analysis showed that certain input data exert more influence on the results than others, and this influence depends
on the type of valley considered, the distance between the dam and the cross section of interest and the parameter of interest evaluation.
These influences were mapped and quantified using coefficients
of variation, which were later used as subsidies to propose safety
coefficients to be used in dam break studies. The application of these coefficients seeks, conservatively, to lead the uncertainties
regarding the accuracy of an input data to the results obtained in simulations whose sensitivity has not been evaluated.
It has been identified that the use of global digital elevation
models (such as SRTM or AW3D) in dam break studies may be
feasible within the estimation of peak time and peak flow time, since safety coefficients are applied to the results depending on
the geomorphological configuration of the downstream valley. The use of these global topographies to estimate maximum depths and maximum velocities in cross sections, on the other hand, is
still not reliable due to the low level of accuracy, but can be used
sparingly through the application of the safety coefficients presented
in this work for basins with geomorphological characteristics similar to those studied here. This reality tends to change in the future with the availability of more accurate global topographies, such as TanDem-X (SCHUMANN; MOLLER; MENTGEN, 2016), which has a spatial resolution of 12 meters and AW3D5 (TADONO et al., 2014), with a spatial resolution of 5 meters.
ACKNOWLEDGEMENTS
The authors of this article are grateful to colleagues who have made important contributions to the development of this research, such as Environmental Eng. João Paulo Fialho, Civil Engineer Camila Dahm, from the CEEE group and Professor Dr. Marcelo Marques, from the UFRGS Hydraulic Research Institute. This work has been partially supported by the Brazilian agency CAPES.
REFERENCES
ABREU JÚNIOR, V. Simulação numérica da ruptura de barragens.
2015. 125 f. Dissertação (Mestrado em Métodos Numéricos em
Engenharia) - Universidade Federal do Paraná, Curitiba, 2015.
AGUIAR, O. P. D. Contribuição ao Estudo do Índice de Segurança de Barragens (ISB). 2014. 166 f. Dissertação (Mestrado em Engenharia Civil) - Faculdade de Engenharia Civil, Universidade Estadual de Campinas, Campinas, 2014.
ALSDORF, D.; DUNNE, T.; MELACK, J.; SMITH, L.; HESS, L. Diffusion modeling of recessional flow on central Amazonian floodplains. Geophysical Research Letters, v. 32, n. 21, p. L21405, 2005.
http://dx.doi.org/10.1029/2005GL024412.
ALVAREZ, M.; PUERTAS, J.; PEÑA, E.; BERMUDEZ, M. Two-dimensional dam-break flood analysis in data-scarce regions: the case study of Chipembe Dam, Mozambique. Water, v. 9, n. 6, p. 432, 2017. http://dx.doi.org/10.3390/w9060432.
ANA – AGÊNCIA NACIONAL DE ÁGUA. Relatório de segurança de barragens 2012/2013. Brasília: Ministério do Meio Ambiente, 2015a.
ANA – AGÊNCIA NACIONAL DE ÁGUA. Relatório de segurança de barragens 2014. Brasília: Ministério do Meio Ambiente, 2015b.
ANA – AGÊNCIA NACIONAL DE ÁGUA. Relatório de segurança de barragens 2015. Brasília: Ministério do Meio Ambiente, 2016a.
ANA – AGÊNCIA NACIONAL DE ÁGUA. Relatório de segurança de barragens 2016. Brasília: Ministério do Meio Ambiente, 2017.
ANORNU, G. K.; KABOBAH, A.; KORTATSI, B. K. Comparability studies of high and low resolution digital elevation models for watershed delineation in the tropicas: case of Densu River Basins of Ghana. International Journal of Cooperative Studies, v. 1, n. 1, p. 9-14, 2012.
BARBOSA, J. M. C.; PINTO, M. R.; CASTRO, M. A. H. Erosão e
assoreamento em reservatórios. In: SIMPÓSIO DE RECURSOS
HÍDRICOS DO NORDESTE, 12., 2014, Natal. Anais… São Paulo: ABRH, 2014. Available from: <http://www.abrh.org.br/
xiisrhn/anais/papers/PAP018506.pdf>. Access on: 5 apr. 2016.
BASHEER, T. A.; WAYAYOK, A.; YUSUF, B.; KAMAL, M. R. Dam Breach parameters and their influence on flood hydrographs for Mosul Dam. Journal of Engineering Science and Technology, v. 12, n. 11, p. 2896-2908, 2017.
BRASIL, L. S. S. Utilização de modelagens uni e bidimensional para a propagação de onda de cheia proveniente de ruptura hipotética de barragem. Estudo de caso: Barragem de Rio de Pedras - MG. 2005. 203 f. Dissertação (Mestrado em Saneamento, Meio Ambiente e Recursos Hídricos) - Escola de Engenharia, Universidade Federal de Minas Gerais, Belo Horizonte, 2005.
BRASIL. Lei n°. 12.334, de 20 de setembro de 2010. Estabelece a Política Nacional de Segurança de Barragens destinadas à acumulação de água para quaisquer usos, à disposição final ou temporária de rejeitos e à acumulação de resíduos industriais, cria o Sistema Nacional de Informações sobre Segurança de Barragens e altera a redação do art. 35 da Lei nº 9.433, de 8 de janeiro de 1997, e do art. 4º da Lei nº 9.984.Diário Oficial [da] República F ederativa do Brasil, Brasília, DF, 20 set. 2010.
BRASIL. Ministério do Meio Ambiente. Impactos ambientais decorrentes
do desastre envolvendo o rompimento da Barragem de Fundão, em Mariana.
Brasília: Ministério do Meio Ambiente, 2015.
CARVALHO, E. Segurança de barragens e avaliação de riscos. In: SEMINÁRIO NACIONAL DE GRANDES BARRAGENS, 30., 2015, Foz do Iguaçu. Anais… Foz do Iguaçu: Comitê Brasileiro de Barragens, 2015.
CEEE – COMPANHIA ESTADUAL DE GERAÇÃO E TRANSMISSÃO DE ENERGIA ELÉTRICA. Plano de uso e ocupação do solo no entorno do reservatório da UHE Canastra. Porto Alegre: CEEE, 2011
COLLISCHONN, B.; CLARKE, R. T. Estimativa e incerteza de curvas cota-volume por meio de sensoriamento remoto. Revista Brasileira de Recursos Hídricos, v. 21, n. 4, p. 719-727, 2016. http://
dx.doi.org/10.1590/2318-0331.011616022.
FAN, F. M.; COLLISCHONN, W.; PONTES, P. R. M.; PAIVA, R.
C. D. Avaliação de um método de propagação de cheias em rios com aproximação inercial das equações de Saint-Venant. Revista
Brasileira de Recursos Hídricos, v. 19, n. 4, p. 137-147, 2014. http://
dx.doi.org/10.21168/rbrh.v19n4.p137-147.
FARR, T. G.; ROSEN, P. A.; CARO, E.; CRIPPEN, R.; DUREN, R.; HENSLEY, S.; KOBRICK, M.; PALLER, M.; RODRIGUEZ, E.; ROTH, L.; SEAL, D.; SHAFFER, S.; SHIMADA, J.; UMLAND, J.; WERNER, M.; OSKIN, M.; BURBANK, D.; ALSDORF, D. The Shuttle Radar Topography Mission. Reviews of Geophysics, v. 45, n. 2, p. RG2004, 2007. http://dx.doi.org/10.1029/2005RG000183.
FROEHLICH, D. C. Peak outflow from breached embankment dam. Journal of Water Resources Planning and Management, v. 121, n. 1, p. 90-97, 1995. http://dx.doi.org/10.1061/(ASCE)0733-9496(1995)121:1(90).
GALLEGOS, A. H.; SCHUBERT, J. E.; SANDERS, B. F. Two-dimensional, high-resolution modeling of urban dam-break flooding: a case study of Baldwin Hills, California. Advances in Water Resources, v. 32, n. 8, p. 1323-1335, 2009. http://dx.doi. org/10.1016/j.advwatres.2009.05.008.
GEORGE, A. C.; NAIR, T. Dam break analysis using BOSS
DAMBRK. Aquatic Procedia, v. 4, p. 853-860, 2015. http://dx.doi. org/10.1016/j.aqpro.2015.02.107.
HOOSHYARIPOR, F.; TAHERSHAMSI, A.; RAZI, S. Dam break flood wave under different reservoir’s capacities and lengths. Sadhana, v. 42, n. 9, p. 1557-1569, 2017. http://dx.doi.org/10.1007/
s12046-017-0693-x.
HUANG, D.; YU, Z.; LI, Y.; HAN, D.; ZHAO, L.; CHU, Q. Calculation method and application of loss of life caused by dam break in China. Natural Hazards, v. 85, n. 1, p. 39-57, 2017. http://
dx.doi.org/10.1007/s11069-016-2557-9.
HUOKUNA, M. Determination of the dam breach hydrographs for the Kyrkösjärvi dam break hazard analysis. Finlândia: Finnish Environment Institute, 2001. Available from: <http://www.
syke.fi/download/noname/%7B794F1624-E67E-40E6-BEC3-705341416973%7D/58958>. Access on: 5 mar. 2016.
JENSEN, J. R. Sensoriamento remoto do ambiente – uma perspectiva em recursos terrestres. São Paulo: Parêntese, 2009.
KALYANAPU, A. J.; BURIAN, S. J; MCPHERSON, T. N. Effect of land use-based surface roughness on hydrologic model output. Journal of Spatial Hydrology, v. 9, n. 2, p. 51-71, 2009.
KIM, B.; SANDERS, B. F. Dam-break flood model uncertainty
assessment: case study of extreme flooding with multiple dam failures in Gangneung, South Korea. Journal of Hydraulic Engineering, v. 142, n. 5, p. 05016002, 2016. http://dx.doi.org/10.1061/(ASCE) HY.1943-7900.0001097.
Civil) - Faculdade de Engenharia Civil. Universidade Federal de
Santa Catarina, Florianópolis, 2016.
KUMAR, S.; JASWAL, A.; PANDEY, A.; SHARMA, N. Literature review of Dam Break studies and inundation mapping using hydraulic models and GIS. International Research Journal of Engineering and Technology, v. 4, p. 55-61, 2017.
LAURIANO, A. W. Estudo de ruptura da barragem de funil: comparação
entre os modelos FLDWAV e HEC-RAS. 2009. 251 f. Dissertação (Mestrado em Saneamento, Meio Ambiente e Recursos Hídricos) - Escola de Engenharia. Universidade Federal de Minas Gerais, Belo Horizonte, 2009.
LYRA, G.; CECÍLIO, R. A.; ZANETTI, S. S.; LYRA, G. B. Coeficiente de rugosidade de Manning para o rio Paracatu. Revista Brasileira de Engenharia Agrícola e Ambiental, v. 14, n. 4, p. 343-350, 2010. http://dx.doi.org/10.1590/S1415-43662010000400001.
MAIZONAVE, C. R. M.; BENDATI, M. M.; WERNER, V. R.; CYBIS, L. F. A.; CARVALHO, E. N. Avaliação planctônica do
reservatório da Lomba do Sabão (Porto Alegre/RS) com ênfase na ocorrência de cianobactérias: implicações para o abastecimento
público. In: CONGRESSO BRASILEIRO DE ENGENHARIA SANITÁRIA E AMBIENTAL, 23., 2005, Rio de Janeiro. Anais… Campo Grande: ABES, 2005. Available from: <http://www.lume.
ufrgs.br/handle/10183/106340>. Access on: 6 may 2017.
MARTIN, J. L.; MCCUTCHEON, S. C. Hydrodynamics and transport for water quality modeling. New York: Lewis Publishers, 1998.
MENDES, T. A. Avaliação da vulnerabilidade de barragens ao rompimento de pequenos barramentos localizados a montante. 2008. 105 f. Dissertação (Mestrado em Engenharia do Meio Ambiente) - Escola de Engenharia Civil, Universidade Federal de Goiás, Goiânia, 2008.
ROCHA, F. F. Retroanálise da Ruptura da Barragem São Francisco
- Miraí, Minas Gerais, Brasil. 2015. 200 f. Dissertação (Mestrado em Saneamento, Meio Ambiente e Recursos Hídricos) - Escola de Engenharia, Universidade Federal de Minas Gerais, Belo Horizonte, 2015.
RODRÍGUEZ, E.; MORRIS, C. S.; BELZ, J. E. A global assessment of the SRTM performance. Photogrammetric Engineering and Remote Sensing, v. 72, n. 3, p. 249-260, 2006. http://dx.doi.org/10.14358/ PERS.72.3.249.
SARAIVA, L. S. Comparação entre critérios para determinação de hidrograma de ruptura de barragens. 2014. 79 f. Monografia (Graduação em Engenharia Civil) - Escola de Engenharia, Universidade Federal do Rio Grande do Sul, Porto Alegre, 2014.
SCHUMANN, G. J. P; MOLLER, D. K.; MENTGEN, F. High-accuracy elevation data at large scales from Air borne Single-Pass SAR interferometry. Journal of Frontier in Earth Science, v. 3, p. 88, 2016. https://doi.org/10.3389/feart.2015.00088.
SCHUMANN, G.; DI BALDASSARRE, G.; ALSDORF, D.; BATES, P. D. Near real‐time flood wave approximation on large rivers from space: application to the River Po, Italy. Water Resources Research, v. 46, n. 5, 2010. http://dx.doi.org/10.1029/2008WR007672.
SILVA, G. P.; GONÇALVES, R. M.; TANAJURA, E. L. X.
Levantamento Goedésico GNSS-RTK para o Mapeamento da
Linha de Costa. In: SIMPÓSIO BRASILEIRO DE CIÊNCIAS GEODÉSICAS E TECNOLOGIAS DA GEOINFORMAÇÃO, 4., 2012, Recife. Anais… Recife: UFPE, 2012. Available from:
<https://www.ufpe.br/laccost/images/documentos/161_3.pdf>.
Access on: 14 mar. 2016.
SILVEIRA, J. F.; MACHADO, J. A. A. A. Construção das árvores de eventos e análise de risco da barragem João Leite da Saneago. In: SEMINÁRIO NACIONAL DE GRANDES BARRAGENS, 26., 2005, Goiânia. Anais... Rio de Janeiro: CBDB, 2005. Available
from: <http://www.cbdb.org.br/documentos/site/95/A02.doc>.
Access on: 24 may 2016.
SOUZA, D. H. C. Análise probabilística e de sensibilidade dos parâmetros de um estudo de rompimento hipotético: barragem de terra. 2016. 91 f.
Dissertação (Mestrado em Recursos Hídricos, Energéticos e
Ambientais) - Faculdade de Engenharia Civil, Arquitetura e Urbanismo, Universidade Estadual de Campinas, Campinas, 2016.
TADONO, T.; ISHIDA, H.; ODA, F.; NAITO, S.; MINAKAWA,
K.; IWAMOTO, H. Precise global DEM generation by ALOS prism. In: PHOTOGRAMETRY, REMOTE SENSING AND SPATIAL INFORMATION SCIENCES, 4., 2014, Suzhou, China. Proceedings… USA: ISPRS, 2014. v. 2, p. 71-76.
TENG, J.; JAKEMAN, A. J.; VAZE, J.; CROKE, B. F. W.; DUTTA, D.; KIM, S. Flood inundation modelling: a review of methods, recent advances and uncertainty analysis. Environmental Modelling & Software, v. 90, p. 201-216, 2017. http://dx.doi.org/10.1016/j. envsoft.2017.01.006.
TSCHIEDEL, A. F. Avaliação de incertezas em estudos de rompimento de barragens. 2017. 135 f. Dissertação (Mestrado em Recursos Hídricos e Saneamento Ambiental) - Instituto de Pesquisas Hidráulicas, Universidade Federal do Rio Grande do Sul, Porto Alegre, 2017.
TUCCI, C.; COLLISCHONN, W. Análise do rompimento
hipotético da barragem de Ernestina. Revista Brasileira de Recursos Hídricos, v. 2, n. 2, p. 191-206, 1997. http://dx.doi.org/10.21168/ rbrh.v2n2.p191-206.
USACE – US ARMY CORPS OF ENGINEERS. Using HEC-RAS for a dam break studies. Davis: Institute of Water Resources, Hydrological Engineering Center, 2014.
USACE – US ARMY CORPS OF ENGINEERS.HEC-RAS river analysis system hydraulic reference manual version 5.0. Davis: Institute of Water Resources, Hydrological Engineering Center, 2016.
VERÓL, A. P. Simulação da propagação de onda decorrente de ruptura
utilização de um modelo pseudo-bidimensional. 2010. 237 f. Dissertação
(Mestrado em Engenharia Civil) - Programa de Pós-graduação
em Engenharia Civil, Universidade Federal do Rio de Janeiro, Rio de Janeiro, 2010.
VON THUN, J. L.; GILLETTE, D. R. Guidance on breach parameters. Colorado: U.S. Departament of the Interior Bureau of Reclamation, 1990.
WILLINGHOEFER, M. Avaliação do risco de rompimento da barragem de uma pequena Central Hidrelétrica na Bacia do Rio do Peixe. 2015. 86 f. Monografia (Graduação em Engenharia Sanitária e Ambiental)
- Centro Tecnológico, Universidade Federal de Santa Catarina, Florianópolis, 2015.
XU, F.; YANG, X.; ZHOU, J. Dam-break flood risk assessment and mitigation measures for the Hongshiyan landslide-dammed lake triggered by the 2014 Ludian earthquake. Geomatics, Natural Hazards & Risk, v. 8, n. 2, p. 803-821, 2017. http://dx.doi.org/1 0.1080/19475705.2016.1269839.
YAKTI, B. P.; ADITYAWAN, M. B.; FARIDA, M.; SURYADI, Y.; NUGROHO, J.; HADIHARDAJA, I. K. 2D Modeling of Flood Propagation due to the Failure of Way Ela Natural Dam. In: MATEC WEB OF CONFERENCES, 2018, Les Ulis, Proceedings… Les Ulis: EDP Sciences, 2018.
YAN, K.; DI BALDASSARRE, G.; SOLOMATINE, D. P.; SCHUMANN, G. J. P. A review of low‐cost space‐borne data
for flood modelling: topography, flood extent and water level.
Hydrological Processes, v. 29, n. 15, p. 3368-3387, 2015. http://dx.doi. org/10.1002/hyp.10449.
ZAGONJOLLI, M. Dam break modelling, risk assessment and
uncertainty analysis for flood mitigation. 2007. 162 f. Tese (Doutorado em Recursos Hídricos) - Institute for Water Education, United Nation Educational, Scientific and Cultural Organization, Delft, Holanda, 2007.
ZANARDI, R. P.; SCHNEIDER, A. H.; SALOMONI, T. R.; SALOMONI, C. S.; REISS, M. L. L. Validação da Qualidade do Perfilamento a Laser aerotransportado da cidade de Porto Alegre. In: SIMPÓSIO BRASILEIRO DE SENSORIAMENTO REMOTO (SBRH), 16., 2013, Foz do Iguaçu. Anais… Foz do Iguaçu: INPE, 2013.
Authors contributions
Arthur da Fontoura Tschiedel: Elaboration of all the stages that involved the construction of this work.
Rodrigo Cauduro Dias de Paiva: Orientation in all the stages
that involved the construction of this work and final revision