UNIVERSIDADE DE LISBOA
FACULDADE DE CIÊNCIAS
DEPARTAMENTO DE QUÍMICA E BIOQUÍMICA
Jorge Miguel de Sousa Valadas
Mestrado em Bioquímica
Área de especialização em Bioquímica Médica
2010
Role of adenosine A
2A
receptors in the
neuroprotective effect of corticotrophin
releasing hormone (CRH)
UNIVERSIDADE DE LISBOA
FACULDADE DE CIÊNCIAS
DEPARTAMENTO DE QUÍMICA E BIOQUÍMICA
Jorge Miguel de Sousa Valadas
Mestrado em Bioquímica
Área de especialização em Bioquímica Médica
2010
Role of adenosine A
2A
receptors in the
neuroprotective effect of corticotrophin
releasing hormone (CRH)
Tese de Mestrado orientada por: Doutora Luísa V. Lopes
O trabalho apresentado foi realizado no Instituto de Farmacologia e Neurociências, Faculdade de Medicina de Lisboa e Unidade de Neurociências, Instituto de Medicina Molecular sob a orientação da Doutora Luísa V. Lopes e do Doutor Pedro A. Lima.
RESUMO
O factor de libertação da corticotrofina (corticotrophin releasing factor, CRF) é um componente essencial na regulação do stresse. No eixo hipotálamo-hipofisário
(hypo-thalamic-pituitary-adrenal, HPA) é libertado do hipotálamo, activando os receptores de
subtipo CRF1R e CRF2R, que regulam a libertação de corticotrofina pela hipófise. Esta,
por sua vez, induz a libertação de glucocorticóides das glândulas supra-renais. Findo o período de stresse, os glucocorticóides regulam negativamente a libertação de CRF e diminuem a activação do eixo HPA, restabelecendo a homeostasia inicial do sistema. Recentemente, para além da sua acção no eixo HPA, a presença dos receptores de CRF foi observada em neurónios provenientes de outras áreas cerebrais como o cór-tex ou o hipocampo. O CRF tem funções neuroprotectoras perante vários tipos de insulto, como a excitotoxicidade induzida por glutamato, a agregação da proteína β-amilóide ou a indução de stress oxidativo. Curiosamente, a adenosina, um neuromo-dulador, exerce o mesmo tipo de função neuroprotectora em áreas cerebrais seme-lhantes, por activação dos seus receptores. Enquanto a activação dos receptores de adenosina de subtipo A1 (A1R) induz um decréscimo da excitabilidade neuronal, a
acti-vação dos receptores de subtipo A2A (A2AR), na generalidade, aumenta-a. Estes
recep-tores possuem grande afinidade para a adenosina e estão presentes na maioria das áreas cerebrais, embora com diferentes níveis de expressão. Assim, para modular a excitabilidade neuronal existem estratégias farmacológicas que consistem quer na activação dos A1R quer no bloqueio dos A2AR. No entanto, a última abordagem tem
sido recentemente mais investigada e é largamente usada na prevenção de morte celular tanto em modelos in vitro como in vivo.
Em situações de isquémia, observa-se tanto um aumento dos níveis de CRF como de adenosina no cérebro de rato. Este aumento sugere uma acção relevante destes mediadores quer na manutenção da viabilidade neuronal quer na regulação da expressão de diversos genes importantes para o desenvolvimento e diferenciação neuronal. Por outro lado, sugere uma possível interacção entre os receptores do CRF e da adenosina. Esta hipótese tornou-se ainda mais provável após a observação, no nosso laboratório, que a administração oral de antagonistas dos receptores A2A reverte
os efeitos do stresse no hipocampo, induzidos por separação maternal em ratos. Esta reversão pode ser consequência de regulação dos constituintes do eixo HPA, como os glucocorticóides ou o CRF. Adicionalmente, as vias de sinalização intracelular activa-das pela acção do CRF (através dos receptores CRF1R e CRF2R) e da adenosina
Resumo
(através dos A2AR) são semelhantes. Envolvem activação de proteínas Gs com
conse-quente aumento de actividade de cinases de proteínas, como a cinase A (PKA), a cinase C (PKC) e a mitogen-activated protein kinase (MAPK).
O objectivo deste trabalho foi estudar a acção do CRF na viabilidade celular em condi-ções de excitoxicidade induzida por glutamato e avaliar a possível interacção com os receptores de adenosina do subtipo A2A.
Foram usadas culturas primárias de neurónios de córtex de embriões de rato com 18 dias de gestação. Ao oitavo dia, as culturas foram tratadas durante 24 horas com glu-tamato, nas concentrações de 20 a 1000 µM, em condições de bloqueio ou activação dos receptores A2A e do CRF, através da aplicação de agonistas e antagonistas dos
respectivos receptores. O glutamato é um aminoácido excitatório e um dos responsá-veis pela excitotoxicidade induzida por eventos isquémicos no sistema nervoso central. Ao actuar nos receptores ionotropicos de glutamato induz a entrada de cálcio e sódio extracelulares assim como a libertação de cálcio do reticulo endoplasmático. O aumen-to de cálcio e sódio intracelulares, pode levar à morte celular quer por apopaumen-tose quer por necrose. A técnica de marcação simultânea com as sondas nucleares iodeto de propidio (PI) e Syto-13 foi usada com o objectivo de caracterizar a viabilidade celular nas diferentes condições.
Inicialmente, foi investigada a concentração de glutamato (de 20 a 1000 µM) a ser apli-cada às células em cultura com o objectivo de reproduzir as consequências de um insulto neuronal in vivo. Simultaneamente aos ensaios de viabilidade celular, foram determinados os níveis de um mediador de morte por apoptose, a caspase-3, pela téc-nica de Western blotting. Este insulto provocou um decréscimo na viabilidade celular que é dependente da concentração de glutamato usada, sendo superior para concen-trações mais altas. Por seu lado, a activação da via apoptótica ocorre preferencialmen-te para baixas concentrações de glutamato (até 50 µM). Para o desenvolvimento do restante trabalho a concentração seleccionada foi a de 100 µM, que causou uma dimi-nuição para 76,4±1,63% (n=4) da viabilidade celular, visto originar tanto morte por apoptose como por necrose neste modelo.
A função neuroprotectora do CRF na gama de concentrações de glutamato anterior-mente descrita foi observada através da aplicação de urocortina (10 pM), um composto
Resumo
ça de glutamato 100 µM (de 76,4±1,63% para 90,5±2,23%, P<0,001, n=3). Esta varia-ção na sobrevivência neuronal, perante um insulto neurotóxico, não apresenta o mes-mo padrão nos níveis de caspase-3. Para baixas concentrações de glutamato a urocor-tina aumenta os níveis de caspase-3, enquanto para concentrações de glutamato ele-vadas, os níveis deste marcador apoptótico parecem diminuir. Esta proteína, caracte-rística da indução de morte celular por apoptose exclui o dano causado por necrose. Durante esta primeira etapa do trabalho conclui-se que a urocortina exerce funções protectoras sobretudo na prevenção do processo necrótico induzido pelo glutamato. Numa etapa seguinte foram diferenciados os efeitos dos dois tipos de receptores do CRF na neuroprotecção. Assim, usando dois antagonistas selectivos, antalarmina (10nM) para CRF1R e anti-Sauvagina-30 (10nM) para CRF2R,foi observado que o
blo-queio de cada um dos receptores de forma independente leva à perda da função da urocortina (73,9±3,53% bloqueando os CRF1R, P<0,01 n=4, e 76,0±2,80% ao bloquear
os CRF2R, P<0,01, n=4). Conclui-se que a activação simultânea dos dois receptores
pela urocortina é necessária para que ela exerça o seu efeito neuroprotector perante um insulto de glutamato (100 µM). Durante este processo de bloqueio dos receptores de CRF, observou-se uma interacção directa entre os dois fármacos usados, antalar-mina e anti-Sauvagina-30, que os impede de bloquear eficientemente os receptores de CRF, quando usados em simultâneo. Esta interacção foi avaliada através de técnicas de fluorescência que permitem observar a diminuição do sinal produzido pelo aminoá-cido fenilalanina, presente na anti-Sauvagina-30, com a adição de concentrações crescentes de antalarmina. Assim, quando introduzidos simultaneamente no meio celular, são ineficazes a bloquear o efeito da urocortina.
Após a observação da função da urocortina na protecção da morte celular induzida por glutamato, estudou-se a modulação exercida pelos A2AR nesse efeito. Confirmou-se
que o bloqueio dos A2AR, através do antagonista SCH 58261 (50 nM) é neuroprotector.
Por outro lado, a activação deste subtipo de receptores está descrita como nociva para este tipo de células. Contudo, a activação directa destes receptores pelo agonista selectivo, CGS 21680 (30nM), não alterou a viabilidade celular, provavelmente devido à elevada concentração de adenosina no meio extracelular.
A modulação simultânea dos receptores A2A e de CRF revelou a existência de uma
interacção entre os mesmos. A neuroprotecção conferida pelo bloqueio dos A2AR é
dependente da activação dos receptores de CRF do tipo 2 mas independente dos do tipo 1, facto que foi observado pelo bloqueio selectivo dos receptores de CRF em con-dições de antagonismo dos A2AR. A protecção concedida pelo antagonista SCH 58261
Resumo
é suprimida quando os CRF2R se encontram bloqueados (de 88,3±1,53% para
74,8±4,91%, P<0,01, n=5) revelando-se independente do bloqueio dos CRF1R
(87,7±3,48%, n=4).
Simultaneamente, em células PC12 diferenciadas com Nerve Growth Factor (NGF), observou-se a modulação dos níveis dos A2AR pelos seus ligandos. A activação dos
A2AR diminui os seus níveis (48,9±5,5%, P<0,001, n=4), enquanto o bloqueio os
aumenta (144±15,2%, P<0,01, n=5). Os ligandos dos receptores de CRF não alteram os níveis dos A2AR em condições basais. Porém, quando aplicados em simultâneo com
os ligandos dos A2AR o mesmo não se observa. Concretamente, ocorre uma redução
nos níveis dos A2AR na presença do seu antagonista quando os receptores CRF1R se
encontram bloqueados e os CRF2R activados (39,4±14,4% do controlo, P<0,01, n=4).
Em suma, este trabalho permitiu observar a função neuroprotectora dos receptores do CRF em neurónios em cultura perante um insulto de glutamato, quer pela acção direc-ta nos seus receptores quer pela modulação dos receptores de adenosina do subtipo A2A. O modelo usado permite diferenciar as alterações na viabilidade das células em
cultura por duas vias de promoção da morte celular, apoptose e necrose, respectiva-mente para baixas e elevadas concentrações de glutamato. A neuroprotecção conferi-da pelo CRF ocorre sobretudo na prevenção conferi-da morte celular por necrose e é depen-dente da activação simultânea dos dois tipos de receptores, CRF1R e CRF2R. Para
além dos efeitos directos através dos seus receptores, o CRF exerce uma modulação dos A2AR. Estes receptores apresentam expressão diminuída em condições de
activa-ção dos CRF2R e bloqueio dos A2AR. Este fenómeno de regulação dos A2AR por parte
dos CRF2R constitui uma alternativa à protecção por CRF atrás descrita. Novas
abor-dagens terapêuticas, que incluam a modulação destes dois tipos de receptores podem ser futuramente testadas com o objectivo de diminuir a morte neuronal provocada por insultos excitotóxicos em eventos isquémicos.
ABSTRACT
In hypoxia, glutamate excitotoxicity induces neuronal death. Simultaneously, adenosine is released and is accompanied by an increase of the stress mediator, corticotrophin-releasing factor (CRF). In vivo modulation of adenosine A2A receptors (A2AR) reverses
hippocampal stress-induced effects. This raises the question whether A2AR regulate
CRF actions. We now evaluated the interaction between the blockade of A2AR and the
activation of CRF receptors (CRFR), upon glutamate insult.
Primary rat cortical neuronal cultures (9 days in vitro) were challenged with glutamate (20-1000µM, 24 hours). The effects of the CRFR and A2AR ligands on cell viability were
measured using propidium iodide and Syto-13 fluorescence staining. Pro-caspase-3 fragmentation was used as an apoptotic marker. A2AR levels were quantified in
NGF-differentiated PC12 cells by Western blotting.
Glutamate decreased cell viability in a concentration-dependent manner. At 100 µM we observed a reduction of viability to 76.4±1.63% of control (P<0.001, n=6). Urocortin (10pM), a CRFR agonist, increased cell survival to 90.5±2.23% (P<0.001 compared to glutamate, n=3). This effect was abolished by blocking either CRF1R or CRF2R with
antalarmin (10nM) or anti-Sauvagine-30 (10nM), respectively. Activation of A2AR did not
affect cell death induced by glutamate. However, A2AR blockade with a selective
an-tagonist SCH 58261 (50nM) improved cell viability against the glutamate insult. This effect was dependent on CRF2R but not on CRF1R activation. The A2AR levels
meas-ured in PC12 cells were modulated by CRF2R. The A2AR upregulation induced by SCH
58261 (144±15.2%, P<0.01 n=5; 50 nM) was abolished by CRF2R (P<0.01, n=4) but
not by CRF1R activation.
Overall these data show a protective role of CRF in cortical neurons, against glutamate-induced death, either directly by CRFR activation or by modulating A2AR actions. The
neuroprotection achieved by A2AR blockade requires CRF2R activation, which might
result from CRF2R modulation of A2AR levels. The interaction between these receptors
may point toward novel pharmacological approaches based on common molecular pathways.
Keywords: Adenosine; A2A receptors; Corticotrophin Releasing Factor (CRF); CRF1R;
TABLE OF CONTENTS
Resumo I
Abstract V
Abbreviation list 3
1. Background 5
1.1. Function of Corticotrophin Releasing Factor 5
1.1.1. Extrahypothalamic role of corticotrophin releasing factor 7 1.2. Adenosine influence on neuroprotection: modulation by adenosine receptors 8
2. Aim 11
3. Methods 13
3.1. Primary rat cortical neuronal cultures 13
3.2. PC12 cells 13
3.2.1. PC12 differentiation with NGF 14
3.3. Glutamate insult 14
3.4. Pre-incubation with agonists and antagonists of CRF and adenosine A2A
receptors 14
3.5. Propidium Iodide and Syto-13 uptake assay 15
3.6. Immunocytochemistry 17
3.7. Preparation of total protein extracts 17
3.8. Western blotting 17
3.9. Pharmacological agents 18
3.10. Statistics 19
4. Results 21
4.1. Characterization of the primary neuronal cell cultures 21
4.2. Cell viability upon glutamate insult 21
4.3. Effect of corticotrophin releasing factor on glutamate neurotoxicity 23 4.4. Involvement of A2A receptors on CRF neuroprotection 28
Table of contents
4.5. Modulation of A2A receptor levels by CRF 31
5. Discussion 35
5.1. Establishment of a neuronal model that responds to excitotoxic insults 35 5.2. Urocortin prevents glutamate induced cell death 37 5.3. CRF1R and CRF2R activations have a neuroprotective role in glutamate
excitotoxicity 38
5.4. CRF2R, but not CRF1R, is essential to neuroprotection by A2AR blockade 39
6. Appendix 43
6.1. Physical interaction between antalarmin and anti-Sauvagine-30 43
7. Acknowledgments 45
ABBREVIATION LIST
Aβ amiloid-β peptide
A1R adenosine A1 receptor subtype
A2AR adenosine A2A receptor subtype
a-Sau anti-Sauvagine-30
ACTH adrenocorticotrophin hormone
AMPA L-α-amino-3-hydroxy-5-methylisoxazole-4-propionate Ant antalarmin
BDNF brain-derived neurotrophic factor cAMP cyclic adenosine monophosphate CeA central nucleus of the amygdala CNS central nervous system
CREB cAMP response element-binding
CRF corticotrophin releasing factor (formerly known by CRH for corticotrophin releasing hormone) CRF1R CRF receptor of subtype 1 CRF2R CRF receptor of subtype 2 CRFR CRF receptors CTR control DAPI 4',6-diamidino-2-phenylindole DIV days in vitro
DMEM Dulbecco’s modified Eagle's medium DMSO dimethyl sulfoxide
FBS fetal bovine serum GABA γ-aminobutyric acid GFAP glial fibrillary acidic protein Glu L-glutamic acid
GSK3β glycogen synthase kinase 3β HBSS Hanks’ balanced salt solution HPA axis hypothalamic-pituitary-adrenal axis IP3 inositol trisphosphate
Abbreviation list
LTP long-term potentiation
MAP2 microtubule-associated protein 2 MAPK mitogen-activated protein kinase NF-κB nuclear factor-κB
NGF nerve growth factor NMDA N-methyl-D-aspartic acid PFA paraformaldahyde
PKA cAMP-dependent protein kinase A PKC protein kinase C
PI propidium iodide Urc urocortin
Urc2 urocortin 2 Urc3 urocortin 3
1. BACKGROUND
Adenosine is a modulator in the brain that binds to several G-protein coupled receptors (reviewed by Sebastião and Ribeiro, 2000). Among these, the adenosine receptors of A2A subtype (A2AR) are captivating targets to pharmacologic modulation. It has been
shown that their blockade is useful in stroke and stress related episodes (Cunha et al., 2006). The mechanism by which the blockade of A2AR is able to reverse stress effects
remains unknown. They could, presumably, interfere either in the regulation of the ac-tion of the glucocorticoids or alternatively, in the effects of the corticotrophin releasing factor (CRF) that are regulators of the Hypothalamic-Pituitary-Adrenal (HPA) axis. CRF was described in extrahypothalamic sites (Swanson et al., 1983), where it was shown to have a neuroprotective role against several brain insults, as excitatory amino acids, hypoxia or amyloid-β25-35 peptide (Aβ) (Fox et al., 1993; Chalmers et al., 1995;
Pedersen et al., 2001). Curiously, A2AR antagonists have the same properties in
neu-ronal cells (reviewed by Chen et al., 2007). We therefore hypothesised that the estab-lished neuroprotective effect achieved by blocking A2A receptors upon stress conditions
could be linked to an action on CRF mediated effects.
1.1. F
UNCTION OFC
ORTICOTROPHINR
ELEASINGF
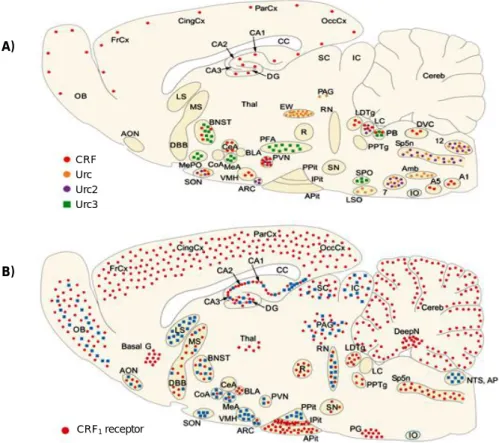
ACTORCorticotrophin Releasing Factor (CRF, formerly abbreviated CRH for Corticotrophin Releasing Hormone), a 41 amino acid peptide, is an important signalling molecule re-leased from paraventricular nucleus of hypothalamus (Vale et al., 1981). Together with adrenocorticotrophin hormone (ACTH) and glucocorticoids has an important role in HPA axis regulation upon stressful events (Vale et al., 1981). Interestingly, CRF is also implicated in modulation of anxiety, depression, food intake control, learning and mem-ory (reviewed by Sarnyai et al., 2001), which can be due to its expression in extrahypo-thalamic sites, as presented in Figure 1.1.A, like amygdala (central nucleus) and hippo-campus (GABAergic interneurons, Chalmers et al., 1995). Its basal physiological con-centration is around 38 pg/mL (approximately 8 pM) in adult human cerebrospinal fluid (Kling et al., 1991).
CRF binds to two families of G-protein-coupled receptors, subtype 1 and 2 (CRF1R and
CRF2R), which have more than 70% of amino acid sequence similarity and are present
both in neuronal and glial cells (Kapcala and Dicke, 1992; Lovenberg et al., 1995; Hauger et al., 2003). CRF binding activates several excitatory and inhibitory G-proteins with an order of potency: Gs≥Go>Gq/11>Gi>Gz (Hillhouse and Grammatopoulos, 2006)
1. Background
which results in an increase or decrease, respectively, of intracellular cyclic-AMP (cAMP) and inositol trisphosphate (IP3) levels (Grammatopoulos et al., 2001). These
molecules have different downstream effects as the increase of activation of cAMP-dependent protein kinase A (PKA), protein kinase C (PKC) or mitogen-activated protein kinase (MAPK, Rossant et al., 1999; Elliott-Hunt et al., 2002; Blank et al., 2003). The activation of these pathways increases the levels of glycogen synthase kinase 3β (GSK3β) and cAMP response element-binding protein (CREB), as well as its phos-phorylation (Bayatti et al., 2003) while nuclear factor-κB (NF-κB) is repressed (Lezoualc'h et al., 2000). As a consequence, the pattern of gene expression is altered (Rossant et al., 1999) which includes the upregulation of the transcription of CRF and of brain-derived neurotrophic factor (BDNF) genes (Spengler et al., 1992; West et al., 2001; Bayatti et al., 2005).
CRF receptors (CRFR) are widely distributed in the central nervous system (CNS, De Souza et al., 1985). CRF1R has an abundant yet selective expression in rat brain as
described in Figure 1.1.B (Chen et al., 2000). It expression is broadly complementary to the distribution of CRF binding sites, with higher expression in cortex, cerebellum, amygdala, hippocampus, and olfactory bulb (Potter et al., 1994). CRF2R receptor family
is composed by three splicing variants, CRF2(a)R, CRF2(b)Rand CRF2(c)R (reviewed in
Dautzenberg et al., 2001) that are expressed in more restricted brain areas compared to CRF1R. CRF2R is confined to subcortical structures, with higher levels in the lateral
septal nucleus and the hypothalamus but also in lower levels in olfactory bulb, amyg-dala and hippocampus (Chalmers et al., 1995; Van Pett et al., 2000).
The different CRF receptors have a complementary action in the regulation of HPA axis activity. While CRF1R triggers its activation by increasing ACTH release from pituitary,
CRF2R is required to its gradual attenuation by restablishing the corticosterone levels
after a stressful situation (reviewed by Reul and Holsboer, 2002). CRF1R is located
postsynapticaly in dendritic spines, close to excitatory synapses (Chen et al., 2004b; Chen et al., 2010) whereas CRF2R is located both in pre- and postsynaptic terminals of
the central nucleus of the amygdala (CeA) (Liu et al., 2004). In CeA, activation of CRF1R depresses while activation of CRF2R facilitate glutamatergic transmission (Liu
et al., 2004). These opposed actions and localizations suggest different roles of these receptors in CRF signalling in the CNS (Chalmers et al., 1995).
1. Background
Figure 1.1 – A) Distribution of mRNA encoding for the CRF and related peptides in rat brain.
Urocortin 1 (Urc), Urocortin 2 (Urc2) and Urocortin 3 (Urc3) are recently discovered peptides that bind to CRF receptors with different selectivity. B) Distribution of mRNA encoding for the CRF receptors in rat brain (CRF1R in red and CRF2R in blue). 7, facial nucleus; 12, hypoglossal nucleus; Amb, ambiguus nucleus; AON, anterior olfactory nucleus; AP, area postrema; Apit, anterior pituitary; ARC, arcuate nucleus; Basal G, basal ganglia; BLA, basolateral amygdala; BNST, bed nucleus of the stria terminalis; CA1–3, fields CA1–3 of Ammon's horn; CC, corpus callosum; CeA, central nucleus of the amygdala; Cereb, cerebellum; CingCx, cingulate cortex; CoA, cortical nucleus of the amygdala; DBB, diagonal band of Broca; Deep N, deep nuclei; DG, dentate gyrus; FrCx, frontal cortex; IC, inferior colliculi; IO, inferior olive; IPit, intermediate pitui-tary; LC, locus coeruleus; LDTg, laterodorsal tegmental nucleus; LS, lateral septal nucleus; LSO, lateral superior olive; MeA, medial nucleus of the amygdala; MePO, median preoptic area; MS, medial septum; NTS, nucleus tractus solitarii; OB, olfactory bulb; OccCx, occipital cortex; PAG, periaquaductal gray; ParCx, parietal cortex; PFA, perifornical area; PG, pontine gray, PPit, posterior pituitary; PPTg, pedunculopontine tegmental nucleus; PVN, paraventricular nucleus of hypothalamus; R, red nucleus; RN, raphe nuclei; SC, superior colliculi; SN, substantia nigra; SON, supraoptic nucleus; SP5n, spinal trigeminus nucleus; SPO, superior paraolivary nucleus; Thal, thalamus; VMH, ventromedial nucleus of hypothalamus. Adapted from Reul et al. (2002).
1.1.1. E
XTRAHYPOTHALAMIC ROLE OF CORTICOTROPHIN RELEASING FACTORThe hippocampus is a brain area crucial for learning and memory and particularly sus-ceptible to stress effects (Foy et al., 1987). In hippocampus, CRF has modulatory ac-tions, particularly excitatory. CRF increases the frequency of spontaneous discharges of hippocampal neurons (Aldenhoff et al., 1983). It also promotes a long-lasting en-hancement in synaptic efficacy given by an increase of amplitude and slope of
popula-A) B) CRF1 receptor CRF2 receptor CRF Urc Urc2 Urc3
1. Background
tion excitatory postsynaptic potentials (Wang et al., 1998). CRF is also involved in neu-ronal plasticity both in long-term potentiation (LTP) and long term depression (LTD) (Wang et al., 1998; Miyata et al., 1999). However, the CRF receptor subtype involved in this hippocampal plasticity is still unknown.
These synaptic actions reveal both an immediate as well as a delayed gene dependent effect of CRF in the brain.
CRF is released during an hypoxic or ischemic event and acts as a neuroprotective factor at nanomolar or even picomolar concentrations, in hippocampal slice or using hippocampal or cortical primary cultures, respectively (Fox et al., 1993; Pedersen et al., 2001). In primary culture neuronal cells, death induced by neurotoxic insults, as FeSO4,
4-hydroxynonenal (HNE), amyloid-β25-35 peptide (Aβ) or glutamate, can be almost
com-pletely reverted with exogenous CRF application (Pedersen et al., 2001; Elliott-Hunt et al., 2002). This effect is consistent in several brain areas (cerebral cortex, hippocampus and cerebellum, Bayatti et al., 2003). CRF also provides moderate protection against an hypoxia insult in a brain slices preparation (Fox et al., 1993). It is speculated that this neuroprotection is due to an increased expression of BDNF, or other neurotrophins, triggered by CRFR activation (Bayatti et al., 2005; Hauger et al., 2009). CRF neuropro-tective actions can still be observed during or a few hours after a glutamate insult (Elliott-Hunt et al., 2002), which could have therapeutic implications in patients with cerebral ischemia.
1.2. A
DENOSINE INFLUENCE ON NEUROPROTECTION:
MODULATION BY ADENOSINE RECEP-TORSAdenosine receptors are another pharmacological target to achieve neuroprotection in the brain. Adenosine is present in all cells as an important molecule in cellular metabo-lism (Levene and Tipson, 1931). However, the roles of adenosine are beyond it, acting in brain cells as a neuromodulator, either directly by modulating postsynaptic re-sponses or by modulating the response of other receptors (Sebastião and Ribeiro, 2009).
The biological role of adenosine is carried by widespread and high affinity receptors, A1R and A2AR, and low affinity receptors, A2BR and A3R(Fredholm et al., 2001). These
1. Background
ways with consequent activation of CREB (Cunha and Ribeiro, 2000). Different types of K+, Na+ and Ca2+ channels are also regulated by adenosine receptors (for review see Ribeiro et al., 2003b).
The neuronal modulation by adenosine depends on a balance between A1R and A2AR
activation. Since extracellular adenosine is enough to tonically activate both receptors, their selective activation is directly related to their levels in the different brain areas. A1R that are pre-, post- and non-synaptic (Schubert et al., 1994) have a widespread
distribution, with higher levels on hippocampus, cerebral cortex and cerebellum (Reppert et al., 1991). In the hippocampus, A1R act either pre-synaptically by inhibiting
glutamate release from nerve terminals (Dunwiddie and Haas, 1985) and post-synaptically through NMDA receptors inhibition (de Mendonca et al., 1995; Rebola et al., 2003).
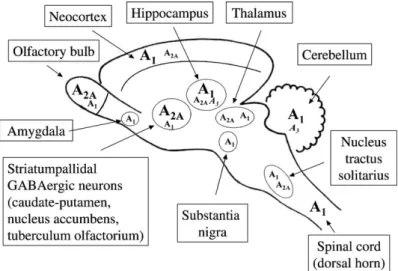
In an opposed pattern, as showed in Figure 1.2, A2AR are less expressed in those
ar-eas but with abundant distribution in striatum and olfactory blub (Jarvis and Williams, 1989; Ribeiro et al., 2003b). A2AR are located both pre- and post-synaptically within
these brain areas but also in cortex and hippocampus (Li and Henry, 1998; Hettinger et al., 2001).
Figure 1.2 - Distribution of adenosine receptors in the main regions of the rat central nervous
system. Higher levels of expression are indicated by bigger font sizes (from Ribeiro et al., 2003b).
Adenosine is continuously formed in intracellular and extracellular medium. When pro-duced intracellularly, adenosine is exported by specific transporters, reaching nanomo-lar values in normal conditions (40 to 110 nM, Balnanomo-larin et al., 1991). Besides this con-tinuous release, extracellular adenosine levels are increased by specific neurotransmit-ters action (Carswell et al., 1997; Delaney and Geiger, 1998). As an example,
adeno-1. Background
sine nucleotides are coreleased with glutamate to extracellular medium (Schousboe et al., 1989) and consequently hydrolysed to adenosine by extracellular nucleotidases (reviewed by Zimmermann, 1992). During excitotoxic events, as ischaemia, excitatory amino acids are over released and extracellular adenosine levels rises more than 20 fold (Andine et al., 1990). The extracellular concentration of adenosine also affects its modulatory function. In cortex or hippocampus, if adenosine reaches elevated levels, like in ischemic insult, it would desensitize the inhibitory A1R while the excitatory A2AR
remain active (Fernandez et al., 1996; Fredholm, 1997), leading to an exacerbated cell death. Additionally, in in vitro experiments, glutamate insult to cultured cortical neurons increases both A1R and A2AR levels (Castillo et al., 2010), leading to a new different
ratio between these two receptors that was already shown to alter receptor signalling pathways (Lopes et al., 1999a, 1999b).
Pharmacologic modulation of adenosine receptors is being pointed as neuroprotection in stroke, several degenerative diseases, epilepsy and multiple sclerosis (reviewed by Ribeiro et al., 2003a). A notable neuroprotection was acquired by A1R activation
through a reduction of neuronal excitability but it was dismissed by unwanted peripheral effects including sedation, bradycardia and hypotension (reviewed by Fredholm et al., 2005). In absence of A1R pharmacological modulation, A2AR antagonists are used to
control the disproportionate release of excitatory amino acids, which is involved in neu-ronal toxicity (reviewed by Chen et al., 2007). This neuroprotective effect of A1R
activa-tion or A2AR blockade was observed both in vitro and in vivo (Gao and Phillis, 1994;
2. AIM
Glutamate excitotoxicity is responsible for neuronal death in hypoxia. The release of adenosine that occurs as a consequence of hypoxic events is accompanied by an in-crease in the levels of the stress regulator, corticotrophin releasing factor (CRF) in the brain. In addition, the in vivo modulation of adenosine receptor of A2A subtype (A2AR) is
responsible for the reversion of stress-induced effects in the hippocampus (Batalha et al., 2010). This raises the question whether A2AR regulate the main stress mediators,
either CRF or glucocorticoids. We now intended to disclose a possible pharmacological synergy between the neuroprotective effects of A2AR blockade and the activation of
CRF receptors (CRFR), under stress conditions as glutamate insult.
To achieve that purpose, four major tasks were designed:
1st – Optimize an in vitro glutamate insult model using primary neuronal cultures from rat brain cortex.
2nd - Evaluate the effect of the CRF receptors activation in glutamate-induced cell death. Discriminate the CRF receptor subtype involved by selectively blocking the CRF1R or the CRF2R.
3rd - Disclose the functional interaction between A2A and CRF receptors in the
pre-viously established model, by pharmacologic modulation of these receptors.
4th – Evaluate the ability of CRF receptor activation in modulating the A2AR levels,
3. METHODS
3.1. P
RIMARY RAT CORTICAL NEURONAL CULTURESCortical neurons were cultured from 18 to 19 days Sprague Dawley rat embryos (E18-E19, adapted from Brewer, 1997; Castro et al., 2004). The pregnant rat was anes-thetized with Halothane (Sigma, Spain) and decapitated. The embryos were collected in HBSS (Hanks’ Balanced Salt Solution, Gibco, UK) medium and rapidly decapitated. Meninges and white mater were removed and cortices were incubated 15 minutes in HBSS (now with Calcium 1mM and Magnesium 1mM, Gibco/Invitrogen, UK) and 0.025% trypsine. Cells were centrifuged 3 times and washed with HBSS (with Calcium 1mM and Magnesium 1mM, supplemented with 10% FBS, Gibco) and resuspended in Neurobasal Medium (Gibco/Invitrogen, UK). After counted, cells were plated on poly-L-lysine-coated 24-well or 6-well plates at densities of 8x10⁴ cells/coverslip (cell viability and immunocytochemistry assays) or 1.2x10⁶ cells/well (Western blotting). Neurons were grown for 8-9 days at 37°C in a 5% CO2 humidified atmosphere in
Neurobasal medium with 2% B-27 supplement (Gibco/Invitrogen, UK), glutamate 25 µM (Sigma, Spain), glutamine 0.5 mM (Gibco/Invitrogen, UK), and 2 U/mL Pen/Strep (Sigma, Spain). Medium was totally replaced by day 4 (without glutamate) and 60 minutes before drug treatment (without glutamate and B-27 supplement).
3.2. PC12
CELLSPC12 cells, first described by Greene and Tischler (1976), are derived from a sponta-neous rat pheochromocytoma. These cells were purchased from Sigma (Spain) and used to observe variations in protein levels by Western blotting technique. To minimize the risk of mutations, passages between 10 and 20 were used in all procedures.
Cells were grown at 37°C in a 5% CO2 humidified atmosphere in DMEM (Dulbecco’s
modified Eagle's medium, Invitrogen 41966-029) supplemented with essential amino-acids (Sigma M7145, UK), 2 U/mL Pen/Strep (Sigma, Spain), glutamine 0.5mM (Gibco/Invitrogen, UK) and 10% of Fetal Bovine Serum (FBS). Cells were splitted each 14 days and cell medium changed weekly. A new set of cells was prepared by lifting the cells by trypsine catalysis (0.025% for 5 minutes at 37ºC). Cells were counted and inserted in 6-well plates (150 000 cells/well, in 2mL of DMEM with 10% FBS). Cell me-dium was changed in day 4 and 60 minutes prior to cell treatment.
3. Methods
3.2.1. PC12
DIFFERENTIATION WITHNGF
PC12 cells can differentiate in a more neuronal phenotype upon treatment with nerve growth factor (NGF) 50 ng/mL for 7 days (Greene and Tischler, 1976). Cells were plated at 100 000 cells/mL confluency in previously described medium supplemented with 50ng/mL of NGF 7S for 7 days. After that period, visual detection of branching was confirmed.
3.3. G
LUTAMATE INSULTIn primary cultured neuronal cells with 9 days in vitro, L-glutamic acid (or glutamate) was used as neurotoxic insult in 20 to 1000 µM range for 24 hours (Tamura et al., 1993). Other neurotoxic insults like Kainate 100 µM, Kainate 100 µM + Cyclothiazide 30 µM (Rebola et al., 2005) and Staurosporine 1 µM (Pike et al., 1998) were used in this model but no increase in an apoptotic marker (pro-caspase-3 cleavage to caspase-3 on western blotting technique) was observed. Same glutamate treatment was tried in PC12 cells but cell viability was preserved. Amiloid-β25-35 peptide (Aβ, 25 µM) was used
as positive control for apoptosis (Estus et al., 1997).
3.4. P
RE-
INCUBATION WITH AGONISTS AND ANTAGONISTS OFCRF
AND ADENOSINEA
2ARECEPTORS
Receptors’ antagonists were applied 15 minutes before cell insult, while their agonists were placed in cell medium right before glutamate or Aβtreatment. Urocortin was pre-ferred to CRF because it binds to CRF1R and CRF2R with similar affinity, while CRF
binds with higher affinity (20 fold) to CRF1R than CRF2R (reviewed in Dautzenberg et
al., 2001). Antalarmin is a specific CRF1R non-peptide antagonist (Ki=1nM) that has
almost no affinity to CRF2R (Chen et al., 1996; Webster et al., 1996). anti-Sauvagine-30
(a-Sau) blocks CRF2R (Ki=1.4nM) and CRF1R (Ki=154 nM) differently (Ruhmann et al.,
1998).
As reviewed by Klotz (2000), A2AR agonist CGS 21680 is highly specific for this subtype
of receptors (Ki=27nM, versus 290nM, 89µM and 67nM of A1, A2B and A3 receptors).
SCH 58261 has a high affinity to A2AR (Ki=0.6nM, while A1, A2B and A3 receptors have
higher values of Ki).
3. Methods
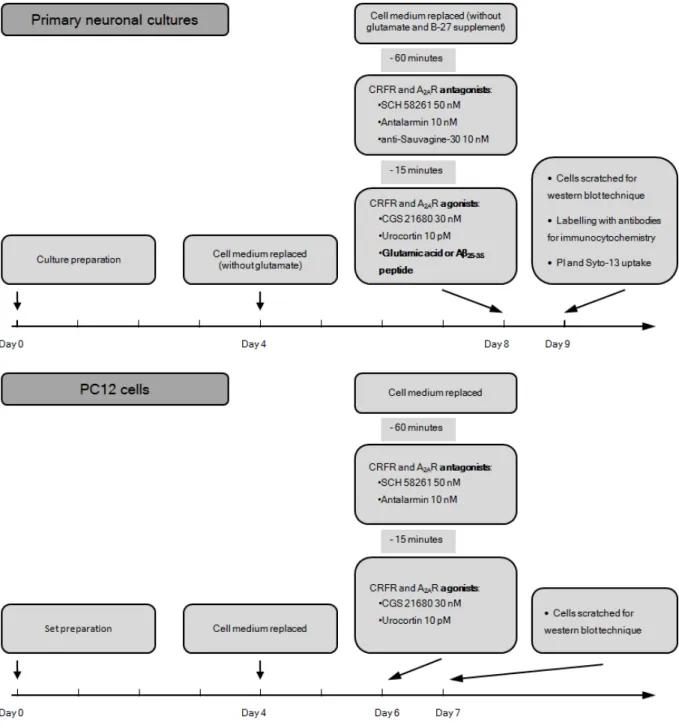
Figure 3.1 – Summary of treatment protocols of primary neuronal cultured cells and PC12 cells.
3.5. P
ROPIDIUMI
ODIDE ANDS
YTO-13
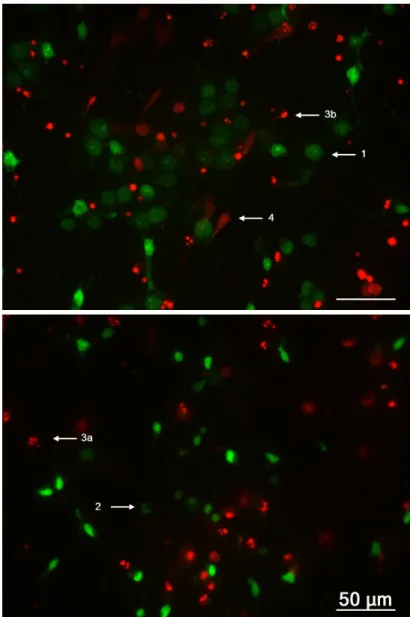
UPTAKE ASSAYTo distinguish the mechanism involved in cell death, cells were incubated simultane-ously with two fluorescent nucleic acid stains (Jones and Senft, 1985): Syto-13 (Invitro-gen, USA), capable of enter on living cells and emits at 509 nm when excited at 488 nm, and Propidium Iodide (PI, Sigma, Spain), which only enters cells through a disrupted membrane, absorbing preferentially at 535 nm and emitting at 617 nm.
Cells previously growth in a coverslip were removed from the incubator and washed with KREBS-HEPES (117 mM NaCl, 3 mM KCl, 10 mM Glucose, 26 mM NaHCO3,
incu-3. Methods
bated with Syto-13 (4 µM) and PI (5 µg/mL) for 3 minutes at room temperature, followed by direct observation on Axiovert 200 fluorescence microscope using filter sets 10 (ex-citation 450-490nm and emission 515-565nm) and 15 (ex(ex-citation 534-558nm and emis-sion above 590nm). Three to four arbitrary photographs from each coverslip were shot and an average of 1600 cells was counted per condition in each experiment. As pre-sented in Figure 3.2, viable cells are prepre-sented with homogeneous cell body labelled with Syto-13, whereas primary and secondary apoptotic cells show fragmented or con-densed nucleus (respectively labelled with Syto-13 or PI). Necrotic cells are presented as diffuse blots, emitting in PI range (Canas et al., 2009). This method has the disad-vantage of exclude cells that detached the coverslip, by random events but also by the drug treatment of each coverslip.
3. Methods
After cell counting, the formula used to obtain cell viability was:
% =
Equation 1 – Formula to obtain cell viability trough PI and Syto-13 labelling technique. The
num-ber of living cells corresponds to the ones that do not present any apoptotic or necrotic marker (represented as number 1 in Figure 3.2), whether total cells include the living plus the dying cells obtained from the sum of the cells that present apoptotic (2 and 3 from Figure 3.2) or ne-crotic markers (4 from Figure 3.2).
3.6. I
MMUNOCYTOCHEMISTRYThis technique, firstly discovered by Coons et al. (1942), was used to characterize pri-mary cortical neuronal cultures with 9 days in vitro. After cell medium removed, cells were washed with PBS (137 mM NaCl, 2.7 mM KCl, 1.8 mM KH2PO4 and 10 mM
Na2HPO4, pH 7.4) and fixed for 10 minutes at room temperature with 4% PFA in PBS.
After PBS washes cells were permeabilizedwith 0.1% Triton-X in PBS 0.1% gelatine. Cells were incubated for 1 hour at room temperature with primary antibodies diluted in PBS 0.1% gelatine (mouse anti-MAP2 1:200, Millipore MAB3418, and rabbit anti-GFAP 1:100, Sigma G9269). After washes (0.05% Tween-20 in PBS) cells were incubated with secondary antibodies diluted in PBS 0.1% gelatine (anti-mouse Alexa Fluor568 and anti-rabbit Alexa Fluor 488, both 1:400, from Invitrogen). DAPI (70 µg/mL, Sigma) was used to label cell nucleus. Coverslips were mounted with MOWIOL (Sigma) and cells were observed in Axiovert 200 fluorescence microscope.
3.7. P
REPARATION OF TOTAL PROTEIN EXTRACTSCells from primary cultures with 9 days in vitro and PC12 cells with 7 days of NGF dif-ferentiation were washed with cold PBS. Using NP-40 lysis buffer pH 8.0 (1% Nonidet P40, 150 mM NaCl, 50 mM Tris-base, 1 mM EDTA, 5 mM DTT, proteases inhibitors - Complete, EDTA-free Protease Inhibitor cocktail tablets, Roche) cells were mechani-cally scratched. The resulting solution was centrifuged at 13 000 rpm during 10 minutes at 4oC and pellet (composed by cell nucleuses, intact cells and cell’s residues) was discarded while the supernatant, composed by cellular proteins, was used in western blotting technique.
3.8. W
ESTERN BLOTTINGThe protein concentration was achieved using the BioRad DC Protein assay Kit based on Lowry (1951) due to the high levels of detergents in the sample. The appropriate volume of each sample was diluted with water and sample buffer (350 mM Tris pH 6.8,
3. Methods
30% glycerol, 10% SDS, 600 mM DTT and 0.012% Bromophenol blue). The samples were denatured either at 60-70oC for 15-20 minutes in the particular case of A2A
recep-tor or at 95oC for 5 minutes for caspase-3.
Based on protocol of Towbin et al. (1979), the samples, the molecular weight markers and positive control (rat striatum homogenate for A2AR) were separated by SDS-PAGE
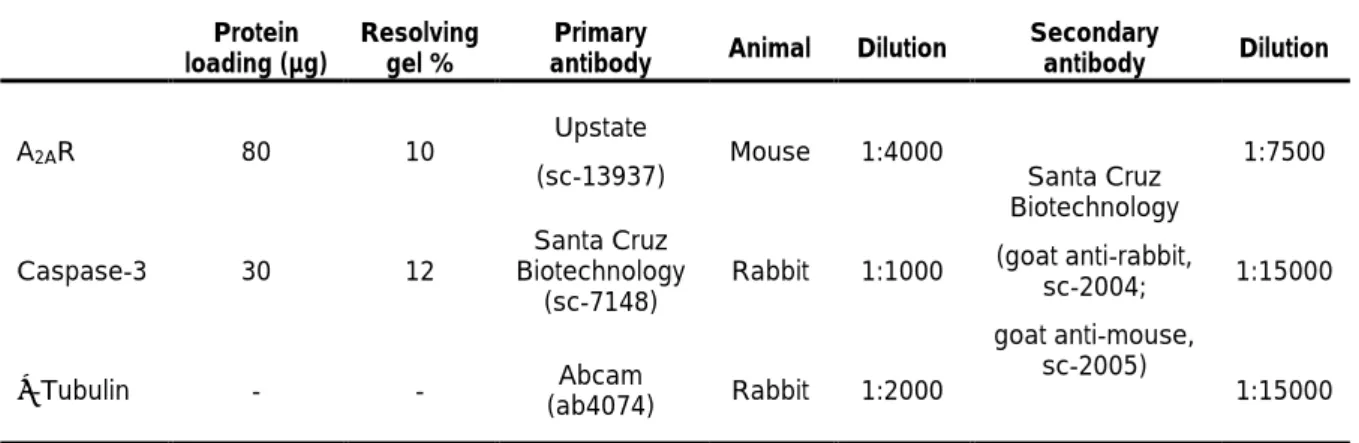
(10% or 12% according to the protein molecular weight and a 5% stacking) in denatur-ing conditions and electro-transferred to nitrocellulose membranes (GE Healthcare) or PVDF membranes (Millipore). The percentage of resolving gels and protein loading amounts are summarized in Table 1. Membranes were blocked with 5% non-fat dry milk for 1 hour, washed with TBS-T 0.1% (Tris Buffer Saline with 0.1% Tween-20 solu-tion, 200 nM Tris, 1.5 M NaCl,) and incubated with primary antibody (diluted in TBS-T, 3% Bovine Serum Albumin and 0.1% NaN3) overnight at 4ºC. After washing again for
30 minutes, the membranes were incubated with horseradish peroxidise (HRP, EC 1.11.1.7) conjugated secondary antibody (in 5% non-fat dry milk) for 1 hour at room temperature (primary and secondary antibody dilutions are in Table 1). After 40 minutes of washing with TBS-T followed by 20 minutes in TBS (same as TBS-T without 0.1% Tween-20), chemoluminescent detection was performed with ECL-PLUS western blot-ting detection reagent (GE Healthcare) using X-Ray films (Fujifilm). Optical density was determined with Image-J software and normalized to the respective α-tubulin or pro-caspase-3 band density.
Table 1 – Primary and secondary antibodies used in western blotting technique.
Protein loading (µg)
Resolving gel %
Primary
antibody Animal Dilution
Secondary
antibody Dilution
A2AR 80 10
Upstate
(sc-13937) Mouse 1:4000 Santa Cruz
Biotechnology (goat anti-rabbit, sc-2004; goat anti-mouse, sc-2005) 1:7500 Caspase-3 30 12 Santa Cruz Biotechnology (sc-7148) Rabbit 1:1000 1:15000 α-Tubulin - - Abcam (ab4074) Rabbit 1:2000 1:15000
3.9. P
HARMACOLOGICAL AGENTS3. Methods
chased from Tocris (UK). Aβ25-35 peptide was from Bachem (Switzerland). These drugs
were diluted in the assay solution from sock aliquots made in water or DMSO stored at -20oC. All other reagents used were of the highest purity available and proper for cell cultures.
3.10. S
TATISTICSThe values presented are mean ± SEM of n independent experiments. In primary neu-ronal cell culture, each n is related to results obtained from embryos of different preg-nant rats. In PC12 cells, each n represents one different passage of cells of a new thawed set. In statistical tests between three or more conditions, a one way ANOVA was used, followed by a Bonferroni's Multiple Comparison post hoc test. Values of P<0.05 were considered to be statistically significant. In each comparison, the following code was used: * P<0.05; ** P<0.01; *** P<0.001 to compare one condition to the con-trol. # P<0.05; ## P<0.01; ### P<0.001 to compare one condition to glutamate 100µM. ‡ P<0.05; ‡‡ P<0.01; ‡‡‡ P<0.001 to compare with other condition rather than control or glutamate 100µM.
4. RESULTS
4.1. C
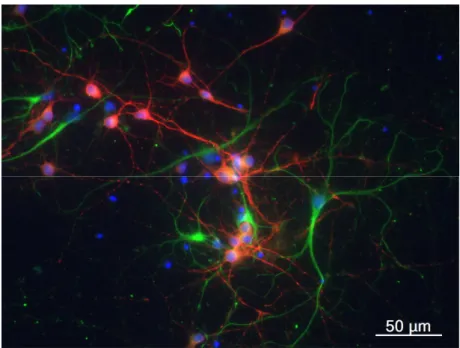
HARACTERIZATION OF THE PRIMARY NEURONAL CELL CULTURESPrimary cortical neuronal cultures with 9 days in vitro (DIV) were used during the first part of this work. The cell preparation was labelled with anti-MAP2 (microtubule-associated protein 2 – neuronal marker) and anti-GFAP (glial fibrillary acidic protein – astrocyte marker) antibodies. Approximately 50% of cells were found to be red labelled, related to anti-MAP2 expression (Figure 4.1). The contamination with astrocytes was less than 20%, as shown by the cells positive for anti-GFAP green labelling. The re-maining cells, labelled with DAPI, did express neither MAP-2 nor GFAP.
Figure 4.1 - Primary cortical neuronal culture with 9 days in vitro in control condition. Neurons
are labelled with anti-MAP2 antibody that emits red radiation, whereas astrocytes present a green colour by staining with anti-GFAP antibody. Cell nucleus is marked with DAPI, which emits blue radiation. The photograph is from one representative cell culture preparation in the control condition.
4.2. C
ELL VIABILITY UPON GLUTAMATE INSULTGlutamate exerts neurotoxic damages to cortical cultured cells through caspase-3 pathway activation (Du et al., 1997; Castro et al., 2004). This excitatory amino acid ac-tivates NMDA receptors leading to an increase of intracellular Ca2+and Na+ (Schramm et al., 1990) and consequently to necrosis and apoptosis (Ankarcrona et al., 1995). Neuronal cultures were treated for 24 hours with five different glutamate concentrations (20, 50, 100, 500 and 1000 µM) that intended to represent several degrees of cell injury either by apoptosis or necrosis (Bonfoco et al., 1995). Amiloid-β25-35 peptide (Aβ,
4. Results
control in cell viability assessment. Cell survival upon glutamate insult was obtained by labelling with propidium iodide (PI) which is incorporated by dying or death cells emit-ting in red band of spectrum and with Syto-13 which stains with green living cells. Control (CTR) cells with 9 days in vitro presented approximately 64.4 ± 0.834% (n=6) of viability that correspond to the percentage of cells that do not present any apoptotic or necrotic markers, i.e. condensed or fragmented apoptotic nucleus, either green or red, or characteristic red blots of necrotic cells. As presented in Figure 4.2, preincubation with glutamate resulted in a reduction of cell viability, in a concentration-dependent manner, reaching the minimum viability of 66.2 ± 5.97% (normalized to the control, P<0.001, n=3) for glutamate 1000 µM.
Figure 4.2 - Glutamate reduces cell
viability in a concentration dependent manner. Primary cortical cultures presents a lower rate of survival on Aβ25-35 peptide and glutamate treat-ment (20 µM to 1000 µM range, 24 hours) observed by PI and Syto-13 staining technique. A) Representa-tive images from each condition a) Aβ 25 μM; b) Control (CTR); c) Glu-tamate 20 µM; d) GluGlu-tamate 50 µM;
e) Glutamate 100 µM; f) Glutamate
500 µM; and g) Glutamate 1000 µM. Green cells incorporated Syto-13 while red cells are labelled with PI. Scale bar represents 50 µm. B) Percentage of cell viability in previously described conditions, compared to control. During all experiments control has approximately 65% of viable cells (all
A)
Neuronal apoptosis induced by glutamate insult is mediated by caspase
1997). Caspase-3 is an effector caspase responsible for the late apoptotic process stages that leads to controlled cell death
pase-3 fragment formed
blotting technique as an apoptotic marker.
Caspase-3 levels were
shown in Figure 4.3. The caspase
concentration reaching a maximum level at 50 µM n=3). For higher concentrations
relation to the maximum level. caspase-3 levels (185
shown).
Figure 4.3 – Glutamate insult
homogenates. Using Western blotting, the specific caspase to pro-caspase-3 in each condition. Aβ
caspase-3 fragmentation
*** P<0.001 compared to control
ferroni post hoc test. At the top a representative image of the western blo
4.3. E
FFECT OF CORTICOTROPHIN REUrocortin, a CRF family peptide, activates both subtype 1 and 2 CRF1R and CRF2R (Vaughan et al., 1995)
immediately before glutamate
al apoptosis induced by glutamate insult is mediated by caspase
3 is an effector caspase responsible for the late apoptotic process that leads to controlled cell death (Porter and Janicke, 1999; Zeiss, 2003)
fragment formed by hydrolysis from pro-caspase-3 was quantified technique as an apoptotic marker.
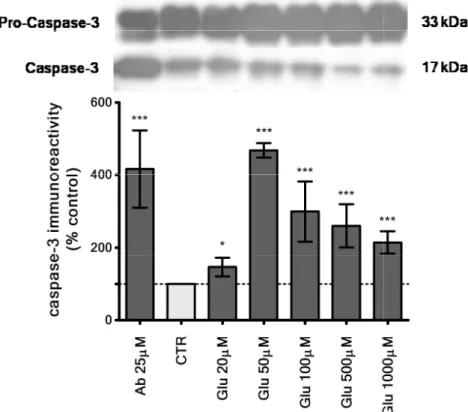
were increased in glutamate and Aβ25-35 peptide treated cells, as
. The caspase-3 levels were gradually increased
reaching a maximum level at 50 µM (468 ± 20.3% of control, P<0.001 ncentrations of glutamate, caspase-3 levels slightly decreased in relation to the maximum level. Staurosporine, an apoptosis inducer,
3 levels (185±83.0% of control, non significative from control
Glutamate insult (20 to 1000 µM) increases caspase-3 levels in primary cortical homogenates. Using Western blotting, the specific caspase-3 immunoreactivity
3 in each condition. Aβ25-35 peptide 25 µM was used as positive control in fragmentation. Each bar is the mean ± SEM of three to four experiments. * P<0 compared to control calculated using a one way ANOVA test, followed by a
. At the top a representative image of the western blo
OF CORTICOTROPHIN RELEASING FACTOR ON GLUTAMATE NEUROTOXICIT
Urocortin, a CRF family peptide, activates both subtype 1 and 2 (Vaughan et al., 1995). Urocortin 10pM was applied glutamate (20 to 1000 µM range). In Figure 4
4. Results
al apoptosis induced by glutamate insult is mediated by caspase-3 (Du et al., 3 is an effector caspase responsible for the late apoptotic process (Porter and Janicke, 1999; Zeiss, 2003).
Cas-quantified by Western
peptide treated cells, as 3 levels were gradually increased through glutamate % of control, P<0.001, 3 levels slightly decreased in , an apoptosis inducer, failed to increase non significative from control, n=3, data not
3 levels in primary cortical cells 3 immunoreactivitywas normalized peptide 25 µM was used as positive control in pro-. Each bar is the mean ± SEM of three to four experimentspro-. * P<0pro-.05;
calculated using a one way ANOVA test, followed by a Bon-. At the top a representative image of the western blot is presentedBon-.
UTAMATE NEUROTOXICITY
Urocortin, a CRF family peptide, activates both subtype 1 and 2 of CRF receptors, 10pM was applied to cell medium 4.4 it is possible to
ob-4. Results
serve that urocortin increased cell survival in the presence of glutamate, reaching sta-tistical significance for 50 µM (from 77.7±1.31% to 88.6±1.36%, P<0.01, n=3) and for 100 µM (from 76.4±1.63% to 90.5±2.23%, P<0.001, n=3). For higher concentrations of glutamate (500 and 1000 µM) urocortin did not change cell viability as compared to glutamate alone. Urocortin by itself did not alter cell viability (95.3±2.44% compared to control 100±1.29%, n=3).
Figure 4.4 – Urocortin 10 pM (Urc, a
CRFR agonist) avoids cell death by glutamate insult observed by PI and Syto-13 staining technique. A) Repre-sentative images of several condi-tions: a) CTR; b) Urocortin 10 pM; c) Glutamate 20 µM; d) Glutamate 20 µM + urocortin 10 pM; e) Glutamate 50 µM; f) Glutamate 50 µM + urocortin 10 pM; g) Glutamate 100 µM; h) Glu-tamate 100 µM + urocortin 10 pM; i) Glutamate 500 µM; j) Glutamate 500 µM + urocortin 10 pM; k) Gluta-mate 1000 µM; and l) GlutaGluta-mate 1000 µM + urocortin 10 pM. Scale bar represents 50 µm. B) Graphic repre-sentation of previous described condi-tions. Darker grey bars represent
glu-A)
In parallel to cell viability assays, The results obtained,
pase-3 formation. Compared dency to increase caspase
and to decrease it in the second segment (above gluta did not change this terminal apoptotic marker
compared to control, n=3)
Figure 4.5 – Caspase-3 immunoreactivity
immunoreactivity for each condition was normalized to the one of pro represent the values of
trations. In brighter grey
Results are mean ± SEM of three to four experiments. control, ‡‡ comparing the two shown conditions, lowed by a Bonferroni
presented.
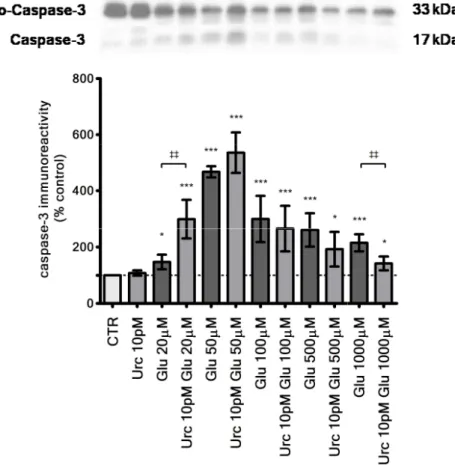
In parallel to cell viability assays, caspase-3 levels were measured by The results obtained, represented in Figure 4.5, present the role of
mation. Compared to the same glutamate concentration,
caspase-3 in the first segment of the curve (below glutamate 5 in the second segment (above glutamate 100 µM). Urocortin alone ange this terminal apoptotic marker (108±9.13%, non significative
compared to control, n=3).
3 immunoreactivity observed by western blotting technique. Caspase for each condition was normalized to the one of pro-caspase
the values of pro-caspase-3 fragmentation in previously described glutamate conce grey are shown the same glutamate concentration with
Results are mean ± SEM of three to four experiments. * P<0.05 and *** P<0.
comparing the two shown conditions, calculated using a one way ANOVA test lowed by a Bonferroni post hoc test. At the top a representative image of the western blot is
4. Results
3 levels were measured by Western blotting. the role of urocortin in cas-to the same glutamate concentration, urocortin had a ten-of the curve (below glutamate 50 µM)
00 µM). Urocortin alone , non significative differences
by western blotting technique. Caspase-3 caspase-3. Dark grey bars in previously described glutamate concen-the same glutamate concentration with urocortin 10 pM.
*** P<0.001 compared to calculated using a one way ANOVA test
4. Results
Glutamate 100 µM was the concentration selected for the following experiments. At this concentration, glutamate causes mild apoptosis that is characterized by condensed nucleus without DNA fragmentation (see Figure 4.4.e for an example), in opposite to lower glutamate concentrations where apoptosis is characterized by nucleus fragmen-tation, as glutamate 20 µM (see Figure 4.4.c). Glutamate 100 µM is enough to induce measurable cell death and simultaneously avoid cell detachment caused by cell necro-sis (Ankarcrona et al., 1995). Higher concentrations of glutamate are associated to cell necrosis (with consequent plate detaching) while lower concentrations resulted in an insignificant amount of cell death as observed in this work and in previous ones (Ankarcrona et al., 1995).
We now intended to describe the subtype of CRFR that is responsible for this protec-tion by using selective CRF1R and CRF2R antagonists, respectively antalarmin 10nM
(Ant, firstly discovered by Chen et al., 1996) and anti-Sauvagine-30 10nM (a-Sau, presented by Ruhmann et al., 1998).
According to Figure 4.6, the previously observed protection by urocortin 10pM against cell death was lost by blocking CRF1R or CRF2R independently, by antalarmin
(de-creasing from 90.5± 2.23% to 73.9± 3.53%, P<0.01, n=4) or anti-Sauvagine-30 (from 90.5± 2.23% to 76.0±2.80%, P<0.01, n=4). Curiously, when the two antagonists were applied simultaneously, the effect of urocortin was not prevented. The effect of the two antagonists in the absence of urocortin did not affect cell death induced by glutamate 100 µM (76.4±1.63%, with glutamate 100 µM, and 70.4±3.97%, glutamate 100 µM plus both antagonists, n=4). In addition, the two antagonists applied together did not affect cell viability by themselves, in the absence of the glutamate insult (99.0±3.88%, Figure 4.7, 6th bar).
The effect of the different drugs alone on cell viability was controlled (Figure 4.7). Glu-tamate 100µM reduced cell viability by 23.6±1.63% (P<0.001, n=4), whereas neither CRFR nor A2AR ligands affected cell viability assessed by PI and Syto-13 labelling.
4. Results
Glu 100 µM - + + + + + +
Urc 10 pM - - + + + + -
Ant 10 nM - - - + - + +
a-Sau 10 nM - - - - + + +
Figure 4.6 – Assessment of cell viability by PI and Syto-13 labelling method in presence of
glu-tamate 100 µM and CRFR agonist (Urc 10 pM) and antagonists (Ant 10 nM and a-Sau 10nM).
A) Representative images of each condition are presented: a) CTR; b) Glutamate 100 µM; c)
Glutamate 100 µM + urocortin 10 pM; d) Glutamate 100 µM + urocortin 10 pM + antalarmin 10 nM; e) Glutamate 100 µM + urocortin 10 pM + anti-Sauvagine-30 10 nM; f) Glutamate 100 µM + urocortin 10 pM + antalarmin 10 nM + anti-Sauvagine-30 10 nM; and g) Glutamate 100 µM + antalarmin 10 nM + anti-Sauvagine-30 10 nM. Scale bar represents 50 µm. B) Graphic summary of previous conditions. Lines at 100% and near 80% represent control and glutamate 100 µM. Each value is mean ± SEM of three to four experiments. * P<0.05 and *** P<0.001 compared to control; ### P<0.001 compared to glutamate 100 µM; ‡‡ P<0.01; ‡‡‡ P<0.001 comparing the selected conditions, calculated using a one way ANOVA test followed by a Bonferroni post hoc test.
A)
4. Results Glu 100 µM - + - - - - Urc 10 pM - - + - - - - - Ant 10 nM - - - + - + - - a-Sau 10 nM - - - - + + - - CGS 21680 30 nM - - - + - SCH 58261 50 nM - - - +
Figure 4.7 – Effects of each drug on cell viability by PI and Syto-13 labelling. A) Representative
images of each condition are presented: a) CTR; b) Glutamate 100 µM; c) Urocortin 10 pM;
d) Antalarmin 10 nM; e) anti-Sauvagine-30 10 nM; f) Antalarmin 10 nM + anti-Sauvagine-30
10 nM g) CGS 21680 30 nM; h) SCH 58261 50 nM. Scale bar represents 50 µm. B) Graphic summary of previous conditions. Lines at 100% represent control. Each value is mean ± SEM of three to five experiments. *** P<0.001 compared to control, calculated using a one way ANOVA test followed by a Bonferroni post hoc test.
4.4. I
NVOLVEMENT OFA
2A RECEPTORS ONCRF
NEUROPROTECTIONIt was previously described that activation of adenosine A2A receptors (A2AR) leads to
an exacerbated cell death. In an opposite way, blockade of A2AR reverses glutamate
induced cell death (Castillo et al., 2010). We now studied the possible interaction
be-A)
4. Results Glu 100 µM - + + + + + + + + + Urc 10 pM - - + - + + + + + + Ant 10 nM - - - + + - - + a-Sau 10 nM - - - + + + SCH 58261 50 nM - - - + + - + - + +
Figure 4.8 – A2AR blockade changes cell viability obtained by PI and Syto-13 labelling method.
A) Representative images of different conditions: a) CTR; b) Glutamate 100 µM; c) Glutamate
100 µM + urocortin 10 pM; d) Glutamate 100 µM + SCH 58261 50nM; e) Glutamate 100 µM + urocortin 10pM + SCH 58261 50nM; f) Glutamate 100 µM + urocortin 10pM + antalarmin 10nM;
g) Glutamate 100 µM + urocortin 10pM + antalarmin 10nM + SCH 58261 50nM; h) Glutamate
100 µM + urocortin 10pM + anti-Sauvagine-30 10nM; i) Glutamate 100 µM + urocortin 10pM + anti-Sauvagine-30 10nM + SCH 58261 50nM; and j) Glutamate 100 µM + urocortin 10pM + antalarmin 10nM + anti-Sauvagine-30 10nM + SCH 58261 50nM. Scale bar represents 50 µm.
B) Graphical representation of previous conditions. Lines at 100% and near 80% represent
con-trol and glutamate 100 µM. Each value is mean ± SEM of three to five experiments. *** P<0.001 compared to control; ‡ P<0.05 and ‡‡ P<0.01 between the two shown conditions; ## P<0.01 compared to glutamate 100 µM, calculated using a one way ANOVA test followed by a Bon-ferroni post hoc test.
A)
4. Results
Glu 100 µM - + + + + + + +
Urc 10 pM - - + - + + - -
CGS 21680 30 nM - - - + + + + -
SCH 58261 50 nM - - - + + +
Figure 4.9 – Activation of A2AR by CGS 21680 30nM in neuronal viability upon a glutamate insult. The ratio of cell death was achieved by PI and Syto-13 technique. A) On Top, representative images of following conditions: a) CTR; b) Glutamate 100 µM; c) Glutamate 100 µM + urocortin 10 pM; d) Glutamate 100 µM + CGS 21680 30nM; e) Glutamate 100 µM + urocortin 10 pM + CGS 21680 30nM; f) Glutamate 100 µM + urocortin 10 pM + CGS 21680 30nM + SCH 58261 50nM; g) Glutamate 100 µM + CGS 21680 30nM + SCH 58261 50nM; and h) Glutamate 100 µM + SCH 58261 50nM. B) Schematic representation of previously described conditions. Lines at 100% and near 80% represent control and glutamate 100 µM. The results (mean ± SEM) were obtained from three experiments. *** P<0.001 compared to control; ## P<0.01, ### P<0.001 compared to glutamate 100 µM, calculated using a one way ANOVA test followed by a Bon-ferroni post hoc test.
As presented in Figure 4.8, the blockade of A2AR by its selective antagonist, SCH
B) A)
4. Results
maintained with selective blockade of CRF1R (87.6±3.48%, n=4) but not with CRF2R
blockade (74.8±4.91%, P<0.01 compared with SCH 58261 and glutamate 100 µM, n=5). Curiously, the ability of SCH 58261 to increase cell viability relative to glutamate 100 µM was maintained even when both CRFR agonist and antagonists are present (91.0±5.23% compared to 76.4±1.63%, P<0.01, n=3).
On contrast, as shown in Figure 4.9, A2AR activation with CGS 21680 30nM did not
altered cell death in presence of glutamate 100 µM (72.4±6.79%, not reaching statisti-cal significance from glutamate 100 µM, n=4), but seems to avoid urocortin neuropro-tection previously presented (from 90.5±2.23% to 77.8±4.59% with CGS 21680, n=3). However, SCH 58261, an A2AR antagonist had a tendency to revert CGS 21680 effects
in glutamate toxicity, ensuring that the selective A2AR agonist, CGS 21680, was acting
mostly in this subtype of receptors.
4.5. M
ODULATION OFA
2A RECEPTOR LEVELS BYCRF
In order to further understand the neuroprotective effects of CRF and its interaction with A2AR, we evaluated whether the levels of expression of these receptors are affected by
crossactivation. The cortical expression of A2A receptors is very low (Lopes et al., 1999)
and is technically difficult to detect the expression levels of this receptor subtype. So, we used nerve growth factor (NGF)-differentiated PC12 cells that proved to be a valid model to study changes in A2AR since these receptors are highly expressed in these
cells (Arslan et al., 1997) which display a neuronal phenotype in these conditions (Greene and Tischler, 1976). In this task the levels of A2AR will be measure in
homeo-static conditions, i.e. no excitotoxic insult was applied to the cells.
We then intended to observe variations in A2AR in the presence of its ligands as well as
CRFR agonist (urocortin) and antagonist (antalarmin). The results presented in the Fig-ure 4.10 showed that A2AR levels are regulated by their own ligands but are not affected
by CRFR ones. While the A2AR agonist, CGS 21680, downregulated (48.9±5.5%,
P<0.001 compared to control, n=4) the antagonist, SCH 58261, upregulated A2AR
lev-els (144±15.2%, P<0.01 compared to control, n=5). Neither CRF agonist, urocortin (88.3±9.4% of control, n=4), nor antagonist, antalarmin (80.7±14.5% in relation to con-trol, n=3), significantly changed A2AR levels in NGF-differentiated PC12 cells.
4. Results
CGS 21680 30 nM - +
SCH 58261 50 nM - -
Figure 4.10 – A) Modulation of A2AR levels by its SCH 58261 50 nM, in NGF-different
agonist, urocortin 10 pM, or antagonist, ized to the correspondent α-tubulin experiments. ** P<0.01; *** P<0.001 test followed by a Bonferroni post hoc test is presented.
As presented in Figure 4.11, CRFR ligands d regulation of A2AR by CGS 21680
n=5 and 42.5±7.26% when CRF1
opposite direction, CRFR binding m neously with SCH 58261. In Figure
ify the upregulation of A2AR by SCH 58261
A2AR levels, either in presence of urocortin (
58261, n=5) or alone when A2AR
58261 alone or control conditions
A)
- Urc 10 pM - +
+ Ant 10 nM - -
R levels by its agonist, CGS 21680 30 nM, and
differentiated PC12 cells. B) A2AR levels are not changed with CRFR pM, or antagonist, antalarmin 10 nM. A2AR immunoreactivity was norma
tubulin immunoreactivity. Results are mean ± SEM of three to five 001 compared to control, calculated using a one way ANOVA post hoc test. At the top a representative image of the western blot
CRFR ligands did not change the previously described R by CGS 21680 (49.9±9.5% for urocortin in presence of CGS 21680,
1R are blocked in presence of CGS 21680, n=6)
opposite direction, CRFR binding molecules altered A2AR levels when applied simult
Figure 4.12, while urocortin seems to be irrelevant to mo R by SCH 58261 (115±29.9%, n=5), antalarmin
ce of urocortin (84.5±13.9%, P<0.05 compared with SCH R are blocked (39.4±14.4%, P<0.01 compared to SCH or control conditions, n=4).
B)
- +
and antagonist, R levels are not changed with CRFR was normal-. Results are mean ± SEM of three to five
calculated using a one way ANOVA . At the top a representative image of the western blot
t change the previously described resence of CGS 21680, are blocked in presence of CGS 21680, n=6). In an R levels when applied simulta-hile urocortin seems to be irrelevant to mod-antalarmin decreased , P<0.05 compared with SCH , P<0.01 compared to SCH