A Work Project presented as part of the requirements for the Award of a Master Degree in Finance from the
NOVA – School of Business and Economics.
Marks & Spencer
Out of Fashion
The Case of An Outdated Brick and Mortar
Beatriz Teixeira da Silva Leite, 25691
Bernardo Ventura Inácio Ribeiro de Faria, 26090
A Project carried out on the Master in Finance Program, under the supervision of
Filipa Castro
Abstract
The current paper provides a thorough analysis of Marks & Spencer’s stock
performance. The analysis explores the arguments which support a SELL
recommendation. For the purpose, a detailed analysis of the UK Food and
Fashion retail industries is conducted, following an overview of the company’s
historical background and financial performance. The paper places special
emphasis on the company’s future value drivers and potential risks for the
investment decision.
Keywords
Marks & Spencer, Retail, Fashion, Grocery
This work used infrastructure and resources funded by Fundação para a Ciência e a Tecnologia
(UID/ECO/00124/2013, UID/ECO/00124/2019 and Social Sciences DataLab, Project 22209), POR
Lisboa (LISBOA-01-0145-FEDER-007722 and Social Sciences DataLab, Project 22209) and POR Norte
(Social Sciences DataLab, Project 22209).
MASTER IN FINANCE
THIS REPORT WAS PREPARED EXCLUSIVELY FOR ACADEMIC PURPOSES BY BEATRIZ LEITE AND BERNARDO FARIA, MASTER IN FINANCE STUDENTS OF THE NOVA SCHOOL OF BUSINESS AND ECONOMICS. THE REPORT WAS SUPERVISED BY A NOVA SBE FACULTY
MEMBER, ACTING IN A MERE ACADEMIC CAPACITY, WHO REVIEWED THE VALUATION METHODOLOGY AND THE FINANCIAL MODEL.
▪ We initiate coverage of Marks & Spencer (M&S) with a SELL recommendation and a Dec-20 TP of 190p (Bull Scenario), implying a 10% downside vs the current market price (19-Dec-19). ▪ The Food sector in the UK is struggling with severe competition from European discount retailers. In a scenario in which the company is attempting to deviate from a premium image and become a “family based shopper”, M&S is at risk of being “stuck in the middle”. Additionally, the company’s newly formed joint-venture with Ocado presents significant executional risks and puts at jeopardy the firm’s credibility to investors, following the recent dividend cut to finance the transaction.
▪ In Clothing & Home (C&H), stores are oversized and supply chain allows for both stock piling and low availability. Moreover, M&S is struggling to compete with fast-fashion retailers, which have a closer connection with the “consumer of the future”. We believe C&H’s problems are structural, rather than executional. ▪ Valuation: our recommendation departs from a DCF valuation method, with a WACC of 7.6% and a terminal growth rate of 1.5%. Our forecast period extends to 2031.
▪ Key risks to our analysis: (1) Corporate governance shift, (2) Brexit uncertainty, (3) Monetization of properties, (4) Solid progression in the cost cutting plan and (5) Better than expected like-for-likes in C&H.
Company description
Founded in 1884 in Leeds, M&S is the UK’s largest retailer, operating in the Clothing & Home (34% UK FY’19 revenues) and Food markets (57% FY’19 UK revenues). Organized in two segments – UK and International – M&S sees c.10% of its revenues and c.23% of its operating profit generated abroad.
M
ARKS AND SPENCER
C
OMPANY
R
EPORT
F
ASHION
6
J
ANUARY2020
S
TUDENT:
B
EATRIZL
EITE ANDB
ERNARDOF
ARIAOut-of-Fashion
The case of an outdated brick-and-mortar
Recommendation: SELL
Vs Previous Recommendation -
Price Target Dec-20: 190p
Vs Previous Price Target -
Price (as of 19-Dec-19) 219p
Reuters
Next Reporting Date 20-Mar-20, FY’20 52-week range (£) 161.35-292,86
Market Cap (£mM) 4.26
Outstanding Shares (m) 1,949 Source: Reuters
*Rounded for presentation purposes
Source: Reuters
(Values in £ millions) 2018a 2019a 2020e Revenues 10.698 10.377 10.228
EBIT 671 601 541
Net Profit Reported 456 471 421 EPS (in p) 27.8 25.4 21.6 EV/EBIT(x) 16.21 15.62 13.36 Source: Company Filings, ER Analysis
MARKS &SPENCER COMPANY REPORT
Table of Contents
VALUATION SUMMARY ... 3
COMPANY OVERVIEW ... 3
ASHIFTING CORE STRATEGY ... 3
SHAREHOLDER STRUCTURE ... 5
UK FOOD ... 6
SEGMENT DESCRIPTION ... 6
CHALLENGING GROCERIES MARKET IN THE UK ... 8
UK CLOTHING & HOME ...13
SEGMENT OVERVIEW ... 13
FAST-MOVING UKAPPAREL MARKET... 15
INTERNATIONAL ...17
M&S BANK ...18
M&S ENERGY ...18
KEY CATALYSTS ...18
RISKS TO THE UPSIDE ...19
BUSINESS MODEL ...21
FOOD REVENUES ... 21
CLOTHING &HOME REVENUES ... 22
INTERNATIONAL,COSTS AND MARGINS ... 23
VALUATION ...24
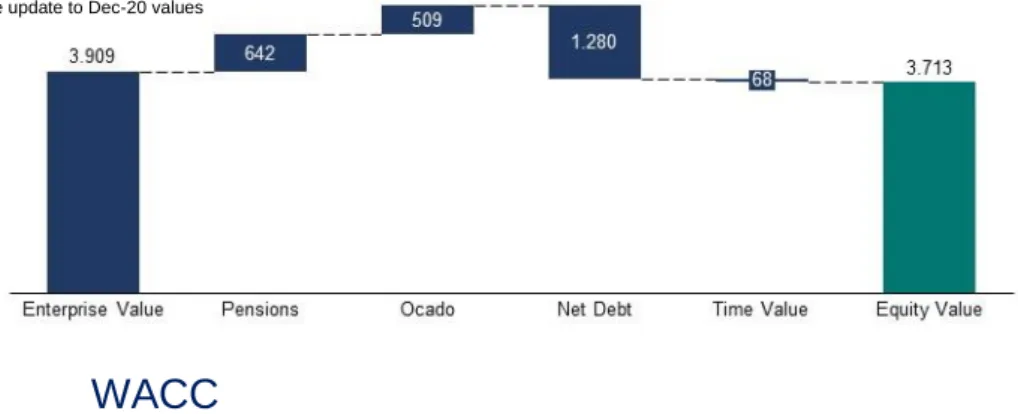
EV/EQUITY BRIDGE ... 24
WACC ... 25
FINE TUNING OUR VALUATION ...26
SCENARIO ANALYSIS ... 26
MULTIPLES VALUATION... 27
FINAL REMARKS ON THE EQUITY STORY ...28
MARKS &SPENCER COMPANY REPORT
Valuation Summary
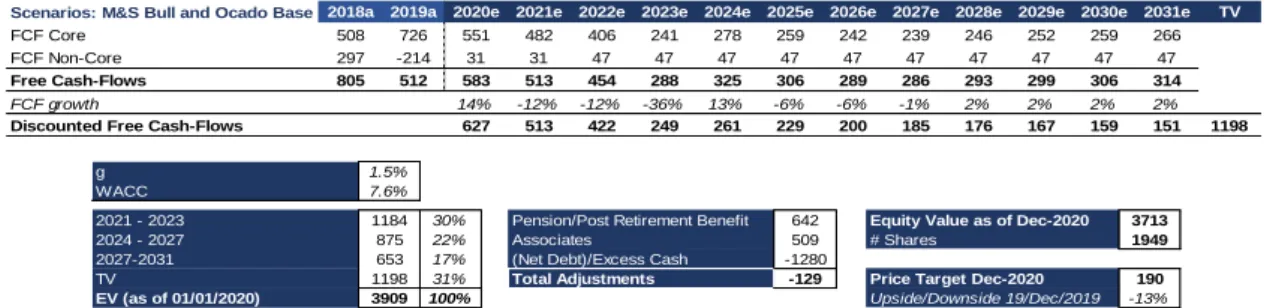
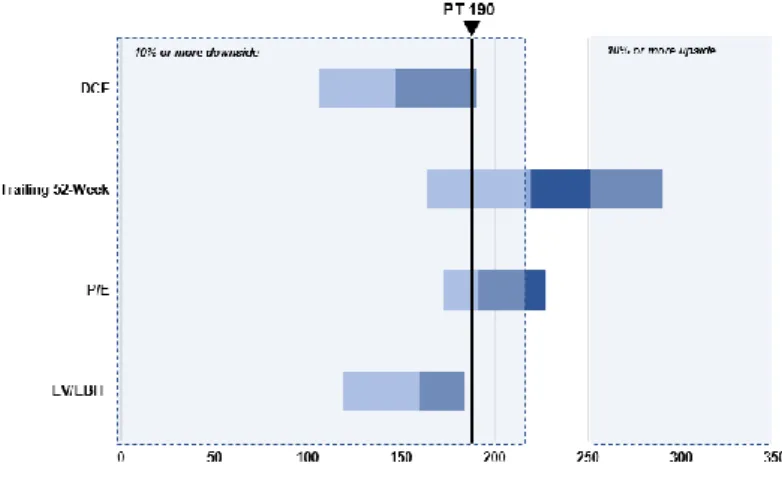
We conducted a DCF analysis to value M&S. Thus, we forecasted both IS and BS items until 2031 (when the company reaches the steady-state). The valuation uses a 7.6% WACC and 1.5% growth rate in the Bull scenario1. We obtained a price
target of 190p, which implies 13% downside vs the price as of 19-Dec-19.
Company overview
Marks and Spencer (M&S) is one of the UK’s largest retailers, with c.7.6% market share in the UK apparel market as of FY’18 (vs 9.6% in FY’08, source: Euromonitor). Its Food segment is responsible for 57% of FY’19 revenues and c.48% of FY’19 UK gross profit (31% gross margin), while its Clothing and Home segment (C&H) represents 33% of total FY’19 revenues at a 57% gross margin. Having an international footprint, the company operates in two key geographic segments: the UK segment (91% of FY’19 rev) and the International segment (9% of FY’19 rev, 14% operating margin), which incorporates the Republic of Ireland, Europe and Asia, together with other international franchise operations.
A Shifting Core Strategy
“Don’t ask the price, it’s a penny” – you could read on a market stall in Leeds, back in 1884. It was then that Michael Marks, a Polish refugee that was later joined by Thomas Spencer, created what is now one of the UK major retailers. Back then, it
1 Since we are recommending a SELL, we present the most optimistic scenario which still supports our investment decision Table 2: Sensitivity Analysis for the Bull Scenario
In green, price higher than current share price
6.6% 7.1% 7.6% 8.1% 8.6% 9.1% 0.5% 208 193 181 171 162 154 1.0% 214 198 185 174 165 156 1.5% 222 204 190 178 168 159 2.0% 232 212 195 182 171 161 2.5% 244 220 202 187 175 164 WACC g
Table 3: Implied Downside Sensitivity for the Bull Scenario
In yellow, upside higher than -10%
6.6% 7.1% 7.6% 8.1% 8.6% 9.1% 0.5% -5% -12% -17% -22% -26% -29% 1.0% -2% -9% -15% -20% -25% -29% 1.5% 1% -7% -13% -19% -24% -28% 2.0% 6% -3% -11% -17% -22% -26% 2.5% 11% 1% -8% -15% -20% -25% WACC g
Table 1: DCF Valuation and Inputs
Scenarios: M&S Bull and Ocado Base 2018a 2019a 2020e 2021e 2022e 2023e 2024e 2025e 2026e 2027e 2028e 2029e 2030e 2031e TV
FCF Core 508 726 551 482 406 241 278 259 242 239 246 252 259 266 FCF Non-Core 297 -214 31 31 47 47 47 47 47 47 47 47 47 47 Free Cash-Flows 805 512 583 513 454 288 325 306 289 286 293 299 306 314
FCF growth 14% -12% -12% -36% 13% -6% -6% -1% 2% 2% 2% 2%
Discounted Free Cash-Flows 627 513 422 249 261 229 200 185 176 167 159 151 1198
g 1.5%
WACC 7.6%
2021 - 2023 1184 30% Pension/Post Retirement Benefit 642 Equity Value as of Dec-2020 3713
2024 - 2027 875 22% Associates 509 # Shares 1949
2027-2031 653 17% (Net Debt)/Excess Cash -1280
TV 1198 31% Total Adjustments -129 Price Target Dec-2020 190
EV (as of 01/01/2020) 3909 100% Upside/Downside 19/Dec/2019 -13%
Graph 1. Revenue Split as of FY’19
In m£
Source: Company Filings
Graph 2. Operating Profit Split
In m£, reported figures Source: Company Filings
MARKS &SPENCER COMPANY REPORT
was unimaginable the ups and downs the once Britain’s favourite would face until today.
In 2001, the company hit record-level profit of one billion pounds; however, just three years later, we saw its profits fall to 145 million pounds. Since 2015, the stock price is declining (Graph 3), and it was observed an increasing number of bears on the sell-side, despite the company’s strong FCF yield (Tables 4 and 5). Although Brexit’s uncertainty can be to blame now (at least partially), it was certainly not the one to blame back in 2015. Operating in two challenging sectors, the company has failed to address the problems it encountered thus far. Margin pressure in Food and an outdated portfolio in Clothing & Home are two of the many factors that can explain M&S’s downfall. But most importantly, underneath them, more structural problems can be identified.
After the appointment of Archie Norman as CEO2, the company entered an
ambitious and much needed turnaround plan. The question is: is it too late?
The Past
Despite its reputation, M&S has a track record filled with struggles. Focusing solely on this century, one can find episodes of dividend cuts, business relocations and profit warnings. In 2000, the company announced a dividend cut of 40% due to increased competition and bad performance in merchandising (current C&H segment). In 2001, M&S initiated another programme of relocation, selling its International business and firing c.4,000 people. In 2005, M&S issued a profit warning following disappointing Christmas sales. In 2008, it announced another profit warning following disappointing Food performance and the departure of the company’s head of Food.
Multiple factors are behind M&S’s peaks and valleys. Overall, M&S has lagged competition in several occasions. In the 90s, the company struggled in the C&H segment as it only sold British manufactured products, while fast-retailers were already benefitting from the significant cost savings from producing abroad. In 2001, the company finally started accepting credit cards; before, it tried to incentivise customers to use its Chargecard3(source: The Guardian), which obviously
was a failure, in a time when the proliferation of bank credit cards was on its peak. In 2010, while competitors were focused on launching initiatives related with the online channel, the CEO Marc Bolland announced a transformation plan to increase sales by redesigning stores and transforming its supply chain, demanding an increase in capital expenditures of £350m – and, even though the
2 5-May-2017, stock +5% on the day 3 M&S’s own credit card
2015 2016 2017 2018 2019
Net Debt/EBITDA 1.7x 1.6x 1.5x 1.5x 1.1x FCF Yield 17% 20% 19% 20% 13%
Table 4. M&S’s cash generation and debt position
Source: Company Filings, ER Analysis
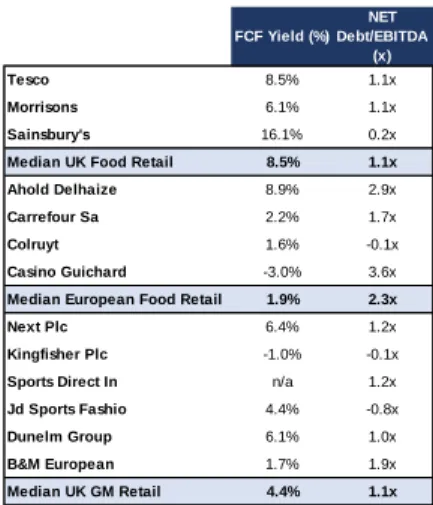
Table 5. Peers’ Cash generation and debt position, 2018
Source: Company Filings, ER Analysis
Graph 3. Stock Performance Jan 2014 -Dec 2019
Source: Company Filings
FCF Yield (%) NET Debt/EBITDA (x) Tesco 8.5% 1.1x Morrisons 6.1% 1.1x Sainsbury's 16.1% 0.2x Median UK Food Retail 8.5% 1.1x Ahold Delhaize 8.9% 2.9x Carrefour Sa 2.2% 1.7x Colruyt 1.6% -0.1x Casino Guichard -3.0% 3.6x Median European Food Retail 1.9% 2.3x Next Plc 6.4% 1.2x Kingfisher Plc -1.0% -0.1x Sports Direct In n/a 1.2x Jd Sports Fashio 4.4% -0.8x Dunelm Group 6.1% 1.0x B&M European 1.7% 1.9x Median UK GM Retail 4.4% 1.1x
MARKS &SPENCER COMPANY REPORT
transformation plan 2010-2014 was accomplished its goals, its stock performance was not stellar.
While these days the symptoms are different, the patient is still the same; and going through the company’s historical performance leads us to question how much of the past struggles (which look like a deja-vu of the current situation) are currently priced in.
Present and Future
“Another five-year plan, still no great leap forward”, announced The Guardian following the company’s track record of turnaround plans with a 5-year duration. With the recent “Transformation Update”4, the market could finally grasp a sense
of the “far reaching change at M&S”. The company is currently in the 2nd of a 5-year turnaround plan, despite the plan for C&H being 18 months behind schedule. Divided in three stages (Figure 1): (1) restoring the basics, (2) shaping the future, and (3) making M&S special, the company expects to be back on track like in the good old days. Cultural transformation is at the epicentre of the change – from the top to the bottom, with new names in a newly structured board committee – but the company is indeed fighting in several fronts.
Overall, cost reduction and increasing supply chain efficiency are two key milestones for M&S. While H1’205 witnessed some performance improvements,
M&S is still fighting significant structural problems as we elaborate further.
Shareholder structure
As of June 2019, there are 1,949 million M&S shares outstanding, with each holding one voting right (Table 5). Additionally, the company’s shares trade as American depository receipts, with each receipt representing two shares. M&S shares trade on the London Stock Exchange and the company has recently left the FTSE100 (c. -10% YTD as of Dec-19), after a 35-year stay – since the index inception.
When compared to its peers, M&S was one of the most rotated stocks in this period (Graph 4), reflecting the company’s instability - M&S’s underlying performance deteriorating vs the industry makes it more volatile in comparison to its peers. In terms of ownserhip, M&S’s top 1 investor holds a stake of 6.4% (Table 5), which means that the company is not too dependent on one single investor. Additionally,
4 Investor Presentation 1 October 2019 5 Stands for first-half year results for 2019/2020 Figure 1. M&S Transformation Plan Stages
Source: Transformation Update, 1-Oct-19
% O/S BlackRock Institutional 6.39 Schroder Investment Management 4.62 Columbia T hreadneedle Investments 4.23 Majedie Asset Management 4.16 RW C Partners Limited 3.96 T he Vanguard Group, Inc. 3.37 Bank of Nova Scotia 2.63 Jupiter Asset Management 2.48 W ellcome T rust 2.47 Norges Bank Investment Management 2.37
Table 5. M&S’s Main Shareholders % of total shares outstanding
Source: Reuters
Graph 4. Rotation vs Peers
MARKS &SPENCER COMPANY REPORT
being mostly owned by institutional investors, we can expect less volatility than if held by private investors.
Overall, despite the high trading volumes, we think that M&S’s shareholder structure is sufficiently stable and diversified and we do not expect it to have significant influence in our valuation.
UK Food
Segment Description
The Food segment is responsible for 57% of FY’19 revenues (c.63% UK revenues) and c.48% of FY’19 UK gross profit, implying a 31% gross margin (Graph 5). Its importance has been increasing throughout time, with the company placing greater focus in this segment vs C&H.
Under the Food segment, M&S sells “sustainably sourced, fresh, convenient products of outstanding quality” and its spectrum can be split in 5 key offers: protein deli and dairy, ambient and in-store bakery, means dessert and frozen, hospitality and “Food on the Move”. Moreover, Marks & Spencer offers food via two store formats: full-line stores, in which the consumer can have access to both clothing, home wear and food; and Simply Food stores, which are smaller and more convenient stores, focused on Food.
For the last 3 years, M&S has been reporting negative LFLs6 in the food segment
(Graphs 6 and 7) and a declining gross margin (Graph 5). Despite the company operating in a challenging Food business, we argue many of the problems derive from the company’s very own business model. Our concerns over M&S’s business model vs peers lie on the fact M&S was the biggest market share loser vs UK retail grocers following its declining performance in terms of LFLs (Graphs 6 and 7). Despite some recovery in H1’20 (+0.9% LFL yoy driven by volume) and a positive outlook for Christmas spending, especially after the some tailwinds from the UK election, we defend the positive yoy performance is mostly driven by soft comps after a weak H1’19, with executional problems persisting.
Stuck in the Middle
M&S is perceived as a premium grocer (Figure 2). Under the current transformation plan, the company is aiming to become a more family-based grocer. To do so, the company is opening new Simply Food Stores, becoming closer to the consumer. With this strategy, M&S expects to place a greater offer in comparison to its peers
6 Non-IFRS metric commonly used in retail. For M&S, like-for-like stands for the period-on-period change in revenue (excluding VAT) from stores which
have been trading and where there has been no significant change (greater than 10%) in footage for at least 52 weeks and online sales
Graph 5. UK Food Revenues and Gross Margin Evolution
In £k
Source: Company Filings, ER Analysis
Graph 6. LFLs YoY M&S vs Big 4
Source: Companies’ Filings, ER Analysis
Graph 7. Revenue Change YoY M&S
Source: Company Filings, ER Analysis
MARKS &SPENCER COMPANY REPORT
as regular Food stores typically display c.2,000 products. Additionally, the company is investing in price and has entered a joint-venture with Ocado, as we explain further. By appealing to a more family shopper, M&S expects to see consumer’s frequency of purchase increasing, thereby becoming weekly rather than a weekend place to shop. While we understand the company’s shift, we are afraid M&S ends up “stuck in the middle”, not being perceived neither as a premium grocer nor as a food chain. Moreover, becoming a family shopper implies intensified competition from the Big 47, moving away from other grocers such as
Co-Op and Waitrose. In a scenario in which the first compete in a significantly lower margin basket, we must raise concerns on M&S’s ability to succeed.
Store Space
As of FY’19, M&S has closed 35 full-line stores; in FY’20, the company intends to close further 85 full-line stores and 25 simply food stores – “some of the low volume, higher cost Simply Food stores, mostly on short leases, will also be progressively relocated or rationalised”. With the company in the 2nd of a 5-year turnaround plan, space contribution is expected to be negative in the upcoming years.
Supply Chain
Despite its food suppliers being mainly located in the UK for the Food segment, on the contrary to what happens in the C&H segment nowadays, Marks & Spencer’s inefficient supply chain has led to high levels of waste and low levels of availability. The inefficiency consists of an overweight structure of intermediaries, which is publicly recognized by the company. The restructure of the supply chain constitutes one of its pillars for future growth – because of this, M&S is currently working with Gist and has developed a pilot in its Vanguard major store (which will be rolled-out to another 85 stores in FY’20). We defend benefits will become tangible in the medium-term following the company’s increasing confidence in its ability to meet guindace (which was updated from an overall reduction from 0-1% to 1-2%) – despite supply chain costs having increased +3% yoy in H1’20 -, reducing pressure in Gross Margins through a reduction in COGS8.
Price/volume relationship
M&S is focusing an important part of its food strategy in adjusting price and volume. There are some items being sold by unadjusted prices, with the company relying heavily in discounting. In 2018, for example, M&S decreased the price of eggs by
7 Big 4: Tesco, Sainsbury’s, Asda and Morrisons. 8 Stands for Cost of Goods Sold
Figure 2. UK Grocery Market Positioning
MARKS &SPENCER COMPANY REPORT
18% and saw sales rise by 43%. As reported by the company in several occasions, the current strategy is to reduce markdown and implement general price reductions, aligning customer perception.
Across Europe in general and the UK in particular, retailers are using demographic information to calculate the maximum price a given costumer is willing to pay for a product, both in online and physical stores. The retailers are using the same methods as Airbnb or Uber to analyse big data and forecast the consumer willingness to pay. Thus, it could be profitable to adjust price in some products. However, these adjustments might take significant time and CAPEX9 investments,
that, if the strategy fails, will result in significant losses for the company.
Challenging Groceries Market in the UK
The UK Groceries market is a highly competitive and consolidated market. With a customer pool of c.67 million people and an overall expected market value of £193.6 billion as of FY’19 (2.4% CAGR 2019-2024, according to IGD), its structure is characterized by the dominance of the Big 4 supermarket chains – Tesco, Sainsbury’s, Asda and Morrisons -, holding c.67% of the market share (Graph 8) and the presence of discounters, such as Aldi and Lidl. In this environment, M&S displays greater margins than its peers due to its premium offer and Clothing & Home section but lags behind in terms of revenues also because of such perception (Table 6). The current outlook for the UK groceries market poses key challenges to the industry with (1) the rise of discounters, with the increasingly reliance on other European retailers such as Lidl or Aldi, (2) the increase of M&A activity, and (3) consumers shifting towards the online channel.
The Rise of Discounters
As of 2015, Aldi and Lidl held, respectively, 4.9% and 3.5% market share (source: Kantar); as of Sep-19, Aldi has already surpassed Co-operative, being the 5th largest player in the UK groceries market with an 8.1% market share while Lidl has reached a 6% market share (Graph 9). Such trend is not expected to change in the foreseeable future, with IGD estimating discounters alone will contribute to roughly £4 of each £10 increase in market value (source: IGD).
In an industry in which grocery players are particularly hit by higher than expected inflation as families rapidly adapt their consumption patterns during macroeconomic crisis, higher than expected inflation tends to benefit grocery discounters over premium players – placing Aldi and Lidl in a great position over Brexit uncertainty and M&S at the end of the line following its premium
9 Stands for Capital Expenditures Graph 8. UK Food Groceries Market Share Evolution
Source: Euromonitor
Graph 9. Market Share Evolution Discounters in the UK
Source: Euromonitor
Table 6. M&S EBIT Margins vs Peers
Source: ER Analysis 2016 2017 2018 2019 Tesco 2.2% 1.7% 2.3% 2.9% Morrisons 2.6% 1.9% 2.6% 2.6% Sainsbury's 3.3% 3.0% 2.6% 2.4% Median UK Food Retail 2.6% 1.9% 2.6% 2.6% Ahold Delhaize 3.9% 3.4% 2.5% 3.9% Carrefour Sa 3.2% 3.2% 3.1% 2.5% Colruyt 5.6% 5.5% 5.2% 5.4% Casino Guichard 4.6% 3.1% 2.9% 3.3% Median European Food Retail 4.2% 3.3% 3.0% 3.6% M&S 7.4% 7.4% 6.5% 6.3%
MARKS &SPENCER COMPANY REPORT
perception10. Moreover, M&S’s high correlation11 with the UK Consumer
Confidence Index (Graph 10) confirms our concerns on the potential impact from Brexit and the consequences on the overall performance of the stock. On top of this, following McKinsey research which concludes that, in the UK, 2,000 items generate 40% of total sales, we are forced to conclude retailers have little operating
manouvre to undercut competition. For M&S, this results in increasing price
pressure and challenges concerning an already declining gross margin.
M&A Activity
Such pressure is further intensified with current M&A trends. For example, Tesco acquired Booker, one of UK’s major wholesalers, allowing the company to strengthen their logistics and control costs more efficiently (having more flexibility to reduce prices vs M&S); and Co-Op acquired the wholesaler Nisa, expanding its offer and increasing overall buying power.
Moreover, with large chains increasing their number of premium lines, M&S may put a trait for which it is highly rewarded – its premium offer – in jeopardy, especially taking into consideration the easier accessibility of the Big 4 vs M&S, which on average have more stores than M&S (Table 7).
Online and an Ambitious Partnership
We share KPMG’s idea that the importance of the online channel will never reach the same relevance for the food segment as it will for non-food products (source: KPMG’s Think Tank); however, we are forced to recognise the importance of the online channel for the British consumer, with our hypothesis being confirmed with IGD estimates of a 7.5% CAGR 2019-2024 for the online segment vs 7% for discounters vs 0.6% supermarkets (Table 8). Indeed, the online channel for food has become increasingly relevant for consumers with 29% of the British consumers purchasing food or groceries online in 2019 (vs 19% in 2011). Sainsbury’s, Tesco, Asda, Morissons, Co-Op and Waitrose already have an online presence. Players such as Amazon and Ocado play preponderant roles in this channel, as we highlight further.
Following shifting consumer patterns and its ambition to become a digital first retailer, M&S has partnered with Ocado, a British online supermarket founded in 2000. With a client pool of 580,000 active customers, Ocado operates under a business model in which the company holds no stores and provides all the
10 We are aware Aldi, Lidl and M&S share relatively similar operational risks in the sense both depend on external suppliers and operate in several geographies
other than the UK. The key idea is that in a climate of increasing inflation as would be the one expected in the case of a no-deal Brexit, families’ stagnating wages and higher willingness to save would benefit chains which provide to consumers lower prices – as it is the case for Aldi and Lidl. Even in the case of M&S lowering prices, customers’ perception would take time to adapt to the new conditions.
11 62% R-Squared
Graph 10. Correlation Revenues and CCI
Source: ER Analysis
Table 7. Number of Stores per Brand
Source: Companies’ Websites, ER Analysis
2017 2018 2019 M&S 979 1,035 1,043 Tesco 3,739 3,952 3,961 Sainsbury's 1,411 1,423 1,428 Morrisons 494 491 494 Channel 2019-2024 CAGR Hypermarkets -0.20% Supermarkets 0.60% Convenience 3.10% Discount 7.00% Online 7.50% Other Retailers -0.80%
Table 8. UK Groceries Market CAGR 2019-24 per Channel
MARKS &SPENCER COMPANY REPORT
deliveries directly from its warehouses. The deal allows M&S to leverage on Ocado’s expertise in retail logistics and distribution, with M&S selling its products via Ocado’s website, thus reducing the execution risk of entering the online channel. We believe the expansion to the online channel is a natural strategic objective for M&S. We understand the reasons behind this partnership, since Ocado already has a functional business in the online business. However, with M&S trading down c.12% on the day of the announcement (vs Ocado +3%)12
following concerns M&S was overpaying for the JV13, we are forced to pose our
questions regarding the execution risks of the transaction.
Terms of the transaction
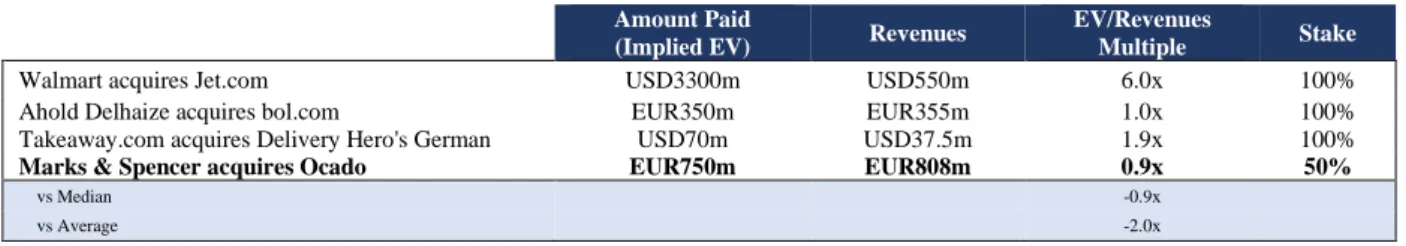
Under the JV agreement, M&S is acquiring a 50% stake of Ocado’s UK Retail business, entering an agreement with the Solutions business via the Ocado Smart Platform. The agreement consists in the payment of a £750m consideration, which includes a deferred consideration of up to £187.5m plus interest, upon the meeting of targets not disclosed. The transaction will become effective in September 2020. To finance the acquisition, M&S proceeded to a 1-to-5 rights issue of £600 million, which was 85.14% subscribed.
Problem #1: Dependency on Waitrose
Ocado partners with Waitrose since 2002; under the agreement, Ocado supplies Waitrose’s products as well as Ocado’s own brand. The partnership is ending in September 2020, and, under the conditions of the agreement, the partnership will not be renovated, with M&S replacing Waitrose. The partnership with Waitrose implies exclusivity, with Ocado being tied to a single food retailer. Cutting the tie with Waitrose poses significant risks both on the supply and on the demand sides. On the supply side, 90% of the products sold via Ocado are Waitrose’s or sourced via Waitrose (Graph 11). M&S’s line does not have the same range as Waitrose’s – M&S totals c.7,000 lines, whereas a typical supermarket would have c.25,000 lines (Tesco has c.30,000 lines and is the #1 in online grocery), so guaranteeing a smooth transition can prove difficult if M&S does not manage to develop its product lines. Moreover, given M&S is seen as a more premium grocer than Waitrose (Graph 11), this could impact significantly the value per basket of the delivered products - especially if the increase in prices is passed to the consumer. If the company is not able to offer discounts or reduce prices, Ocado can suffer a significant increase in logistics costs, despite its lean logistics model.
12 27-Feb-2019
13 For further evidence on Ocado’s valuation, please read Beatriz Leite’s individual report: How to Price-In Ocado? Graph 11. Ocado’s Portfolio
MARKS &SPENCER COMPANY REPORT
In its turn, the supply problem leads to a demand problem. There is no evidence of a correlation between Waitrose’s products and Ocado’s sales. However, if the consumer proves to be loyal to Waitrose brand, switching costs in the industry are low enough for the consumer to start buying via waitrose.com, leaving Ocado.
Problem #2: Dividend Cut
Following the announcement of the JV with Ocado and the rights issue, M&S announced a dividend reset of 40% from 18.7p to 13.p (Graph 12) to what the company considers a “sustainable level”, following its “upcoming debt repayments and pension obligations”. We are forced to express concerns over the signals cutting DPS sends to the market as (1) a stable pay-out ratio in a mature company such as M&S exhibits how financially healthy the company is and (2) given the amount of years still ahead for the current turnaround plan, investors are now less compensated to wait for the upturn of the company. With the company not cutting dividends since 2010, the stock performance on the day of the announcemnt can be considered reasonable.
Problem #3: M&A risks and increasing competitiveness
In 2018, there were rumours Amazon approached John Lewis Partnership regarding a possible acquisition of Waitrose, its grocery chain, but no confirmation was provided by the companies. With the ending of the partnership between Ocado and Waitrose, we see potential for Amazon and Waitrose reinitiating talks. Key catalysts for closing a deal are (1) Waitrose’s physical stores and (2) similarities of the customer base - consumers that are willing to pay more to receive quality groceries at a convenient timing.
In 2015, Amazon launched the Amazon pantry service, which allows Prime members to receive goods within 24 hours not paying a delivery fee, and to have special discounts; later in 2016, the company launched Amazon Fresh in London, which allows members to pay no delivery fees in groceries orders. However, its performance in the UK groceries market is still very modest: Amazon has entered the brick-and-mortar business via the acquisition of Whole Foods. However, due to the existence of only 7 Whole Food’s physical stores in the UK, Amazon’s success is still very limited, as it is mostly restricted to the London area and surroundings. Waitrose’s c.350 stores make it an attractive target for Amazon further develop its presence in the UK grocery market. Additionally, as recognized by David Jinks, head of consumer research at ParcelHero (source: Packaging News), “Waitrose’s generally well-heeled customer base would be a great fit for Amazon”, with Waitrose typical consumer willing to spend extra to receive quality groceries.
Graph 12. Dividend per Share
In pences
MARKS &SPENCER COMPANY REPORT
Given Amazon’s brand name, operational leverage and expertise, such partnership could reveal to be a game changer for M&S, increasing competition in the online channel as well as reducing the return of what we estimate it was an already expensive investment in Ocado14.
Problem #3: Small basket size
Marks & Spencer’s basket size15 is c.£20 which contrasts with Tesco’s c.£100
basket size and Ocado’s at c.£100. With Ocado replacing its products to Waitrose, Ocado’s basket size is likely to decrease; as such, we must raise questions on the economics of the deal, especially given the significant costs associated with home delivery (such as fuel consumption, investments in motorbikes, among others).
Problem #4: Own store cannibalization and gross (not net) synergies
We also pose questions regarding store cannibalization and the synergies as guided by M&S, but recognize the lack of data at this point that could support our arguments. By incorporating its offer in Ocado’s website, we can observe potential cannibalization of M&S’s current offer. Additionally, the £70m gross synergies16
(not net) resulting from the JV (1% of M&S’s FY’19 revenues) as guided by M&S might imply further investments, hence having little impact on the company’s P&L.
Problem #5: Online groceries sales growth stabilization
Between 2010 and 2016, the percentage of British who purchase groceries online increased (Graph 13). We defend the percentage of online sales for food will never reach apparel’s, and this can lead us to to the conclusion the steady state for online food sales can be relatively close, limiting the upside for M&S - another late-entry for M&S. In a sector where consumer loyalty is important, the consumers might already be tied to other brands, resulting in more obstacles to the company.
Competition from Food Delivery Apps
By partnering with Ocado, M&S will have access to Zoom17, a one-hour London,
low delivery fees, service. Under this new partnership, “food of M&S (ready meals, quality food) is perfectly suited for this more upmarket convenience shopping”. While we understanding the opening to a new market could imply potential upside, our argument is that such potential is limited given the overall consolidation of the market.
14 For further evidence on Ocado’s valuation, please read Beatriz Leite’s individual report: How to Price-In Ocado? 15 Retail metric used to refer to the number of items getting sold in a single purchase
16 Guidance provided in the Press Release: Bringing the Best Together: Transforming UK online grocery shopping M&S and Ocado announce new Joint
Venture, 27-Feb-19
17 For more information on Zoom, please visit: https://zoom.ocado.com/ Graph 13. Share Individuals Buy
Food Online in the UK
Source: Statista
Supermarket Min.
Order Delivery Price Delivery Slot
Ocado £40 £2.99 - £6.99 or free on Wednesdays 1h Iceland £25 £2 - £4 or free over £35 2h Waitrose £60 Free 1h Tesco £25 £1 - £7 + £4 if spend <£40 1h but
4-hour window Morrisons £40 £1.5 - £5 1h Sainsbury's £25 £1 - £7 or free delivery with spend
over £100 on Mon-Thu after 2pm 1h Asda £40 £1 - £6.50 2h Amazon Pantry £15 £3.99 1day
Aldi Alcohol £0 Free over £20 or £2.95 if below 1h
Table 9. UK Delivery Offer
MARKS &SPENCER COMPANY REPORT
A combination of factors leads us to conclude M&S will be facing competition from other players besides the traditional food grocers. Being highly rewarded for its premium meal options, its integration in Ocado in general and Zoom in particular will bring new competitors, from different fronts: (1) on one side, online grocers such as Waitrose and Amazon Fresh (Table 9 exhibits other players and its offer); (2) on the other side, food delivery apps (with the industry experiencing double-digital growth (source: Deloitte)) such as Just Eat, Deliveroo and Uber Eats. Following this, despite having access to a larger market, M&S is also exposed to fiercer competition for what could be a relatively small reward.
UK Clothing & Home
Segment Overview
Clothing & Home incorporates Womenswear, Menswear, Lingerie, Kidswear and Home, sold via M&S stores and its online website M&S.com; in total, clothing corresponds to 90% of the segment and generates 37% of UK revenues at c.57% gross margin (Graph 14). The company is widely known for its position in the UK’s underwear market and as a jean retailer18. Moreover, M&S holds 20% in women knitwear and 25% of kids have acquired a uniform from M&S.
While we recognize the problems in the Food segment are more company-specific than industry-wide, we defend these are executional, rather than structural. Our investment case for the C&H segment does not share the same idea. M&S’s offer is outdated and no longer represents a competitive offer in the minds of the millenials; this, combined with an inefficient supply chain, that fails to address those who decide to buy, is the perfect recipe for a declining performance.
Not that Fast Fashion
In 2016, the company’s target consumer were women with ages between 40 and 55. Recognizing it failed to target the “customer of the future”, jeopardizing its long-term sustainability, M&S is now targeting a “younger family age customer”. Under its turnaround plan, the brand has proposed itself to (1) improve fit and size ratios, (2) remove outdated styles and (3) reduce options in 10%, placing greater focus in their top-sellers. Indeed, M&S has finally recognized the need to adjust its collections and increase its popularity (after seeing its Buzz score19 falling from
10.2 to 4.8 form FY’17 to FY’18 (Graph 15) vs Aldi at 18.7%, Lidl at 13.8% and Morrisons at 8.1%). However, with the current turnaround plan lagging 18 months
18 Steve Rowe on H1’20 Earnings Call: “I think what we've shown is where we focused probably on our number one categories, we can see growth and
we've got record market share in bras at 37.2%, we're number one in jeans at 12% and grew by just over 30% this autumn”
19 Buzz or Net Sentiment generated across all media (advertising, news, word of mouth), computed by YouGov via a survey Graph 14. UK C&H Revenues and Gross
Margin Evolution
In m£
Source: Company Filings, ER Analysis
Graph 15. Buzz Score Evolution for M&S
MARKS &SPENCER COMPANY REPORT
behind as reported in the H1’20 earnings call, the success of such strategy is yet to be proven, especially after reporting -5.5% yoy LFL for C&H in H1’20. Additionally and given consumers preferences towards “faster” fashion retailers, such as Primark and Zara, M&S might be too late to recover in this segment. Indeed, Associated British Food’s Primark has been among the top retail winners in terms of market share as millenials no longer wish to buy clothes where their parents and grandparents did – this is, in places such as M&S.
First Price, Right Price
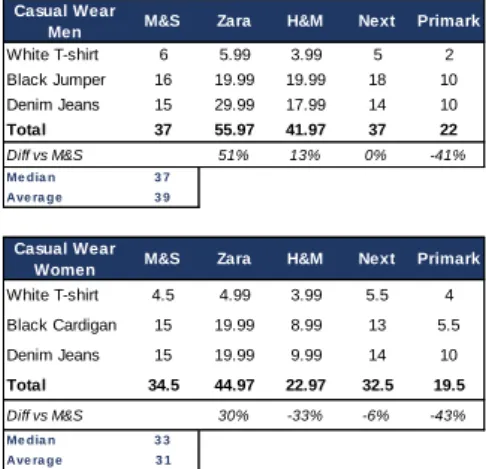
Price is considered more important than quality for the UK consumer (source: Kantar, Graph 16) when buying clothes. According to our analysis, M&S is the 2nd cheapest brand in casual menwear and places in line with the median in womenwear (Table 10). Although prices are not the lowest of the analysed peer set, they are relatively aligned with peers – hence, we find it difficult to blame price for its declining performance. Thus, the strategy of adjusting fit and improve look analysed before might make sense to align customer’s perception; however, we believe potential upside is limited due to overall industry’s trends (as we emphasize next).
Store and Space
Marks & Spencer holds a large and outdated store estate. A store closure programme (implying the closure of 85 stores) is already underway as about ¾ of the C&H stores were opened 25 years ago, with c.75% of those existing before WWII. Under this programme, M&S can finally consider to renegotiate leases and rethink potential current cannibalization between stores. With the company’s problems with inventory management (Table 11), a large store space means accumulating inventory that is not consumer’s best picks; which results in the company’s reporting problems with stock piling and further inefficiencies. In specific, M&S’s average store size is c.37,000 vs Next’s 16,000 sq ft, evidencing the brand’s large store size.
As such, one would expect the closure/reduction of store space could lead to an overall cost reduction per store. Following this, we can expect some losses in revenues deriving underperforming stores being shut-down, despite some transfer of sales to current “regular” stores – implying that space contribution is likely to be negative in the upcoming years (as guided by the company).
While M&S has defined an overall store closure/space reduction strategy, we question its contradictions, with M&S opening a 60,000 sq ft store (as a comparison metric, a typical H&M store has c.20,000 sq ft (source: MarketWatch)) in Nottingham Giltbrook Retail Park and its new store in Corwall – for these stores to prove
Graph 16. Most important factors when buying fashion items in the UK 2015
Source: Kantar, via Statista
Table 10. Price Comparison vs Selected Peer Group
Source: Companies’ Websites, ER Analysis Casual Wear
Men M&S Zara H&M Next Primark
White T-shirt 6 5.99 3.99 5 2 Black Jumper 16 19.99 19.99 18 10 Denim Jeans 15 29.99 17.99 14 10 Total 37 55.97 41.97 37 22 Diff vs M&S 51% 13% 0% -41% Me dia n 3 7 Ave ra ge 3 9 Casual Wear
Women M&S Zara H&M Next Primark
White T-shirt 4.5 4.99 3.99 5.5 4 Black Cardigan 15 19.99 8.99 13 5.5 Denim Jeans 15 19.99 9.99 14 10 Total 34.5 44.97 22.97 32.5 19.5 Diff vs M&S 30% -33% -6% -43% Me dia n 3 3 Ave ra ge 3 1 2017 2018 2019 M&S 171 178 178 Debenhams 59 62 62 Next 63 62 64 Asos 110 113 123
Table 11. Days Sales Inventories: M&S vs Selected Peer Group
MARKS &SPENCER COMPANY REPORT
successful, a more efficient inventory management and increased availability are vital for these mega stores to bear fruit. Otherwise, building these will be just about bringing more outdated clothing, in a store that provides little valuable consumer experience20.
Inefficient Supply Chain
On one side, M&S uses processes in which products with the same origin and destination are transported via 2 separate shipments. On the other side, the stock is often not adjusted for the store size and customer demand, increasing inventory levels, leading to high days’ sales inventory in comparison to its peers, demonstrating the firm’s inefficiency (Table 11) - a problem for a seasonal industry such as apparel. As such, M&S simultaneously displays problems concerning stock piling and low availability21. Under the current turnaround plan, M&S expects
to reduce UK operating costs by 1-2% (Table 12) with the reduction of complexity and working capital; and to expand the Bradford distribution centre and improve capabilities of its Castle Donnington centre. Overall, M&S is trying to centralize its operations, closing warehouses and distribution centres spread around the UK, expanding the most important ones, thus reducing supply chain complexity and increasing efficiency. While we recognize the importance of such programme, our belief is that reshaping its supply chain is necessary not to thrive, but rather to survive, in an industry in which fast-retailers are constantly undercutting the time it takes to bring products from the warehouse to the store.
Fast-Moving UK Apparel Market
M&S holds c.7.6% of market share in the UK Apparel and Footwear Market, being the largest retailer by sales. The company is followed by ABF’s Primark (7.0%), Next (6.6%), Arcadia Group (3.8%) and Asda (3.5%). Even though placing first in the non-food retail market sounds encouraging, M&S has been losing market share in the last years (Graph 17). Furthermore, Kantar data also revealed that, on average, M&S sales have decreased -5.7% in the last 12 months ending October vs the average of the sector at -1.8%, emphasizing our argument that M&S is underperforming peers. Regardless, UK fashion retailers have been struggling with (1) shifting consumer preferences, (2) declining performance of High Street22
stores and (3) increasing importance of kidswear and menswear, with M&S lagging behind its peers.
20 According to 2018/2019’s Annual Report, up to 50% of our store estate has not had major cosmetic refurbishment in the last 10 years – with M&S placing
little focus on in-store customer experience
21 The company has reported the failure to provide clients’ favourites in store while simultaneously filling the store with outdated models, only due to its large
size
22 Designation for the concept of the primary business street of towns or cities UK Food
Space Contribution Level Gross Margin Change -25bps to +25bps
UK Clothing & Home
Space Contribution c.-2 Gross Margin Change -75bps to -25 bps
Others
UK Operating Costs (%) c.-1 to -2 Tax rate (%) c.23 Capital Expenditure (£m) 300 to 350
Table 12. Company Guidance FY’20
Source: Company Filings
Graph 17. UK Apparel Market
MARKS &SPENCER COMPANY REPORT
The Online Channel (Again)
The online channel represented 25% of total apparel and footwear sales as of Dec’18 vs 16% Dec’13, respectively (Graph 18). While these trends favour UK pure-online based retailers such as Boohoo and Asos, or Next (which now has 50% of sales sourced via its online channel), traditional retailers that have a relative smaller online presence end up getting lost in the crowd. For M&S, the online market was flat yoy in H1’2023, with +8% traffic volume being offset by the costs of
paid search; hence, despite its increasing focus on the online channel, the company still fails to materialize this channel in a cost-efficient manner, a common challenge for traditional brick-and-mortars. Additionally, according to a survey from BDO, UK consumers report they are spending more on experiences rather than ‘things’, which in an industry in which switching costs are close to zero, is reflected in a more elastic demand (and decreased consumer loyalty).
Modest Presence on Social Media
Another aspect that signals the overall hypothesis M&S is outdated in comparison with its peers and the mistakes M&S made in defining its target consumer, lies on the Group’s disappointing presence on social media. With the online bringing c. playing an important role for decision making in the fasion industry, M&S’s reach is limited (Table 13). The relatively small online presence could signal the limited upside potential from its focus in the online channel.
Declining performance of High Street Stores
High Street stores are facing difficult times. The previously mentioned shift in consumer preferences has led to c.10% decline in footfall24 in the last 7 years (source: Springboard). Additionally, brick-and-mortars are struggling with increasing business rates and other operating costs. In comparison, traditional brick-and-mortars pay 2.3% of revenues in business rates vs the 0.6% online retailers (source: Retail Research), impacting negatively its cost base. According to PwC, M&S is the 4th highest payer (among 100 surveyed) of business rates in the UK, which again places the company in a challenging position. A further increase in operating costs for players is expected following Brexit new tariffs and visas and is likely to contribute to (i) rising labour costs and (ii) rising sourcing costs. As such, while we expect the current turnaround plan is significantly reshaping M&S’s cost structure25, a further deterioration of the High Street can bring more pressure to it.
23 As of FY’19, Online represented c.18% of total UK C&H revenues 24 Retail metric used to refer to the number of people entering the store
25 As evidenced in the H1’20 earnings release with management improving costs guidance from 0-1% decline to 1-2% decline for FY’20 and overall
improvement in UK operating costs vs H1’19 at -3.3% yoy
Table 13. Social Media Presence: M&S vs Selected Peer Group
‘000 followers Source: ER Analysis Instagram Followers Facebook Likes M&S 1,300 5,400 Next 1,400 2,600 Primark 8,000 6,100 Zara 37,200 27,000
Graph 18. Clothing, footwear & accessories: share of offline & online sales UK 2010-2020
MARKS &SPENCER COMPANY REPORT
Menswear and sportswear – the new stars
While Euromonitor states menswear and sportswear have been the top performers as of FY’18, BDO forecasts volume growth will remain low, especially due to womenswear. M&S currently holds c.14% market share of the suits category while it only holds 2% of the activewear industry, which is growing at +6% yoy (Table 14). This focus on outdated categories is another evidence M&S has again lagged competition, failling to address customer needs.
International
Operating via owned and franchised stores, the International segment allows M&S to have access to the European, Middle East and Asian markets (and through the online channel, to the US and Australia), holding a total of 444 stores and generating c.10% of the Group’s total revenues as of FY’19 (Graph 19) – with owned stores representing c.44% of total International revenues in FY’19 vs c.74% in FY’17.
The company’s current international strategy focuses on shifting to a franchise-dependent model, backing strong partnerships with franchisees, closing underperforming, owned, stores and reducing its selling space (FY’19: 4.9m sq ft vs FY’15: 6.0m sq ft). Simultaneously, the company has been adopting a market pricing strategy, which consists in an overall reduction of prices of c.10% that has yielded positive results as sales were up c.8% in FY’19, following a c.+20% increasing in volumes (Graph 20).
Under the new transformation plan, the company is focused on increasing efficiency in logistics in the International segment. As such, M&S is increasing food stock in EU markets and building a warehouse outside Paris; additionally, amid fears over Brexit, the Group has been preparing itself to flow products from Ireland - this is being done with the objective of increasing fulfilment rates and consequently create more buzz over seasonal launches.
In the International segment, the top performing market is India, where M&S operates since 2001 and partners with Reliance Retail via a JV partnership, and where it plans to expand in the upcoming years. India is becoming increasingly important. Supported on the country’s positive macroeconomic outlook – with a middle class expected to expand by c.14% yoy between 2018 and 2022 (source: McKinsey), the country is an interesting opportunity for retailers. The fashion retail market’s CAGR 2018-2023 is estimated to be 14.4% and the market is expected to reach $59.3 billion in 2022 vs the UK market at $65 billion of 2022 (source: Statista). Greece has also been a key driver of the International segment; however, with a
Table 14. M&S’s Market Growth vs Market Share In Top Fashion Sections
Source: Investor Presentation, 19-Oct-19
Market Growth Market Share Suits -7% 14% Knitwear 1% 12% Casual Tops 6% 5% Activewear 6% 2%
Graph 20. Market Right Pricing Impact FY’19
Source: Company Filings
Graph 19. International Revenues and Operating Margin
MARKS &SPENCER COMPANY REPORT
fashion retail industry CAGR 2020-2023 at 0.4%, we do not expect major upside for M&S, especially as the company has already a relatively established position in the country, operating since 1990.
While we recognize the good performance in FY’19, the strategy for the International segment is still “all-over-the-place”, with revenues fluctuating significantly across the period of analysis (Graph 19). With the company providing little guidance for FY’20 and following the disappointing performance in H1’20 (with revenues down 1.7% yoy), it is still unclear what to expect from the segment.
M&S Bank
The group has an economic interest in M&S Bank which entitles it to a 50% share of profits of M&S Bank, allocated to the UK’s operating profit (4.6% of M&S operating profit FY’19). Under this name, Marks & Spencer provides banking services, via a partnership managed by HSBC. Such financial services include credit cards, savings accounts, mortgages and personal loans, with customers accessing these services online or via in-store branches and bureaux.
The Bank is clearly not part of the core business of M&S, and it has been losing share in the Group operating profit since FY’17 (Graph 21). This partnership was created to improve customer experience, allowing clients to use special credit cards on their purchases, and has not proved to be vital for the business success. Following the lack of guidance, the segment is likely to suffer little transformation in the upcoming years.
M&S Energy
Since September 2018, M&S has been partnering with Octopus, after ending the relationship with SSE in the Energy segment; under this agreement, M&S operates a fully renewable energy source provider. We fail to understand the strategic rationale of the partnership; however, given the imaterial impact for current performance (as of FY’19, the unit represented 0.1% of the Group’s total operating profit) and the little colour provided by the company regarding its future (especially under its current turnaround plan), we do not expect major turnarounds deriving from this segment.
Key Catalysts
Many recognize M&S is in an endless turnaround; nonetheless, the existence of catalysts for further share price decreases may seem less evident. We highlight
Graph 21. Share of M&S Bank Op. Profit in Group Op. Profit
MARKS &SPENCER COMPANY REPORT
three possible catalysts: (1) further deterioration in Clothing & Home, (2) Brexit events and (3) developments following Ocado’s integration.
We expect further deterioration in the C&H division and our valuation recognizes the stock is yet to incorporate its deteriorating outlook and market share losses. While it is still unkown what events could drive any further deterioration, stronger than expected performance from competitors can bring more downside to the stock. As such, we encourage investors to monitor closely peers’ upcoming earnings releases. Additionally, we recognize the current turnaround plan is not comparable to any other in the past. However, with the objectives for C&H being 18 months behind schedule, and following the disappointing performance of the division in H1’20, we expect the stock to be down post the next earnings release. On its behalf, Brexit will bring pressure to M&S’s topline and bottomline. Regarding topline, and in line with what was previously mentioned, Brexit is likely to bring inflationary pressure (source: PwC), something that would be reflected in deferred consumption. As for bottomline, one would expect that, with constrained borders, less migrants would flow to the UK (migrants represent 18% of the workforce in the UK (source: Migrant Observatory)); on top of this, customs duties over products are expected to increase, pressuring M&S’s supply chain. Additionally, such supply chain can see the time associated with the process of bringing products to shelves becoming more long-lasting, following all trade constraints. Unexpected events surrounding Brexit can bring the stock down. While we recognize the overall UK market is likely to underperform following these announcements, the deteriorating performance of the business can lead M&S to show little resilience vs its peers, as it combines structural problems with an unfavourable macroeconomic context. Upcoming Ocado’s earnings releases and developments following the partnership can also be catalysts for the stock. With the integration starting in September 2020, after the ending with Waitrose partnership, we should expect updates soon on the success of the integration of the two services. Even in a situation in which Ocado represents little of M&S’s revenues, we expect the market to react significantly to upcoming announcements (on the day the partnership was confirmed M&S’s stock was down c.12%).
Overall, we believe risks are set to the downside rather than to the upside in the upcoming 12 months.
Risks to the Upside
MARKS &SPENCER COMPANY REPORT
Mr. Rowe has admitted in the past M&S’s culture is “siloed, slow and hierarchical” with bureaucry leading to inefficiencies and dragging the company down. However, we are aware M&S is undergoing a serious cultural transformation with Mr. Rowe building an elite team (Table 15).
Despite the absence of a new appointed CFO after the resignation of Mr. Humphrey Singer 3-days after M&S dropping the FTSE 100 (M&S was one of the founding members of the index), the new Heads of C&H and Food have a strong reputation in the industry. After the resignation of Jill McDonald, C&H managing director, M&S announced he would be succeeded by Richard Price former Tesco F&F director; and Stuart Machin, ex-Sainsbury’s, is leading the Food division. With all the fresh blood, we believe this transformation plan might not look like any other in the past, yielding positive results for the company.
Brexit Uncertainty
As reported by the company, we understand M&S is preparing for a no-deal scenario. Regardless, following the stock’s correlation with the UK Consumer Confidence, we expect it to reflect the outcomes of the Leave decision. Specifically, on 18-Oct-19, after a week of positive newsflow when it concerns to Brexit, a deal between the UK and EU was announced and the stock was up +5% from the 9th to the 18th. As such, we are aware the stock has performed positively greatly due to the more favourable macroeconomic context. Such fact is not odd; what is questionable is the stock’s performance after the announcement of a new law to ensure the Brexit transition phase is not extended on 20-Dec-2019 – with the stock down c.-1.2%. Our concerns lie on the fact the market might be overestimating announcements that are positive for the economy, and underestimating the ones that are not, distorting the stock’s price in the sense it does not represent the fundamental value of the company. While we understand the limitations of the argument, as we are ignoring many other variables, we do not think this factor can be be left out when analysing potential risks.
Monetization of Properties
The closure of stores can bring opportunities to M&S. While it is not certain the outcome for the closed stores, there is potential for the company to monetize such properties, by selling or renting them, especially after the appointment of a new Property Development Director in FY’19 with the objective to “unlock value” from the portfolio.
Solid Progression in the Cost-Cutting Programme
Chairman Archie Norman
CEO Steve Rowe
CFO Humphrey Singer
Head of Food Richard Price
Head of C&H Stuart Machin Table 15. Board Composition
MARKS &SPENCER COMPANY REPORT
Management has reported £75m cost savings in H1’20 and raised cost savings target in FY’20 from 0-1% of operating costs to 1-2% (Table 12), expressing obvious confidence in the success of its transformation plan. The company has attributed cost savings to changes in the scale of its offices and announced it expects further cost savings in H2’20 with the development of the store closure programme. Management’s confidence and the reported cost savings can have a material impact in the stock’s performance. Despite the strong results and as expressed before, we expect top-line deterioration will more than offset the targeted cost savings.
Better than expected LFLs in C&H
As of HY’20 results, the company reported full price and planned promotional sales growth of +2.7% for October. If space were to represent roughly c.-2% of growth, this would imply +4-5% LfL growth for the month. If this trend were to be maintained throughout the rest of the half-year, our estimates would suffer significant changes. However, despite these encouraging numbers, the positive performance is relatively in line with the industry growth for the same month, which presents the fastest annual growth rate since April (source: Kantar, Table 16).
Business Model
26
Food Revenues
Food revenues are estimated departing from two key drivers: (1) store/space contribution and (2) like-for-like (Graph 22).
26 We present performance for the three scenarios outlines, as explained below. If not clear, please consider we are referring to the Bull Scenario Table 16. UK Fashion Market Sales Change YoY
Source: Kantar
Oct/18 Nov/18 Dec/18 Jan/19 Feb/19 Mar/19 Apr/19 May/19 Jun/19 Jul/19 Aug/19 Sep/19 Oct/19 UK Market -1.5% -1.9% -1.3% -0.7% -0.3% 1.1% -0.8% -1.8% -4.0% -3.5% -2.4% -3.0% -1.7% M&S -2.4% -4.8% -5.0% -7.0% -5.3% -4.3% -3.0% -5.4% -8.1% -8.2% -5.6% -9.7% -3.7% Next -1.7% -1.6% -1.5% -1.4% -0.4% 1.2% 0.5% 0.4% -2.0% -0.6% 1.0% -0.3% -0.4% Primark 2.0% 2.6% 1.7% 2.2% 2.7% 7.4% 5.4% 6.4% 0.8% 0.7% 3.5% 2.9% 2.8% Debenhams -1.8% -0.9% -1.3% -2.6% -2.6% -2.1% -6.6% -11.0% -15.5% -14.4% -13.6% -14.0% -16.1% Zara -9.3% -7.5% -2.3% 6.6% 2.3% -1.1% -6.7% -5.3% 4.6% 7.2% 4.3% 2.0% 3.7% H&M -8.5% -6.4% -2.5% 3.2% 1.9% 11.8% 12.8% 14.1% 8.0% 8.5% 6.3% 10.0% 6.5% Arcadia Group -10.4% -15.3% -16.6% -14.5% -10.9% -5.1% -11.3% -14.5% -13.6% -14.1% -18.8% -16.3% -15.9%
Graph 22. UK Food Revenue Drivers, Bull Scenario
MARKS &SPENCER COMPANY REPORT
Store/space contribution
To assess the impact of space in food revenues, the number of stores and its size were estimated. The company is guiding for the net closure of 15 stores (i.e., total number of stores after the opening of new larger Simply Food stores formats and the closure of c.85 full-line stores) for FY’20. Assuming, on average, store size is declining following the company’s current store closure programme until 2023, it is possible to obtain an average store size of c.9,000 sq ft for mixed used stores and 7,000 for simply food stores. Assuming the productivity from space27 is the same
as in the previous year, we are able to obtain the impact from changes in space. Given the overall reduction in space until FY’23, we forecast negative space contribution until FY23, stabilizing to zero from then ownards.
Like-for-Like
To assess the performance of retained stores, we consider volume and price. Assuming price is growing roughly at inflation rate, volume will be driving revenues. To obtain the volume contribution, we estimate an average volume contribution for current lines based on historical data. As for new lines, we assume the company will be increasing the number of lines each year, reaching c.8,100 lines, placing M&S closer to the remaining food chains. Such assumption is aligned with the company’s strategy of (1) increasing its offer following its integration in Ocado and (2) becoming closer to an everyday place to shop. As it would not be reasonable to assume all lines are materialized into sales, we consider a penetration rate, variable in the analysed period (Graph 23).
Clothing & Home Revenues
In the case of Marks & Spencer, space contribution and like-for-like are the key drivers to understand C&H’s revenues (Graph 24).
Graph 23. UK Food LFL Evolution, Bull Scenario
Source: ER Analysis
Graph 24. UK C&H Change YoY per Driver, Bull Scenario