i
Diversification of the Angolan Exports – Challenges and Benefits
Francisco Miguel Paulo 152211012
Advisor:
Professor Isabel Horta Correia
Dissertation submitted in partial fulfilment of requirements for the degree of MSc in Economics, at the
Universidade Católica Portuguesa Lisbon, June 2013
ii
Acknowledgements
I want to give thanks and show my appreciation to everyone that directly and indirectly contributed to writing of this master thesis starting with Professor Isabel Horta Correia by accepting to be my advisor; Professor Alves da Rocha, Dr Aslak Orre, Dr Arne Wiig, Dr Ivar Kolstad, who urged and encouraged me to write on this topic; Dorivaldo Pedro, Nanizeidio Eduardo and Patricio Neto for giving me some data that was used in this research; Dr Noelma d’ Abreu and Dr Ricardo d’Abreu for sponsoring my studies; Professor Filipe Rafael by his kindly support; Crystal Badgett for revising and correcting the text, all members of the Catholic University of Angola (Rector and all members of Rectory, Dr Justino Pinto de Andrade, Dr Miguel Manuel, Dr Salim Valimamade, Dr José de Amaral, Dr Emilio Londa, João Miranda) for granting me the scholarship to do the master; and members of OSISA Angola (Elias Isaac and Albertina Delgado).
Also not forgetting the help that I received from Steinar Hegre, Aksel Mjeldheim, Soren Jensen, Dr Regina Santos, Dr Nelson Pestana, Margarida Teixeira, Precioso Domingos, Marco Paulo, Elsa Shichilenge, Marcio Daniel, Victor Chia, Dalvin Pipa, Cleiton Barros, Maria Sita, Sônia Moio, Zenilda Esperança, Martinho Mungongo, Leandra Tavares, Petro Coelho, Uncle Andre Paulo, Manuel Antonio, Francisco Rocha, Mingied Sanza, Constantino Paulo, João Paulo, Nsekele Paulo, Siminha Nsekele, Eduardo Salgueiro, Jofre Nelembe, Isabel Casimiro, Graça Barros and many others that I did not mentioned but are in my mind and heart.
iii
Abstract
In recent years several researchers have published papers on exports concentration (diversification) urging policymakers in the undeveloped world to endeavour to diversify their exports since this can contribute to boost the growth of per capita GDP. Researchers such as Imbs and Wacziarg (2003) and Hesse (2008) found a non-linear U shaped curve relationship between export concentration and GDP per capita growth in several non-oil producing countries around the world.
In order to investigate this relationship, for the case of Angola, a growth regression model was applied using OLS estimator with time series data from 1995 to 2011. This master dissertation investigates the case of Angola, an oil-producing country with one of highest export concentrations in the world, and found that the higher export concentration has been detrimental to the growth of GDP per capita taking into account that this growth would have been higher if the export concentration was lower ( higher diversification).
Therefore, this master dissertation found a non-linear concave relationship between export concentration and GDP per capita growth in the case of oil-exporting countries1 and not a U shaped curve as other researches had found earlier (Imbs and Wackiazrg (2003) and Hesse (2008)). However running regression for some no-oil exporting countries2 we found in the U shaped curve, a case to say that the pattern followed by oil-exporting countries is different from the non-oil producing countries, perhaps due to the fact that oil-exporting countries have on average higher export concentration levels than the non-oil exporting countries.
1
Angola, Algeria, Egypt, Equatorial Guinea, Iran, Iraq, Kuwait, Libya, Nigeria, Norway, Qatar, Russia, Saudi Arabia, Sudan, Tunisia, Venezuela and United Arab Emirates
2
China, Botswana, Congo, Lesotho, Madagascar, Malawi, Mauritius, Mozambique, Namibia, Seychelles, South Africa, Swaziland, Tanzania, USA, Zambia, Zimbabwe and others
iv
Sumário Executivo
Título da Dissertação: Diversificação das Exportações em Angola - Desafios e Benefícios
Nos últimos anos, vários investigadores têm publicado artigos sobre a concentração (diversificação) de exportações, exortando os políticos nos paises em vias de desenvolvimento a esforçarem-se para diversificar suas exportações, pois isso pode impulsionar o crescimento do PIB per capita. Pesquisadores como Imbs e Wacziarg (2003) e Hesse (2008) encontraram uma relação empirica não-linear, em forma de U, entre o nível de concentração das exportações e crescimento do PIB per capita em diversos países em todo o mundo.
A fim de investigar essa relação, um modelo de regressão de crescimento foi aplicado com estimador OLS com dados em séries temporais desde 1995 a 2011. Esta dissertação de mestrado investiga o caso de Angola, um país produtor de petróleo, com um dos maiores níveis de concentrações de exportações no mundo; os resultados encontrados são que a concentração das exportações tem sido prejudicial para o crescimento do PIB per capita, tendo em conta que este crescimento teria sido maior se a concentração de exportação fosse menor (ou seja se houvesse maior diversificação).
Assim este trabalho encontrou uma relação côncava entre a concentração das exportações e crescimento do PIB per capita no caso dos países exportadores de petróleo3, e não uma curva em forma de U, como outras pesquisas tinham encontrado anteriormente (Imbs e Wackiazrg (2003) e Hesse (2008)) no caso de países não produtores de petróleo. No entanto extendendo o estudo para países não produtores de petróleo4 re-encontramos a curva em forma de U, um caso para dizer que o padrão seguido por países exportadores de petróleo é diferente dos países não produtores de petróleo. Essa diferença pode dever-se ao maior nível de concentrações de exportações dos países produtores de petróleo em comparação com a maioria dos não produtores.
3
Angola, Algeria, Egipto, Guine Equatorial, Irão, Iraque, Kuwait, Libia, Nigeria, Noruega, Qatar, Russia, Arabia Saudita, Sudão, Tunisia, Venezuela e Emiratos Arabeis Unidos
4
China, Botswana, Congo, Lesotho, Madagascar, Malawi, Ilhas Maurícias, Moçambique, Namibia, Seychelles, Africa do Sul, Swazilandia, Tanzania, EUA, Zambia, Zimbabwe e Outros
v
Table of Contents
1. Introduction ... 1
2. Literature Review ... 2
2.1 The importance of export diversification (Why diversify exports, some stylized facts) ... 2
2.1.1 First reason: export diversification has a positive effect on GDP per capita growth ... 4
2.1.2 Second reason: export diversification can serve as a hedge against economic growth volatility ... 5
2.1.3 Third reason: the positive impact that export diversification might have on the fight against natural resources curse and Dutch disease ... 6
2.1.4 Fourth reason: export diversification may help in the improvement of democracy ... 8
3. Overview of the Angolan Economy ... 9
3.1 Looking at Macroeconomics (Causes and Consequences of the lack of diversification) .... 9
3.2 The Structure of the Economy ... 15
3.2.1 The GDP´s Structure ... 15
3.2.2 The Exports’ Structure ... 16
3.3 Angola´s Main Trade Partners in the Exports ... 23
3.4 Export Concentration indicator (Herfindahl Index) ... 25
4. Methodology and Data Collection ... 30
4.1 The Sample ... 32
4.2 Data description ... 33
5. Results´ Analysis ... 34
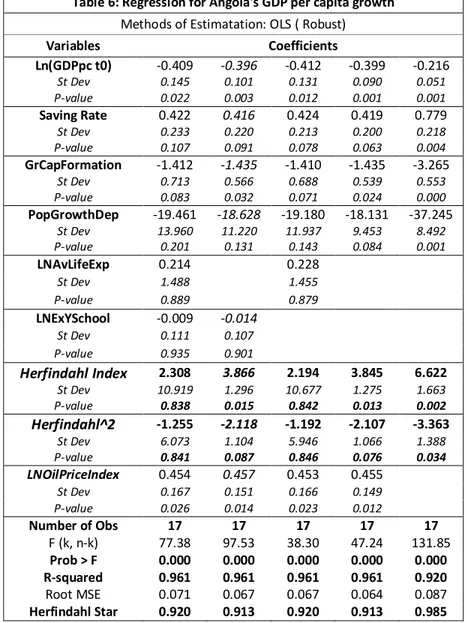
5.1 Angola’s GDP per capita growth and export concentration ... 34
5.1.1 The effect of Herfindahl exports concentration index on the Angolan GDP per capita ... 37
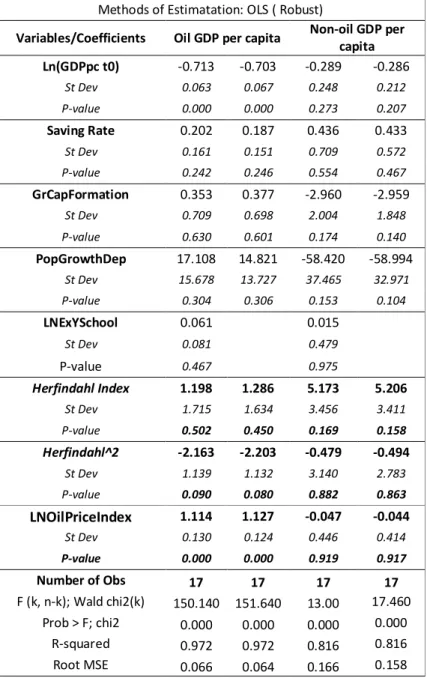
5.1.2 The oil and non-oil GDP per capita growth Regressions ... 39
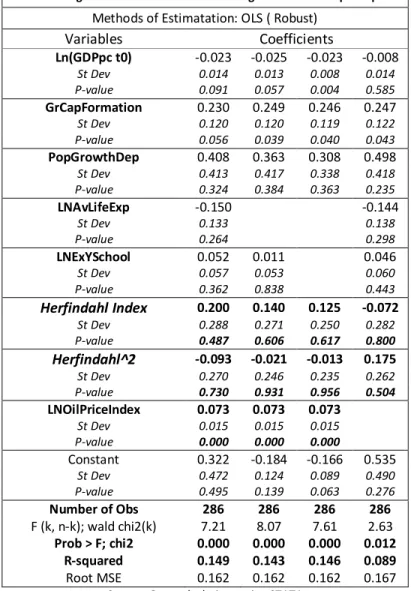
5.2 Including the main oil-exporting countries in the sample ... 41
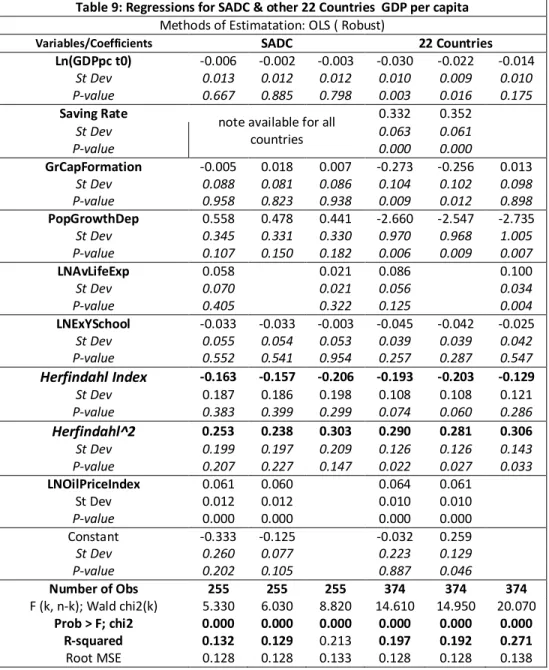
5.3 The whole sample (Regression for SADC and other 22 Countries) ... 42
6. Conclusion, Limitations and Future Research ... 46
7. Bibliography ... 48
8. Appendix ... 50
Acronyms ... 50
List of Charts ... 50
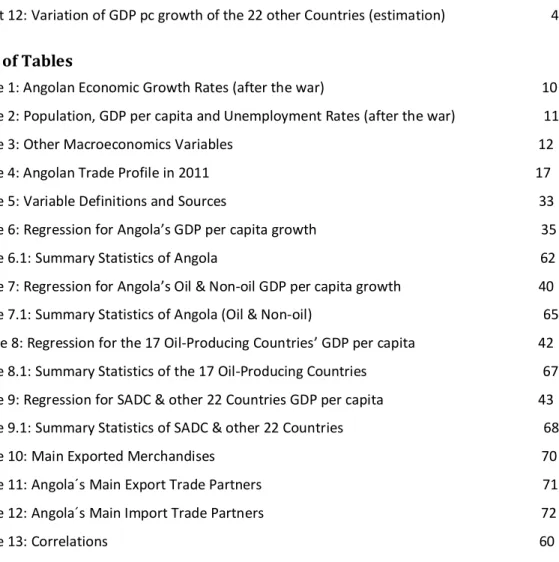
List of Tables ... 51
vi
2.2.1 The Herfindahl Index ... 52
2.2.2 The Theil Index ... 52
2.2.3 Hummels and Klenow´s Intensive and Extensive Margins ... 54
2.2.4 Gini Index ... 55
2.3 Drivers of Diversification ... 56
OLS Assumptions... 59
Regressions Related Data (Angola) ... 62
Angola (Oil & Non-oil) ... 65
Oil-Producing Countries ... 67
SADC and 22 Countries ... 68
1
1. Introduction
Exports diversification is a very important topic that interests not only policy makers, but also researchers of international organizations and academics. Several papers and case studies (Hesse, 2008; Misztal, 2011; Carrère, Cadot, Strauss-Khan, 2011) have shown the importance of export diversification for the economic growth in some countries around the world, finding a positive relationship between export diversification and GDP per capita, showing that an decrease of the level of export concentration (increase in the level of export diversification) leads to an increase of GDP per capita growth.
In a volatile and uncertain world, countries with higher levels of export concentration are very sensitive to any change in the international market affecting severely the economic situation of those countries regarding growth, revenue, employment, and poverty. Data from the United Nations Conference on Trade and Development shows clearly that developing countries are the ones with higher export concentration levels and in turn with more volatile economic growth throughout the years due to the less export diversification, whereas developed countries have a more stable economic growth as result of having higher export diversification.
According to the UNCTAD database, Angola is one of the developing countries with the highest export concentration in Africa, with the index of 0.971 in 2011 (measured by Herfindahl index). This index illustrates well how concentrated Angolan exports are! In fact, data from Angola Customs shows that oil represents more the 95% of the total exports and if combined with diamonds the percentage goes up to 98%.
Angolan exports depend entirely on oil and diamonds, with more emphases on oil. The price of oil, which is set in the international market, “commands” the economic prospects of the country; if the price is high in a certain year, the economic growth is higher in that year, as occurred between 2004 and 2008, and lower if the price low, fact that happened in 2009 and 2010.
2
The fact that Angola is one of the countries with the highest export concentration in Africa (with all its implications in term of volatile growth) plus experience from the summer internship that I had last year at CMI in Norway, I was motivated to write this master dissertation on this topic to see: if Angola can really diversify its exports, although this is not an easy task and neither impossible; among the main drivers of export diversification presented by the literature, the ones that are related with Angola; the benefits that can come from this process; and if there is a linkage between export diversification and economic growth in the case of Angola.
Therefore in this dissertation we attempt to answer the following research questions:
Can Angola benefit from export diversification? To what extent can export diversification increase GDP per capita growth in Angola? Does Angola follow the U-shaped pattern in the relationship between export concentration and GDP per capita growth as Hesse (2008), Imbs and Wacziarg(2003) argued as being the case of most of the countries around the world?
It is important to highlight that this paper differs from the others because it studies specifically the Angolan case, of course it follows the literature and the case studies by Hesse (2008), where he showed the positive relationship between export diversification and economic growth in more than 90 countries, and by Misztal (2011) that studied only the European Countries, showing that export diversification in those countries has been increasing GDP per capita growth.
2. Literature Review
2.1 The importance of export diversification (Why diversify exports, some stylized facts)
An African popular proverb says, it is important and necessary not to sow only one type
of crop, because if it fails the entire village will severely be affected and suffer. This
proverb helps us to see how important and crucial it is for a country not to rely only on one export product or to concentrate its export on few goods in these uncertain and turbulent times that we are living today, although the classical theory of David Ricardo (1817) pointed out that every country should specialize and concentrate on producing
3
and exporting the goods where it has the comparative advantages in comparison to its trade partners5.
The theory of international trade started by Adam Smith (1775) in his classic book the
Wealth of Nations and developed in details by Ricardo (1817) on his book the Principles of Political Economy and Taxation, (where he formulated the law of
comparative advantages and gave the classical example of Portugal and England about the production and export of wine and cloth by the two countries and argued that since Portugal has comparative advantages in producing wine over England it should focus on this product and England on other hand on the production of clothes since it had comparative advantages over Portugal), and extended in modern times by the Heckscher-Ohlin-Samuelson theory, urges the nations to focus their efforts on producing and exporting goods and services in where they have comparative advantages over their trade partners.
However, the international trade theory does not imply that the nations should not differentiate exports by producing and exporting diversified sets of goods and services. The lack of comparative advantage should not hold back a country to produce and export different products taking into account one can learn to improve the efficiency in production by not holding back but yes, by producing. Besides, there are sound and valid reasons why a country should endeavour to make an effort to diversify its export and not to concentrate it on few products.
The literature on export diversification presents several reasons and some stylized facts why a country should strive to diversify its exports, among them: first of all the positive effect export diversification has on GDP per capita; second the role of export diversification as a hedge against sectoral fluctuation or volatility, third, the impact of export diversification on natural resources curse or Dutch Disease; and finally the effect of export diversification on democracy improvement.
5
4
We will now examine each of the above mentioned reasons to see how important export diversification is and why countries should set economic policies aiming at it. 2.1.1 First reason: export diversification has a positive effect on GDP per capita growth
In theory, a country which diversifies exports produces more different goods and services with the same number of workers and thereby or in doing so, it increases the gross domestic production per capita. In fact this does not occur in a linear way, since according to Imbs and Wackziarg (2003) the relationship between export concentration (measured by Gini index) and GDP per capita plotted graphically has a “U” shaped curve. They argued that decreasing export concentration (which implies the increasing export diversification) leads to an increase in the level of GDP per capita up to certain amount (a threshold that they computed ranging between 9 to 11 thousand USD) from which a country starts to specialize in exporting some goods and services which will lead to concentrate the export again.
Also Hesse (2008) in his working paper found out an empirical evidence of a positive effect of export diversification (concentration) on GDP per capita growth. According to him the “effect is potentially nonlinear with developing countries benefiting from diversifying their exports in contrast to the most advanced countries that perform better with export specialization”6.
A more recent empirical research done by Misztal (2011) concerning export
diversification and economic growth in European Union member states concluded that
“during the years 1995 to 2009 exports diversification (concentration) was one of the most important factors that determined the level of GDP per capita in the EU” 7. He found that the impact of export concentration on changes in GDP per capita was about 0.33 and that more than 30 percent of the variability of income per capita in the EU was due to the changes in the index of export concentration. It is important to
6
Hesse, H., 2008. Export Diversification and Economic Growth: Commition on Growth and Development, Working Paper No.21 page V.
7
Misztal (2011), Export diversification and economic growth in European Union member states, Oeconomia 10 (2) 2011, page 63
5
highlight that in the particular case of the EU countries, he did not find a U shaped curve, as Imbs and Wickziarg did in 2003, but yes, a W shaped curve, which meant according to him, during 1995 to 2009 “the exports diversification increased in countries of EU with relatively low GDP per capita, while the exports concentration increased in countries with relatively high GDP per capita”8. Regarding the income per capita threshold beyond which the countries of the EU he studied increased their level of export concentration was 6,000 USD for the poorest countries and about 20,000 USD for the richest countries of the EU.
Thus, it’s crucial to diversify exports (reduce export concentration index) in order to have a higher level of GDP per capita growth and to generate more income for the populations in the economy.
2.1.2 Second reason: export diversification can serve as a hedge against economic growth volatility
The world statistics on economic growth show us clearly that the growth rates, throughout the past century, of poor countries around the world are more volatile and unstable vis-à-vis to those of the rich and more developed countries. Why is this so? Why do poor countries face greater fluctuation and instability of growth than the rich countries? The answer to this questions helps to see how important diversification is.
Koren and Tenreyro (2007) on their paper on volatility and development9 did a volatility accounting analysis in order to find out the source of the growth volatility in poor countries. They presented three main reasons, one of them was the less developed countries concentrate their production in fewer and more volatile sectors and very often the sectors where they specialize in are affected by aggregate shocks either internal ( due to country specific risk such us political instability or even macroeconomic policy) or external ( coming from the international markets). They concluded that almost 50 percent of volatility that poor countries experience is for the
8
Misztal (2011),Eexport diversification and economic growth in European Union member states, Oeconomia 10 (2) 2011, page 63
9
6
reason that they concentrate or specialize in fewer and more volatile sectors. This does not occur with rich countries since they have a more diversified economic structure which allows them to have a more diversified exports structure.
So, Koren and Tenreyro (2007) showed that by having a diversified economic structure (which in its turn leads to a diversified exports structure) developed countries are able to shield themselves against economic growth volatility and sustain their economic development. Less developed countries, if they want to protect themselves from the growth instability that they have being facing throughout the years, should strive to diversify their production structure by producing and exporting new products and not relying only on their fewer and volatile existing production sectors which are the main source of their income.
The international financial and economic crisis that affected and is still affecting the world in current days was a wakeup call for all countries and particularly for the poor ones to diversify their economies and exports if they do not want to pass through the same experience again in the years to come. Countries with a more diversified economic structure were less affected by this crisis, revealing clearly that diversifying the export structure is indeed a protection or shield against economic volatility and poor countries are urged to do so if they want to have a less volatile and sustainable economic growth and development.
2.1.3 Third reason: the positive impact that export diversification might have on the fight against natural resources curse and Dutch disease
It is well documented in the economic literature, through statistic data and empirical researches, how most of resource-rich countries all over the world10, especially in
10
Of course with exception of countries such as Australia, Botswana, Chile, Canada and Norway, that although riches in natural resources, were able to be “growth winners” by taking full advantages their resources to diversify their economy and maintain in this way a steady and sustainable economic growth with strike contrast with other countries such as Angola, Bolivia, Congo Democratic, Nigeria, Zambia, Saudi Arabia and Venezuela. Mehlum et al (2006), Institutions and the resource curse, The Economic Journal, 116 (January) pages 1-20.
7
South America and in Africa, have tended to fail to grow fast and steadily despite the natural resource abundance that they have. This phenomenon is called natural resource curse due to fact that the resources in this countries, instead of boosting a sustainable economic growth, are actually viewed as detrimental to the growth. Sachs and Warner (1995) in their working paper entitled natural resources abundance and
economic growth, documented what they called a statically significant evidence of the
negative relationship between natural resource intensity or concentration and subsequent economic growth, consequently confirming empirically the theory of natural resource curse.
Other phenomenon linked to natural resource curse is the Dutch disease that for some is viewed as one of the causes of the natural resource curse since this so called disease is the crowding out of the no-natural resources sectors of the economy, such as the manufacturing industry, caused by the increase of the real exchange rate and wages driven by the increase of the revenues from natural resource exports, damaging in this way the other productive sectors of the economy. However, Frankel (2010) argued that viewing the Dutch Disease like this; we are in effect referring to natural resource curse.
In view of the damaging effect o that natural resource curse and Dutch disease have on the economic growth, what role does a diversification of the economic structure can have in counteracting this effect? Well, Matsuyama (1992), in his paper where he formalized a model of endogenous growth that demonstrated the relation between agricultural productivity and growth, gives the intuition that the manufacturing industry is characterized by learning by doing and this implies that a diversification out of extractive industry (of natural resource endowment) into other economic sectors such as services and manufacturing industries could help boost a sustainable economic growth.
For this reason, export diversification if taken seriously can be used as a valid reason to set economic policies aiming to promote export differentiation through the targeting
8
of economic structure diversification by using the revenues from the natural resource exports to strengthen and support the no-commodities sectors of the economy. A well or fairly diversified economy, and consequently export structure, can be viewed as a
shield against the tendency of allowing the revenues coming from the extraction of
natural resources to hinder and crowd out the other sectors of the economy. Policymakers in this case are forced to carefully ponder over the advantages and disadvantages, not only in the short term, but also in the long-run for the economy as a whole of allowing the existence or presence of this harmful phenomenon in the economy. That's why we argue that promoting export diversification can have a positive effect on the ruling out of resource curse and Dutch Disease phenomenon’s in the economy.
2.1.4 Fourth reason: export diversification may help in the improvement of democracy
The transition from oligarchic (or dictatorship) institutions to democratic ones during the centuries was accomplished in some cases with the emergence of middle classes and their consequential economic empowerment from gradual participation in the ownership structure of existing economic activities and in new ones. Acecmoglu (2008) argued that the high levels of income distribution that maybe obtained in democratic institutions is one of the attractive features of the democracy. According to him, democratic societies “may be better able to take advantage of new technologies11” making it possible to start new businesses faster than in dictatorship societies.
The extent to which diversification can lead to better democratic institutions needs to be carefully analysed in view of the fact that not all forms of diversification lead to better institutions; this warning comes from Wiig and Kolstad12 (2011). These two Norwegian researchers argued that it is the pattern of industrial activity, in which an
11
Acecmoglu (2008), Oligarchic versus Democratic Societies, Journal of the European Economic Association March 2008 6(1) page 1
12
Arne Wiig and Ivar Kolstad are both economists and seniors researchers at Chr. Michelsen Institute (CMI) of Norway
9
economy is centred on, which affects institutions like democracy rather than diversification per se, and where diversification has a positive impact on institutions, in some cases diversification might be hard to accomplish when it intimidates the power of the ruling party or elite.
Although not all forms of diversification lead to enhanced democratic institutions, it is a fact that diversification increases the income per capita and if well distributed this will improve the economic capacity of the citizens which in its turn will more likely allow them to earn higher incomes and give them more power to demand or require changes in institutions that can benefit all in the economy and not only the ruling elite. So, it is good to promote export diversification in view of its effect on the quality of institutions and economic democracy or liberalism.
After reviewing the literature, let us now have an overview of the Angolan economy, which is the object of study in this master dissertation to see how it is faring on the road to diversification, what benefits it can take from diversifying its exports and the challenges involved.
3. Overview of the Angolan Economy
Angola is a country located in the southern African region sharing borders with Democratic Republic of Congo in the North, Zambia in the East, Namibia in the South and the Atlantic Ocean in the West. It has an area of 1,246,700 km2 with a shoreline of 1,650 km of coast with four major ports along the shore, namely the ports of Cabinda, Luanda, Lobito and Namibe. Besides the ports the country also has three main border posts of customs: the border post of Luvu in the Zaire Province (in the north at the border with Congo); the border post of Luau in the Moxico Province (in the East at the border with Zambia) and border post of Santa Clara in the Province of Cunene (in the South at the border with Namibia).
3.1 Looking at Macroeconomics (Causes and Consequences of the lack of diversification)
After becoming independent from Portugal in 1975, Angola faced an intense civil war that destroyed most of the economic infra-structure which led to the paralysation of
10
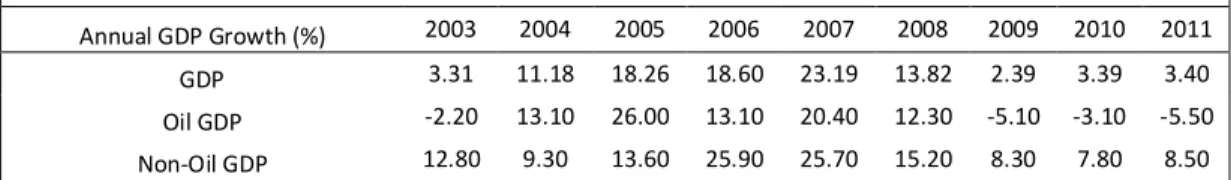
most economic activities (agriculture and the industry) except the production of oil and diamond that were used mainly to finance the war. In 2002 the war ceased and eventually the country gained peace. With the peace Angola increased the production of oil and diamonds and started to invest in agriculture and industry and other sectors of the economy such as services which led to the boom of GDP growth as we can see in the table 1 below.
Table 1: Angolan Economic Growth Rates ( after the war)
Annual GDP Growth (%) 2003 2004 2005 2006 2007 2008 2009 2010 2011
GDP 3.31 11.18 18.26 18.60 23.19 13.82 2.39 3.39 3.40
Oil GDP -2.20 13.10 26.00 13.10 20.40 12.30 -5.10 -3.10 -5.50
Non-Oil GDP 12.80 9.30 13.60 25.90 25.70 15.20 8.30 7.80 8.50
Source: BNA, MINPLAN, IMF and Economic Reports of CEIC/UCAN
A year after the cease of the war, Angola recorded a growth rate of 5.31%13 and from there on the average growth rate was about 17.01% from 2004 up to 2008. The peace allowed Angola to have a tremendous growth mainly due to the increase of oil production that was stimulated by the increase of the demand and price of oil in the international market. This period of high growth that Angola had from 2002 to 2008 is considered to be the mini golden age of the Angolan economy14 given that Angola never in its history has had such remarkable growth.
These growth rates reveal how concentrated the Angolan economy is. As we can see in table 1, in every year that the oil sector had a negative growth (2003, 2009, 2010, 2011) the overall GDP growth rate is less and lower although the non-oil sector had a positive growth rate. The financial and economic international crisis was a wakeup call to the Angolan authorities since this led them to realize, after experiencing the bad consequences of relying only on the oil production, that it is crucial and necessary to diversify the economy as Jensen and Paulo (2011) argued.
13
According to Professor Alves da Rocha (one of the most known Angolan economists, former assessor of the Ministry of Planning and current director of CEIC/UCAN) this growth rate was due to the break in the growth production of oil in 2003 compared to the preceding year which led to a decrease of the overall rate of GDP since oil production represented at that time 54,9% of the GDP. – Economic Growth
in Angola to 2017 the main challenges, Angola Brief December 2012 Volume2 No.4.
14
11
The several projects of reconstruction that were implemented after the peace stirred most of the growth of the non-oil sector during the golden age period. Data from the Ministry of Planning show that during this period the sector of construction (public works and civil construction) had an average growth of about 30% whereas the agriculture was about 15%, and the manufacturing industry was about 25 %. These higher rates of growth of the non-oil sector need to be interpreted carefully taking into account that after the end of the war the non-oil sector started, so to speak, nearly from the scratch thus having a very low base from where the growth started to be counted.
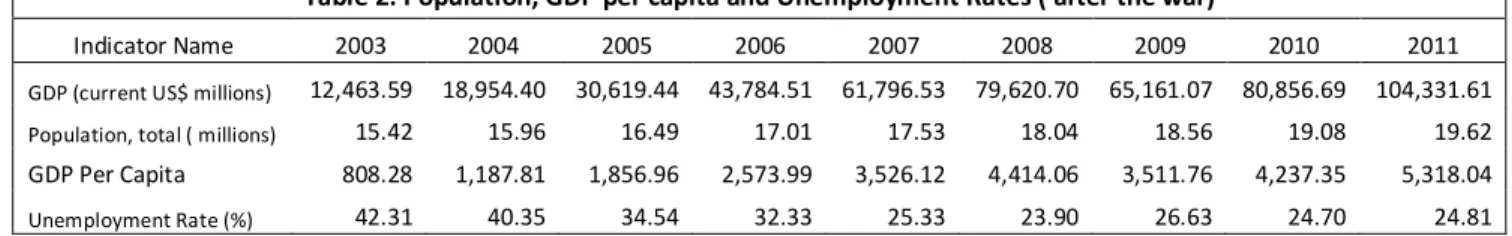
The current Gross Domestic production of Angola today is almost 8 times greater than what it was after the end of the war in 2002. In 2011 the GDP was estimated to be 104 thousand millions of USD whereas in 2003 it was about 12 thousand millions as the table 2 shows.
Table 2: Population, GDP per capita and Unemployment Rates ( after the war)
Indicator Name 2003 2004 2005 2006 2007 2008 2009 2010 2011
GDP (current US$ millions) 12,463.59 18,954.40 30,619.44 43,784.51 61,796.53 79,620.70 65,161.07 80,856.69 104,331.61
Population, total ( millions) 15.42 15.96 16.49 17.01 17.53 18.04 18.56 19.08 19.62
GDP Per Capita 808.28 1,187.81 1,856.96 2,573.99 3,526.12 4,414.06 3,511.76 4,237.35 5,318.04
Unemployment Rate (%) 42.31 40.35 34.54 32.33 25.33 23.90 26.63 24.70 24.81 Source: Unemployment rates from Economic report of CEIC/UCAN; Population from World Bank Data base; GDP from WB data
base and the Ministry of Planning of Angola.
Since 2003 the Angolan total population has been growing on average at the rate of nearly 3% a year this is lower than the rate at which the GDP has been growing (an average of 10.8% from 2003 to 2011). This fact allowed a GDP per capita increase from $808.28 in 2003 to $5.318.04 in 2011 contributing to the improvement of the Human Development Index that increased from 0.375 in 2000 to 0.508 in 2012, corresponding to an average annual increase of 2.6%15. Still in 2012 Angola was ranked at 148 out of the 187 countries, with a low human development index. The life expectancy at birth increased by 6.3 years between 2000 and 2012 while in 2000 was 45.2 years, in 2012 was 51.5 years. The mean years of schooling has not increased so much since in 2000 this was 4.4 and in 2012 was still 4.7.
15
12
The unemployment rate is still very high according to the estimates of the research centre for scientific studies of Catholic University of Angola (CEIC/UCAN) although it has been decreasing from 2003 to 2011. Almost 24.81% of the labour force in Angola is unemployed making life difficult for the majority of the households since without income they cannot feed their families contributing to the increase of the poverty rate among the population.
The high unemployment can be explained on the one hand due to the lower years of schooling of the labour force (most of the companies import a lot of workers from abroad arguing that is due to the lack of skilled local workers) and on the other hand due to concentration of the economy on oil production which is highly capital intensive requires fewer workers in comparison to the non-oil sector such as agriculture, manufacturing industry and services. Thus, endeavouring to diversify the economy will for sure help to increase the employment rate and decrease the unemployment among the labour force in Angola and consequently decrease the high poverty rate that still plaguing the Angolan population and improve their life conditions. This can be one of the most important channels for diversification to improve welfare.
With the end of the war the Angolan government managed to set economic policies that allowed the country to achieve macroeconomic stability regarding the main macroeconomic variables such as the inflation rate, the exchange rate and the net international reserves. Having those variables stabilized was fundamental and it still is today, to ease the business climate and to inspire trust and confidence to the investors and entrepreneurs making them to feel comfortable to invest in the economy.
Table 3: Other Macroeconomics Variables Others macroeconomic
variables 2003 2004 2005 2006 2007 2008 2009 2010 2011 Inflation Rate (%) 76.56 31.02 18.53 12.21 11.78 13.17 13.99 15.31 11.38
Exchange Rate ( AOA/USD) 78.79 85.63 80.78 80.08 74.83 74.85 89.40 92.64 95.28
Net Intern. Reserves ( US$ millions) 8,172.00 11,191.00 17,499.00 12,621.48 17,368.70 26,084.20
Source: INE, BNA; CEIC/UCAN
As table 3 shows the inflation rate was very high in 2003, in the first year of peace, it was 76.56% and four years later, in 2007, the inflation rate was 11.78%. This tremendous reduction was due to the good monetary policy and instruments used by
13
the Central Bank (Banco Nacional de Angola) to reduce and stabilize the inflation rate and they managed to do so. In order to inspire trust to the investors in the economy, because of the high inflation, at that time the Central Bank allowed the use of the United States Dollars as currency along with the local currency Kwanza (AOA) in the economy. Everyone could use dollars in almost every transaction even to pay salaries and ask loans from the commercial banks and this was particularly convenient and good to the importers and exporters given that they used dollar in their international trade.
The Central Bank used the exchange rate (kwanza (AOA)/ Dollar) as an anchor to keep the inflation rate (measured by the consumer price index) under control and reducing in this way the prices of goods and services in the economy16. As we can see on the table 3, the reduction of inflation was related with the reduction of the exchange rate from 2003 to 2007. In order to have the exchange rate lower and under control the Central Bank used the net international reserves. In this period of the golden age17 the export of oil was excellent and this allowed the Central Bank to have the dollars needed to stabilize the exchange rate and controlling in this way the inflation rate. Nevertheless, at the end of 2008 with the start of the international crisis the export of oil dropped dramatically affecting negatively the inflow of the international reserve in the economy. This fact put the Central Bank in an awkward and difficult situation since they could no longer count on the international reserve to control the exchange rate and the inflation rate, that is why we saw an increase of the inflation rate from 2008 to 2010. But in 2011 and 2012 with an increase in the of price of oil in the international market, things slightly improved, as it was possible to keep the inflation under 10% in 2012, with the international reserves reaching the value of 29 thousand millions of dollars, almost 27% of GDP and represents more than 7 months of imports.
16
The Consumer Price Index used to measure the inflation rate by the National Bureau of Statistic (INE) refers only to prices of the capital of the country (Luanda) and not of all the country (the 18 provinces). According to INE this is so due to the lack of infra-structure and staff to cover all the country. Then the inflation rate presented are only of Luanda and it is important to highlight that more the 70% of the economic activities are concentrated in Luanda as Aves da Rocha documented in his book on regional umbalances and inequalities in Angola (2010).
17
14
But the problem of inflation in Angola is not only a monetary one; other factors also play a big role such as the quality of the infra-structures and of the institutions (the port, the Customs, the customs brokers, the high level of bureaucracy in these institutions); the lack of the national production of most of the consumable goods that leads the country to import more than 60% of this type of goods and importing in this way also a part of the inflation; and the lack of law enforcement with regard price speculations, etc.
Regarding the bureaucracy in the institutions, most of the companies that respond to the quarterly18 survey done by the CEIC/UCAN to measure the climate of doing business in Luanda complain about the efficiency of the instructions related with the international trade and the quality of infra-structures (such as electricity, water, telecommunications, roads and other facilities) since these factors, according to them, make the cost of doing business too high. This fact is not surprising since the report of the World Bank on doing business ranks Angola in the group of countries where doing business is not easy and is highly costly. The Report of 2013 ranks Angola in the
position 17219 out of 185 worldwide and among the factors that contributes to this are
the length of time needed to start a business, the difficulties to get property registration, construction permits, credit and loans and the difficulties to trade across the borders. Then if Angola really wants to diversify its economy and consequently its exports it is imperative to improve and ease the climate to do business.
In summary the macroeconomic variables presented in the table 3 also help us to see how important and fundamental it is to diversify the Angolan exports in order to achieve a more sustainable macroeconomic stability and to ease the environment to do business. The country needs urgently to have other main products of exports besides oil, in order to diversify its source of international reserves. The Angolan authorities and policymakers should take to heart the wakeup call that the
18
This quarterly survey is called Barómetro de conjuntura económica ( barometer of the economic conjuncture) and surveys more than 150 companies to get their perception if the climate of doing business in the prior quarter was favourable to them or not.
19
15
international crisis aroused and commit themselves to diversify the economy and its exports. The depreciation of the Kwanza in relation to the US dollar would have been a great opportunity to export more products if Angola exported more of other products rather than oil, in view of the fact that with the depreciation of the local currency the exports become cheaper to the international buyers.
3.2 The Structure of the Economy
3.2.1 The GDP´s Structure
The Angolan Gross Domestic Production is made of or comes from several economic activities such as agriculture, fishing, diamonds and other minerals, oil, manufacturing industry, construction, energy and water, merchant services and other services (banking, insurance, telecommunications and so on). But as for the sake of national accounts and statistics, the GDP is divided or grouped in two main categories of production: oil and non-oil. The oil GDP refers to all production related with the extraction of crude oil and its derivatives and refinery, whereas the non-oil GDP is the production of all other goods and services without including the oil sector. The graph 1 the structure of the Angolan GDP according to the classification stated above.
Source: Data from BNA, MINPLAN, CEIC/UCAN and own calculations
As we can see from the chart 1, from 2003 up to 2008, during the mini golden age, more than half of the all Angolan Gross Domestic Production was oil related production, showing how concentrated the Angolan GDP was; the whole depended solely on one commodity. The all other sector production all combined (agriculture,
16
fishing, diamond and other minerals, oil, manufacturing industry, construction, energy and water, merchant services) was less than 45% of GDP on average.
From 2009 to 2011, the years of the international crisis that affected deeply the price of oil, the non-oil GDP was able to overcome the weight of the oil sector in the economy, weighting more than 53% of the total GDP. In our understanding this was possible for the most part due to the two factors:
Firstly due to the accumulative decrease of oil production in this period of 13.7% (on average -4.57 of decrease per year) compared to period of 2004 to 2008 where we had positive growth rate of the oil sector; doing a simple empirical calculations20 we see that during this period the decrease of oil production led to the accumulative destruction of the growth of the overall GDP of about -6.33%, on average about -2.1% year.
Secondly owing to the positive modest growth of the non-oil sector that on average was 8.2% year. If was not for this positive growth of the non-oil sector, Angola could have faced a big recession. During this period this sector was able to have an accumulative contribution to the overall growth of GDP of about 13.26%, on average 4.42 per year.
3.2.2 The Exports’ Structure
Before presenting the composition and structure of the Angolan exports let us first have a quick view of its position in the international trade and within the different regional and international organizations that is part of.
Angola is a member of the World Trade Organization, a worldwide organization whose
primary purpose is to open trade for the benefit of all21 involved in the international trade. The country got WTO accession on 23 November 1996, eleven years after the
20
The Calculations imply just multiplying the growth of the oil sector with its respective weight on the GDP ( growth oil GDP * % Oil Sector on GDP)
21
17
establishment22 of this organization with more than 150 countries members. Belonging to this organization can actually be good and advantageous for the country given that as a member it has opportunity to export its products to all other members without great obstacles concerning tariffs and import duties that might hinder the international trade. And as a member of the Least Developed Countries negotiation group within the WTO, Angola as a poor country can get special preference to export its agricultural and some manufacturing products to developed countries, under the Generalised System of Preferences, thus by diversifying the exports Angola can benefit and take advantages of being member of the WTO.
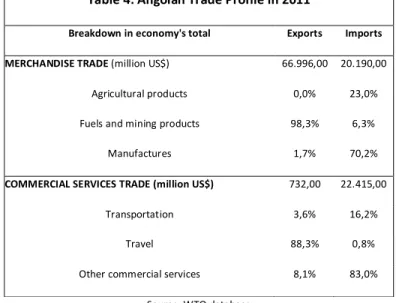
Data from WTO gives note that in 2011 Angola’s share in the world total exports was about 0.37% whereas the imports were 0.11%.
Table 4: Angolan Trade Profile in 2011
Breakdown in economy's total Exports Imports MERCHANDISE TRADE (million US$) 66.996,00 20.190,00
Agricultural products 0,0% 23,0% Fuels and mining products 98,3% 6,3%
Manufactures 1,7% 70,2%
COMMERCIAL SERVICES TRADE (million US$) 732,00 22.415,00 Transportation 3,6% 16,2%
Travel 88,3% 0,8%
Other commercial services 8,1% 83,0% Source: WTO database
Those figures per se do not give us much information. It is important to breakdown those figures to see deeper and obtain meaningful information about the Angolan exports. As we can in the table 4, of all merchandise exported, 98.3% was just mineral, that is oil and diamonds whereas manufactures were only 1.7% and agricultural products almost zero because are insignificant. Looking at the imports we see that 23% of them were agricultural products and 70% manufactures. Here we see a great room
22
The WTO was established in January 1, 1995. It has its headquarters in Geneva, Switzerland. On March 2, 2013 the WTO had 159 countries as members.
18
to diversify the exports, if Angola could invest in agriculture and manufacturing could reduce some imports of these goods and even export more, reducing in this way the weight that oil and diamonds have.
Table 4 also gives us information regarding the export and import of commercial services, 88.3% of exported services were travel whereas other commercial services (such as communication, construction, insurance, financial, computer, information, other business, and cultural and recreational services, and royalties and license fees) were just 8.1%, too low in comparison to the imports of these services that were 83% of the total imported commercial services. These figures tell us that Angola can as well diversify its exports by investing in the sectors of commercial services and export more of these services than what is being done currently. For that purpose to be accomplished it is crucial to invest in quality education among the population and especially the young generation.
Now we are going to look at the breakdown of the Angolan exports according to the figures from the national customs services of Angola to see in details the main products exported by the country and their respective weight in the nations´ total exports.
According to the Standard International Trade Classification (SITC) revision 3 at 3 level of the United Nations Conference on Trade and Development (UNCTA), the export lines of Angola is made up of many products such as crude oil, diamonds, refined petroleum, natural gas, coffee, sisal, fish and fish products, timber, cotton, agricultural products and many other products and services. According to the National Customs the export line of Angola contains more than 2 thousands products; but the most exported number of products, with the monetary value greater than 100,000 USD, is shown in the chart 2.
19 Source: UNCTAD data base
As we can see in the chart 2, in 1995 Angola exported 31 different products with monetary value higher than 100,000 USD and considering the period between 1995 and 2001, a period of war, the average in this time was 50 per year; after the end of the war in 2002, the average number of the most exported products increased. Between 2002 and 2011 the average was 69 without including 2007 and 81 if 200723 is included.
Out of all total number of exported products, crude oil, refined oil, gas, and diamonds are among the main exported products and the crude oil is of course the most exported product of all.
23
The year 2007 was an outlier in the history of the economic growth of Angola since in this year the country recorded the highest growth rate of its economy and thus the high level of the number of products exported which the monetary value was greater than 100,000 USD in 2007 can be explained due to this fact. Some facts might explain this: in 2007 Angola joined the Organization of Petroleum Exporting Countries (OPEC) and also in this very year Angola got a credit line from the Chinese Eximbank amounting to US$2.5 billion. ( in 2004 and 2005 Angola had already received up to US$4 billion)
20
Source: Alfandegas de Angola and BNA
The Chart 3 shows clearly how the Angolan exports are concentrated on just one product, which is the crude oil. In 2004 more than 92% of the total export was crude oil and this percentage is increasing from year to year as we can see in the graph 3. From 2004 to 2012 the export of crude oil on average was 95% of the exports; just in 2012 alone the weight was more than 96 percent. The weight of diamonds in the total value of the exports has been decreasing since 2004, in this year the more than 5% of the total exports were diamonds whereas in 2012 the weight was less than 2%. The weight of refined oil is on average almost 1 percent of the exports strikingly inferior to the export of the crude oil. This shows that nearly all crude oil that Angola produce is not refined within the country but is sold as such; even part of the refined oil that is consumed internally is imported from abroad24.
The export of natural gas is on average 0.5% of the total exports; these figures would actually be higher if Angola did not burn most of the natural gas coming from the process of the extraction of the crude oil. But with the implementation of the Angola
24
According the report of the Alfandegas de Angola (Angolan Customs) 2012, the imported refined oil is on average more than 4 percent.
21
LNG Project25, a specific factory (industry) destined to recover and treat the natural gas and then export it, the weight of the natural gas in the total exports will certainly increase in the near future.
The other exports comprised on average more than 50 products out of 57 in 2004 and in other years more than 85 percent of the total number of products exported. But in terms of percentage weight in the total value of the exports they represent less than 1% of the total value of exports. What room to diversify the exports Angola has, just by increasing the intensive margin and not even touching the extensive! To increase the intensive margin of these other exports, the authorities should know exactly who are the ones that export these products, what challenges they are facing and what can be done to help them, why they do not export more quantities of these goods and so forth. Because on their own the small enterprise exporters or the small companies that export cannot or are not able to export more quantities without help (either financial or by facilitating the process of obtaining an export credit line26, either institutional by easing the bureaucracy of the institutions that deals with the exports) from the authorities.
In the chart 3 we also see that the weight of coffee in the total exports is almost zero throughout the years; this fact really saddens those who know the history of the Angolan exports. The young generation would not believe that before the independence from Portugal in 1975, for more than 20 years coffee was on the top of the main exported products and in the period of 1960 to 1973 Angola was the 4th biggest producer and exporter of coffee in the world! At that time coffee represented on average more than 30% of the total exports being the most exported product,
25
Angola LNG is a project that is being implemented in the province of Zaire and was established in 2008. According to the website of the Project, Angola LNG has the potential to produce one billion cubic feet of clean gas per day for domestic and international markets. The facility will be supplied by the over 10 trillion cubic feet of gas reserves that are available from offshore Blocks of crude oil extraction 0, 1, 2, 14, 15, 17 and 18. (http://www.angolalng.com/project/aboutLNG.htm)
26
Many countries have Export and Imports Banks that help their companies to export more and more since without Money is very hard to export products successfully and find new markets. In this regard we have the EximBank of the USA, of China and other countries.
22
followed by diamonds, cotton, sisal and agricultural products representing on average 9 to 15%27.
Angola started exporting oil in 1959; in 1960 the share of oil was 0.74% and only in 1973 the crude oil was on the top of the most exported products28, constituting 30% of the total export, whereas coffee 26%; from there on coffee almost disappeared from the commercial balance, letting crude oil and diamonds alone to dominate29.
The civil war that occurred soon after the proclamation of the independence affected dramatically the agricultural production, since farmers were destroyed and most of the arable lands were mined with the land mine. However, fortunately the war is over now and most of land mines are being cleared then this is the time to invest again in coffee and cotton production and start exporting these products again as it was before the independence. Once more, the figures of the coffee exports show us that it is indeed possible to diversify the Angolan exports by focusing not only on the extensive margin but particularly on the intensive margin, by promoting the increase of the production and exports of coffee, cotton and other agricultural products.
Now if we aggregate the exports in just two categories, as we did in the GDP, oil and non-oil exports we clearly see the highly concentration of the Angolan exports.
27
Dilolwa, Carlos Rocha, Historia Económica de Angola, Editora Nzila 2000, Pages 120-149 28
Dilolwa, Carlos Rocha, Historia Económica d Angola, Editora Nzila 2000, Page 99 29
23
Source: BNA and Alfandegas de Angola
As can be seen in the chart 4, only in 2004 and 2005 the oil export were less than 95% of the total exports but from 2006 onward the weight was more than 96% and in 2012 the weight reached 98%! As obvious the weight of the non-oil exports has been decreasing since 2004 and in 2012 was only 2%.
According to the data that we are analysing there is no evidence of export diversification process in Angola given that the oil export is getting more and more weight whereas the non-oil is decreasing. The facts are unambiguous and very clear that something must be done soon in order to free the Angolan economy from the total dependence on the crude oil, by engaging with commitment in the process of diversifying the exports.
3.3 Angola´s Main Trade Partners in the Exports
Angola has trade relationship with many countries around the world, importing30 most of the goods and services from them and exporting to them its main export products
30
We do not present the imports in this work because our focus is just on the exports. But data from National Customs Services and the Central Bank show that the main import partners are: Portugal (18%), China (11%), USA (7.6%) and others. See the Appendix page 55, table 12.
24
namely crude oil and diamonds. The main trade partners to whom Angola exports its products are presented in the chart 4.
Source: BNA and Alfandegas de Angola
As can be seen in the chart 5, since 2007 China has become the main trade partner of Angola in the exports, being the country where more than one third of crude oil is exported31; the USA is the second biggest trade partner32, followed by India, Taiwan, Canada, South Africa, Portugal, France, Holland and Spain. The other countries comprise more than 20 countries such as the UK, Sweden, Switzerland, Japan and others.
The oil exports have been concentrated on China; this makes the country depend on one or few importers which can cause troubles in the future. Diversifying the destination of exports might also be away to diversify the exports itself, since by doing so the country is promoting what it produces and attracting in this way more buyers.
31
Jensen and Paulo (2011) argued that “China is by far the largest Angola´s creditor which lent more than US$ 14,5 Billion (thousands million) up to 2011” for the process of national reconstruction that has being carried out by the government after the end of the war. As part of the guarantee of the debt, Angola and China agreed that China would have privilege on the export of the crude oil. This can be one of the reasons why China has become the main trade partner of Angola regarding the exports of oil. 32
The USA was the biggest trade partner in the exports (oil) of Angola since the Independence up to 2007
25
It is interesting to see that among the top ten there is only one African country, South Africa. Angola is a State member of the Southern African Development Community (SADC), a regional economic community comprising 15 Member States founded in 1992 which aims, among others, to promote sustainable and equitable economic growth and socio-economic development through efficient, productive systems,
deeper co-operation and integration33, and achieve economic regional integration by promoting a free regional trade. In this Community Angola is the second biggest economy after the South African economy which is the biggest economy in the region and in the continent. Congo, Zambia and Namibia (countries that share borders with Angola) are also members of this community34 and the trade between them is very low, almost zero. Then in the process of exports diversification, Angola has a regional market with more than 270 million of inhabitants where it can export its products and enhance the competiveness of its firms or companies. With the construction of the Refinery of Lobito probably the export of refined oil to the countries of the region will be more significant than what is seen today.
3.4 Export Concentration indicator (Herfindahl Index)
After observing the Angolan exports´ structure there is no doubt that its exports are concentrated on just one commodity which represents more than 95 percent of the total value of the exports. In this section we are going now to look at the exports concentration indicator (Herfindahl Index) computed by the United Nation Conference on Trade and Development for all countries members since 1995; of course our attention is on the case of Angola and some countries within the Southern African Developments Community region just to help us make some comparisons.
It is important to remember that the Herfindahl index is normalized to range between zero and one; a value close to zero implies full export diversification, whereas values close to one mean a high export concentration.
33
SADC mission statement (http://www.sadc.int/about-sadc/overview/sadc-mission/) 34
The other members are: Botswana, Lesotho, Madagascar, Malawi, Mauritius, Mozambique, Seychelles, Swaziland, Tanzania and Zimbabwe.
26
Source: UNCTAD database
Chart 6 is unambiguous about how highly concentrated the Angolan exports are, the Herfindahl index is above 0.9 very close to 1 the upper limit of concentration. It is noteworthy that from 1997 to 2001 the concentration index is lower than 0.9 and within this period in 1998 and 1999 was recorded the lowest concentration index being this 0.85. One of the reasons that might explain this fact is the higher diamond production and exports that occurred in this period and the lower crude oil production due to the intensity of the war in these years, helped decrease the exports concentration index. With the end of the civil war in April of 2002 the concentration index started to increase again reaching the value of 0.97 in 2011. During the period of peace from 2002 to 2011, only in 2007 was recorded a lower index (0.92) throughout all this period. This is not surprising since in the graph 2 we saw that in this year Angola exported the largest number of products which monetary values were higher than 100,000 USD recorded in its modern history, more than 190 different products and experienced the highest economic growth rate; of course this explains the lower concentration index in 2007.
How does Angola compare with the other countries within SADC? Chart 7 helps us answer this question. The average export concentration of SADC is about 0.435 and we selected some countries to compare with Angola.
35
This is an arimethic average that was computed by us according to the data from UNCTAD of the 14 countries member of SADC available; although there are 15 countries, we just used 14 because data for Madagascar is not available.
27 Source: UNCTADstat
Chart 7 shows that by far Angola is the country with the highest export concentration index within SADC, its index being two times higher than the average of the region. Botswana, Zambia and Mozambique also have a concentration index above the average of SADC but far from those of Angola. Namibia, Zimbabwe and South Africa36 present an index much below of the SADC´s average, meaning that these countries are the ones with more diversified exports within region. Clearly Angola can learn from them how to diversify the exports given that those countries managed to differentiate their exports.
Comparing Angola with the countries of SADC alone can be misleading since among the SADC´s countries Angola is the biggest crude oil producer. To avoid what some people might call an unfair comparison, we will now compare Angola with other African and non African countries main producers of crude oil to see how concentrated their exports are in comparison to Angola.
36
South Africa is the country with the lowest export concentration Index in the region, its concentration index being on average 0.12. This means that South Africa is the country that has more diversified exports in the region followed by Zimbabwe (0.24) and Namibia (0.27).
28 Source: UNCTADstat
Chart 8 shows us the export concentration index of the biggest African oil-producing countries, still Angola is the country with the highest export concentration although is not the biggest crude oil producer in the continent37. The average export concentration index of these countries is about 0.67 and Angola is very above of this average; Nigeria (the biggest oil producer) Libya, Sudan and Equatorial Guinea are also above the average showing that they have a high export concentration index but lower than of that of Angola. Algeria and Egypt have their export concentration index below the average; and Egypt with the average index of 0.26 is managing to reduce its concentration index particularly since 2007, whereas with other African oil-producing countries the index is increasing. Algeria is the second biggest oil producer in Africa producing more oil than Angola; even so its export concentration index is on average 0.54, much lower that of Angola (0.92 on average). The fact that not all African oil-producing countries have a high export concentration index (above 0.9), seems that high export concentration does not have to do with oil production per se, but yes it has to do with the internal economic policies and priority of its government regarding the sectors of the economy they will focus on according to their objectives and goals.
37
In 2011 Nigeria was the biggest producer with 2,4 million of barrels per day, followed by Algeria (2,07 million), then Angola the #3 (1,9 million), Libya the #4 (1,7 million), Egypt the #4 ( 662 thousand), Sudan ( 514 thousand) and Equatorial Guinea ( 322 thousand) according to Index mundi (http://www.indexmundi.com/g/r.aspx?v=88)
29
For the sake of completeness we are going also to compare the export concentration index of Angola with that of the other oil-producing countries outside of the African continent to see if they also have a very high concentration index. The chart 9 plots the export concentration index of some major oil-producing and exporting countries in the world38 along with that of Angola to see how concentrated their exports are in comparison with Angola.
Source: UNCTADstat
It is interesting to see that Angola is sharing the rank with Iraq as the oil-exporting countries with the highest export concentration index. In 1995, 1996 and 2004 Angola had the highest index whereas in the remaining years Iraq is on the top. Throughout all of this period the average index for Angola is 0.92 as for Iraq is 0.94. Saudi Arabia, Russia, Emirates, Norway and Kuwait that export more oil than Angola they all have a export concentration index lower than Angola, showing that besides oil they export others goods and services. Venezuela almost exports the same quantity of oil as Angola, but its export concentration index is much lower (0,61 on average). Just exporting a large quantity of crude oil does not necessarily imply that a country will have a high export concentration index as in the case of Angola. The world´s biggest
38
Saudi Arabia is the world Biggest oil Exporter (7,6 million barrels per day); Russia ranks the #2 exporter (5,01 million barrels per day); Iran the #4 (2,5 million b per day); United Arab Emirates the #4 ( 2,2,3 million B per day); Norway the #5 (2,1 million) Iraq the #6 (2,1 million); Kuwait the #7 (2,1 million); Venezuela the#12 (1,8million) .Angola is ranked the #13 (1,8 million).
30
exporting countries, as the chart 9 shows, do not have export concentration indexes as high as Angola has.
The year 2007 recorded a slight decrease of export concentration index of almost all oil-exporting countries except Iraq and Kuwait. In the case of Angola the decrease is really noteworthy since its line is very close of that of Iraq and in this year there is a notable gap, greater that of 2009 when all countries were affected severely the financial and economic international crisis.
Since we have seen the overview of the Angola economy with emphasis on the structure of its Gross Domestic Production and particularly on its exports, we are going to run some regressions that will help us to see what effects the Angolan export concentration has had on its GDP per capita growth, to measure what Angola can gain or is forsaking by diversifying its exports.
4. Methodology and Data Collection
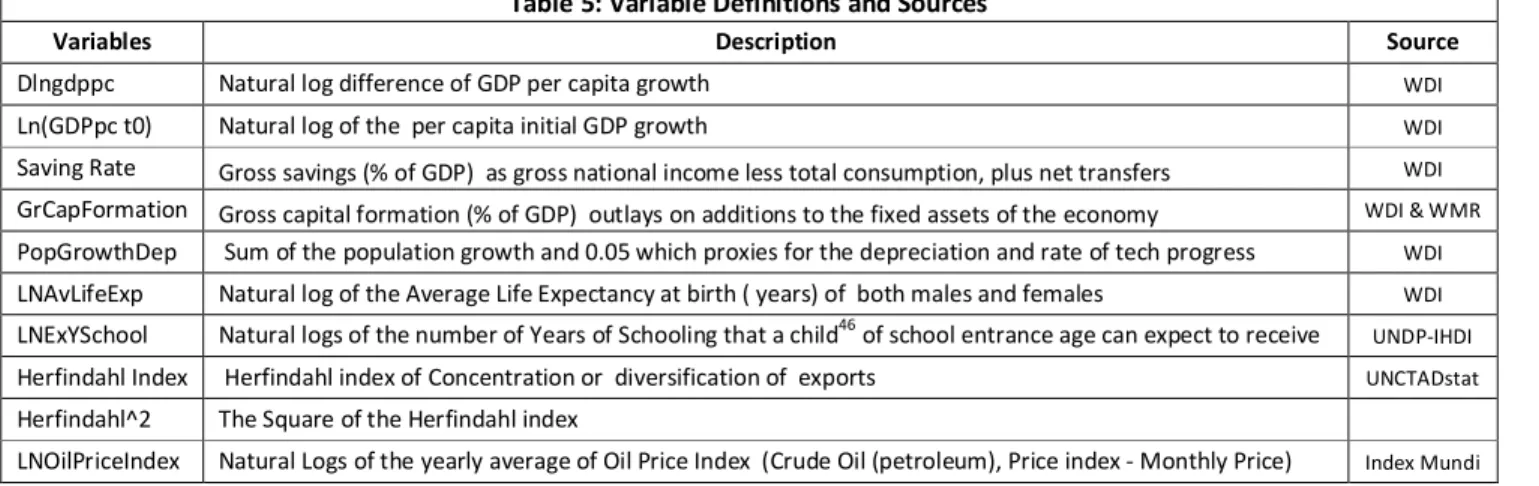
In order to measure the effect that exports concentration levels has had on the Angolan GDP per capita growth this dissertation uses an econometric approach based on Hesse’s (2008) paper on Export Diversification and Economic Growth39 using an augmented growth regression analysis. On his paper Hesse used a dataset comprising up to 99 countries excluding the eastern European countries and the oil-exporting countries (as well as Angola). The model is the following:
∆ŷ
t
= ŷ
t
0+ Χ‘
t
+ ϕF (H
t
) + ξ
t
Where:
∆ŷt denotes the log difference of income per capita in period t,
Ŷt0 the log initial income,
39
Heiko Hesse is an economist in the Global Financial Stability Division, Monetary and Capital Markets Department at the International Monetary Fund (IMF). The paper is the working paper no. 21 that he wrote on behalf of the Commission on Growth and Development of World Bank. The main variable of interested used is the export concentration index measured by the Herfindahl index and he confirmed the U shaped curve that Imbs and Wacziarg (2003) found.