UNIVERSIDADE DE LISBOA FACULDADE DE CIÊNCIAS DEPARTAMENTO DE BIOLOGIA VEGETAL
Pan-genome comparison between Streptococcus
dysgalactiae subsp. equisimilis isolates from human and
animal sources
Catarina Inês Marques de Sousa Mendes
Mestrado em Bioinformática e Biologia Computacional
Especialização em Bioinformática
Dissertação orientada por:
Professor Doutor João André Nogueira Custódio Carriço
Professor Doutor Francisco Rodrigues Pinto
Acknowledgments
First of all, I would like to thank my supervisors João Carriço and Francisco Pinto for all the support they gave me through all the work done in this thesis. I would like to specially thank João for all the encouragement and guidance, the opportunities and the invaluable advice you offered me from day one. You have set an example of excellence as a researcher and as a mentor. To all my colleagues and researchers in the Microbiology and Infection Unit group of Instituto de Medicina Molecular, a huge thank you. You all went above and beyond to welcome me and all your suggestions and contributions have been priceless. To professor Mário Ramirez, thank you for all the insightful questions, invaluable advice and the opportunities that you’ve offered me throughout this year. To Marcos, thank you for being an amazing “chefinho”, your help has been unmeasurable. To the group of sometimes annoying but all times amazing friends, Andreia, Bruno, Catarina, Miguel, Mickael, Elisia and Tânia, I don’t know what I would have done without you. You’re support, friendship and your eagerness to help, even if accompanied by some grumpiness, has made this last year one of the most fulfilling and exciting years. I know you all wanted a big thank you for each of you, all full of praise, but you can’t have everything you want in life. You’ll get spoiled otherwise!
To all my friends, I’m so grateful to be able to have so many people I can rely on that it’s impossible to enumerate them all, and for that I apologize. All of you have contributed in some way for my success and I wouldn’t have accomplished half of what I have without you in my life. Thank you. To my group of Miguels, Pedro Miguel, Filipe Miguel and Miguel Miguel, you all know I’m only this mean to you all because you’re all so annoying (and amazing)! To the Margem-Sul “crew”, Andy, Cavalo, Chá, Daniela, Flávio, Gonçalo, Neto, Pedro, Inês and Sasha, thank you for the good times and for putting up with me complaining about how hard stuff is. And finally, to Nuno, the last one of the list because you’re that important. Thank you for the valuable feedback on all sorts of question and doubts in my life, even though all of it is you telling me that I’m wrong, I know it’s all a lie.
To you, Ricardo, for being my biggest fan, the one who makes me laugh, who puts up with my neurotic drama over the tiniest things and points out how silly I am. I will never be able to thank you enough for all the love, comprehension and support you give me.
Por fim, muito obrigada a toda a minha família por todo o apoio e dedicação. Um grande obrigada aos meus avós, por todo o apoio e orgulho, aos meus pais, por me continuarem a apoiar incondicionalmente, e à minha irmã, por todo o apoio, todos os conselhos e todas as confidências. Um obrigada do tamanho do mundo.
Para a minha mãe Maria e a todo chocolate que me ofereceu depois de dias longos.
Abstract
Streptococcus dysgalactiae subsp. equisimilis (SDSE) is being increasingly reported not
only in human infections, but also colonizes various animal species, although no genomic analysis has been done to clarify the genomic identity and taxonomy of the isolates from animal origin. To assess the differences between SDSE isolates from human and animal sources, a pan-genome comparison was performed with a collection of SDSE isolates from human (n=29) and animal (n=32) sources.
The collection was de novo assembled and annotated, with quality control performed after the assembly. Three datasets where used in the pan-genome analysis, one with the 61 SDSE samples, a second with the addition of a Streptococcus dysgalactiae subsp. dysgalactiae (SDSD) genome sequence and the third with the option to not split paralogous genes. Three different clades were distinguishable in all analysis, one containing isolates recovered from human sources (n=26), other containing isolates recovered from horses (n=15), and the third clade containing isolates recovered from various hosts, including human, horse, pig, dog, chicken, fish, duck, iguana and cow. To assess if the variation detected through the pan-genomic analysis was detectable in techniques to index and catalogue strain variation, the core-genome of the 61 SDSE was studied through MultiLocus Sequence Typing (MLST) and core-genome MultiLocus Sequence Typing (cgMLST).
The exclusive accessory genome of the clades containing isolates recovered exclusively from human and horses was studies, preliminarily through clustergrams and queries done to the pan-genome obtained. Gene association studies were carried out in the pan-genome regarding the three SDSE clades, with the significantly associated genes present in at least 90% of the isolates of the human and horse clade being selected as the respective exclusive accessory genome. The exclusive accessory genome for the human clade is composed by 40 genes, changing to 45 genes when the paralogous genes are not split, and the exclusive accessory genome for the horse clade is composed by 22 genes, changing to 20 genes when the paralogous genes are not split. The gene ontology terms for the genes in the exclusive accessory genome of the two clades were retrieved. The exclusive accessory genomes for each clade were evaluated for potential virulence factors that could explain the host specificity of the clades, having found several homologous genes, recognized as virulence factors in Streptococcus pyogenes in the human SDSE clade, and diverse potential virulence factors for the horse SDSE clade.
Keywords: High Throughput Sequencing, Pan-Genome, Exclusive Accessory Genome, Gene
Resumo
Streptococcus dysgalactiae é uma bactéria gram-positiva dividida em duas subespécies: Streptococcus dysgalactiae subsp. dysgalactiae (SDSD) e Streptococcus dysgalactiae subsp. equisimilis (SDSE). São inicialmente caracterizadas por formarem colónias grandes (>0,5 mm)
quando inoculadas em meio ágar sangue, com beta-hemólise (SDSE) e alfa ou não-hemólise (SDSD), mas exceções podem ocorrer. Esta espécie pode apresentar grupo de Lancefield G e C, e mais raramente A e L. SDSE é um organismo pertencente à microflora humana e é cada vez mais reconhecida como um importante patogénico humano. Esta bactéria coloniza também diversas espécies animais, contudo nenhuma analise genómica foi ainda realizada para clarificar a identidade genómica e taxonomia das estirpes isoladas de animais.
Para melhor compreender as diferenças entre SDSE isolado de fontes humanas e animais, uma análise ao pan-genoma desta subespécie foi conduzida, tendo sido para tal utilizada uma coleção inicial de estirpes de origem humana (n=29) e animal (n=35). Das estirpes de origem humana, 16 são reads obtidas por sequenciação paired-end no sistema Illumina HISeq e as restantes 13 foram obtidas através do National Center for Biotechnology Information (NCBI) GenBank. As 35 estirpes de origem animal, incluindo cavalo, porco, cão, galinha, peixe, pato, iguana e vaca, foram obtidas por sequenciação paired-end no sistema Illumina HISeq, não estando nenhum genoma de referência disponível. As reads foram assembladas de novo, tenho o controlo de qualidade sido feito após a assemblagem. Para amostras com possível contaminação,
MultiLocus Sequence Typing com autodetecção de espécie, comparação de assinaturas genómicas
e avaliação de contaminação foram realizadas, tendo 3 amostras animais sido removidas da coleção, ficando então com 61 sequencias de SDSE, 29 de origem humana e 32 de origem animal.
Três datasets foram utilizados na análise do pan-genoma de SDSE: o primeiro contendo as 61 sequências de SDSE, o segundo com a adição de uma sequência de referência de SDSD, e o terceiro, semelhante ao primeiro, mas com a opção de não separar genes parálogos. O segundo
dataset permitiu a obtenção de árvores filogenéticas enraizadas e o terceiro a comparação do
efeito da não separação de genes parálogos nos pan-genomas obtidos. Três clados foram observados em todos os datasets utilizados: o primeiro contendo estirpes obtidas de fontes humanas (n=26), o segundo contendo estirpes recolhidas de cavalos (n=15), e o ultimo contendo estirpes recolhidas de diversas espécies animais, incluindo cavalo, porco, cão, galinha, peixe, pato, iguana, vaca e humanos.
Para aferir se a variação detetada na análise pan-genómica é também detetável em técnicas para indexar e catalogar variação entre estirpes, o genoma core das 61 estirpes de SDSE foi
estudado por MultiLocus Sequence Typing (MLST) e core-genome MultiLocus Sequence Typing (cgMLST), tendo sido realizada uma comparação do perfil alélico de cgMLST entre o clado de estirpes humanas e o clado de estirpes de cavalo. Estes métodos de tipagem são baseados na comparação de sequências de genes sendo que, em MLST são sequenciados fragmentos de 7 genes constitutivos e em cgMLST são utilizados os genes presentes em todas as estirpes da análise, ou seja, o genoma core. O esquema de MLST de SDSE é composto por 7 fragmentos génicos: atoB, gki, gtr, murI, mutS, recP e xpt. Os três clados observados previamente são bem distinguíveis por ambas as técnicas, com cgMLST oferecendo maior poder discriminatório entre estirpes do mesmo clado.
A análise do pan-genoma de SDSE deu a indicação da presença de genes exclusivos nos clados de estirpes humanas e de cavalos, podendo estes grupos possuir um genoma acessório exclusivo que possa explicar a especificidade de hospedeiro. O genoma acessório exclusivo foi primeiramente explorado por clustergramas e queries ao pan-genoma obtido, com o objetivo de obter uma indicação da dimensão e distribuição de genes para cada um dos clados.
De modo a reforçar os resultados obtidos até ao momento e a validar o estudo, uma análise estatística foi conduzida através de estudos de associação génica. Estes estudos foram conduzidos na totalidade do pan-genoma obtido para o primeiro e terceiro dataset, com e sem separação de genes parálogos, considerando a hipótese nula de os genes estarem igualmente distribuídos nos três clados. Os genes significativamente associados para os três clados e presentes em pelo menos 90% das estirpes de cada clado foram selecionados como o genoma acessório exclusivo. Dos três clados, apenas o ultimo, contendo estirpes isoladas de diversas espécies de hospedeiro, não continha uma lista significativa de genes acessórios exclusivamente associados.
Para os genes de cada genoma acessório exclusivo obtido para os clados de estirpes humanas e de cavalos, os termos de ontologia génica foram obtidos de forma a conseguir uma diferenciação de termos utilizados para descrever os genes para as analises com e sem separação de genes parálogos. Apesar de haver diferenças nos termos obtidos, os termos mais comuns utilizados são semelhantes em ambas as análises para os três campos da ontologia génica: componente celular, processo biológico e função molecular.
Os genomas acessórios exclusivos foram avaliados para potenciais fatores de virulência que possam explicar a especificação de hospedeiro para os dois grupos. Para o clado composto por estirpes de origem humana, importantes fatores de virulência foram detetados com grande semelhança com proteínas homólogas em Streoptococcus pyogenes, reconhecias como importantes fatores de virulência, nomeadamente a estreptoquinase A, a NAD glicohidrolase e a estreptolisina O, apenas observadas na análise onde os genes parálogos não foram separados, e a esterase e a internalina, encontradas em ambas as análises. Estes possíveis fatores de virulência, previamente bem caracterizados em S. pyogenes, aliado a outros eventos de recombinação
previamente observados entre as duas espécies, permitem especular que a especialização deste clado poderá ter ocorrido por eventos de recombinação com estirpes de S. pyogenes.
Para o clado de estirpes isoladas em cavalos, possíveis fatores de virulência foram também encontrados em ambas as análises. A estreptoquinase e internalina-I encontradas foram descritas na região conservada upstream do gene emm nas estirpes SDSE de origem equina. Outros possíveis fatores de virulência incluem proteínas de adesão, proteína de ligação a laminina, e uma esterase, todas com identidade significativa com proteínas homólogas em Streptococcus equi, outro organismo comensal em cavalos. A estreptodornase do tipo D, com elevada identidade com uma proteína homóloga de S. pyogenes está também presente no genoma acessório exclusivo desde clado. Estes genes poderão ter um papel na especialização deste clado em hospedeiros equinos.
Um fator importante na definição de um pan-genoma é a decisão de como analisar genes parálogos, dependendo grandemente da forma como foi implementada pelo software utilizado. Por definição, o software utilizado, chamado Roary, separa estes genes parálogos, mas é possível alterar este comportamento, passado a utilizar a vizinhança génica para manter estes genes unidos. Esta opção produziu resultados distintos para o clado de SDSE isolado de humanos, mas o mesmo não foi observado para o clado de estirpes de origem equina. A não separação destes genes parálogos pode induzir em viés, produzindo grandes regiões falsamente bem distribuídas, mas pode ser vantajoso quando existem regiões no genoma conservadas, mas variáveis.
O estudo de associações génicas é uma ferramenta poderosa, aquando associado a ao elevado número de amostras possível devido aos custos decrescentes da sequenciação de alto rendimento, para a identificação de variações genéticas, possuindo elevado poder discriminativo. Os resultados obtidos, contudo, necessitam de ser avaliados experimentalmente e uma analise mais profunda dos eventos de recombinação entre SDSE do clado humano e S. pyogenes poderá ser levada a cabo.
Palavras-chave: Sequenciação de Alto Débito, Pan-Genoma, Genoma Acessório Exclusivo,
Index
List of Figures ... XIII List of Tables ... XV Abbreviations ... XVII
Chapter 1. Introduction ... 1
1.1 Streptococcus dysgalactiae ... 1
1.2 Hight-Throughput Sequencing Technologies ... 3
1.3 The Bacterial Pan-Genome ... 4
1.1 Gene-by-Gene Based Methods ... 5
1.2 Aims and Contributions ... 7
Chapter 2. Materials and Methods ... 9
2.1 Dataset ... 9
2.1.1 Sequenced Bacterial Isolates ... 9
2.1.2 Reference Data ... 12
2.2 de novo Assembly ... 13
2.2.1 de novo Assembly Quality Assessment ... 14
2.3 Annotation ... 15
2.4 Pan-Genome Analysis ... 16
2.5 Core-genome MultiLocus Sequence Typing and MultiLocus Sequence Typing Analysis ………..18
2.6 Exclusive Accessory Genome Analysis ... 21
Chapter 3. Results ... 25
3.1 Genome Assembly and Annotation ... 25
3.1.1 Gene Alignment with Reference Genome ... 25
3.1.2 Cumulative Length and GC content plots ... 27
3.1.3 Genomic Signature Comparison and Contamination Evaluation ... 29
3.2 Pan-genome Analysis ... 31
3.2.2 Second Dataset – 61 Streptococcus dysgalactiae subsp. equisimilis isolates
and 1 Streptococcus dysgalactiae subsp. dysgalactiae isolate ... 34
3.2.3 Third Dataset – 61 Streptococcus dysgalactiae subsp. equisimilis isolates with no split paralogous genes... 38
3.3 Core-genome MultiLocus Sequence Typing and MultiLocus Sequence Typing Analysis ………..40
3.3.1 Core-genome MultiLocus Sequence Typing ... 40
3.3.2 MultiLocus Sequence Typing ... 45
3.4 Exclusive Accessory Genome ... 49
3.4.1 Gene Association Studies ... 51
3.4.2 GoFetch – Gene ID and Ontology Fetcher ... 56
Chapter 4. Discussion ... 63
Chapter 5. Conclusions ... 73
5.1 Future Work ... 75
References ... 77
Annexes... 83
Annex I. Streptococcus dysgalactiae subspecies equisimilis isolates recovered from human sources ………..83
Annex II. Streptococcus dysgalactiae subspecies equisimilis isolates recovered from animal sources ……….84
Annex III. Reference Data ... 85
Annex IV. Nx and NAx plots ... 86
Annex V. Prokka Histograms ... 87
Annex VI. MEGA7 Minimum Evolution Tree, with 500 bootstrap ... 88
Annex VII. MEGA7 Neighbor-Joining Tree, with 500 bootstrap ... 89
List of Figures
Figure 1.1 20 years of bacterial genome sequencing. ... 3 Figure 1.2 MultiLocus Sequence Typing schema for the Streptococcus dysgalactiae subsp equisimilis. ... 6 Figure 2.1 Lancefield group distribution for 51 Streptococcus dysgalactiae subsp. equisimilis isolates. ... 10 Figure 3.1 Alignment of the 51 animal and human Streptococcus dysgalactiae subsp. equisimilis isolates assembled
genomes to Streptococcus dysgalactiae subsp. equisimilis AC-2713 complete genome. ... 26
Figure 3.2 Cumulative length plot of the 51 animal and human Streptococcus dysgalactiae subsp. equisimilis isolates
assembled genomes. ... 27
Figure 3.3 GC content graph of the 51 animal and human Streptococcus dysgalactiae subsp. equisimilis isolates
assembled genomes. ... 28
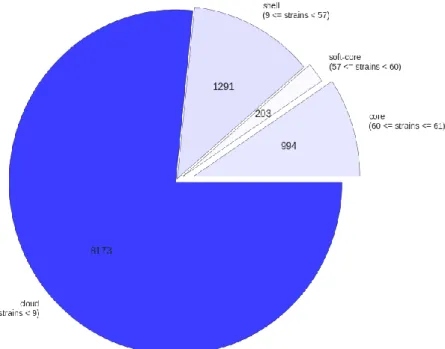
Figure 3.4 Dendogram for the comparison of oligonucleotide frequencies of the input sequences. ... 30 Figure 3.5 Pan-genome breakdown for the first Streptococcus dysgalactiae subsp. equisimilis dataset, composed by
61 SDSE isolates. ... 32
Figure 3.6 Gene variation in the Streptococcus dysgalactiae subsp. equisimilis pan-genome for the the first dataset,
composed by 61 SDSE isolates. ... 33
Figure 3.7 Total and conversed genes in the Streptococcus dysgalactiae subsp. equisimilis pan-genome for the the
first dataset, composed by 61 SDSE isolates ... 33
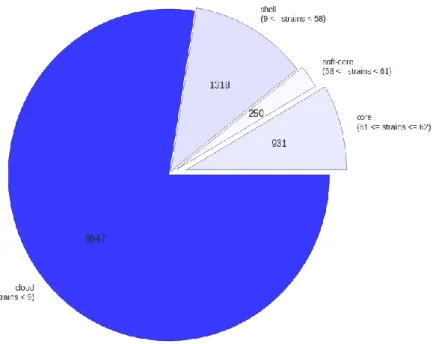
Figure 3.8 Pan-genome breakdown for the second Streptococcus dysgalactiae dataset, composed by 61 SDSE
isolates and 1 SDSD isolate. ... 34
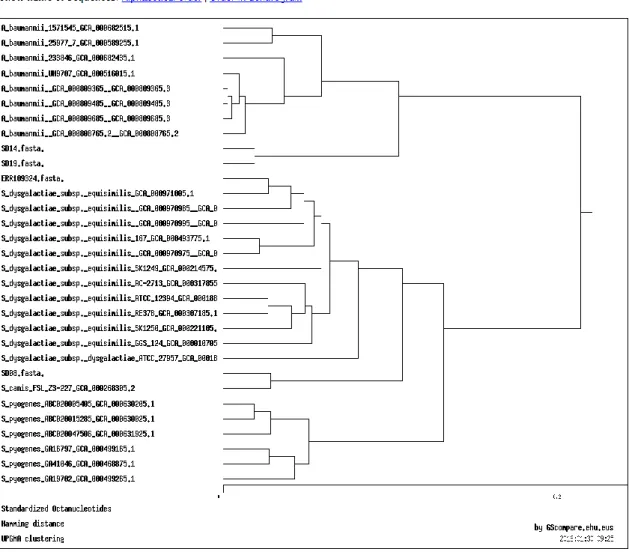
Figure 3.9 Molecular Phylogenetic analysis of 61 Streptococcus dysgalactiae subsp. equisimilis isolates and 1 Streptococcus dysgalactiae subsp. dysgalactiae isolate by Maximum Likelihood method. ... 35 Figure 3.10 Maximum likelihood tree compared to a matrix with the presence and absence of core and accessory
genes for the first dataset, composed by 61 Streptococcus dysgalactiae subsp. equisimilis isolates. ... 37
Figure 3.11 Pan-genome breakdown for the third Streptococcus dysgalactiae subsp. equisimilis dataset, composed by
61 SDSE isolates with the option to not split paralogous genes. ... 38
Figure 3.12 Maximum likelihood tree compared to a matrix with the presence and absence of core and accessory
genes for the third Streptococcus dysgalactiae subsp. equisimilis dataset, composed by 61 SDSE isolates with the option to not split paralogous genes. ... 39
Figure 3.13 Minimum spanning trees of the core-genome MuliLocus Sequence Type profile for the 61 Streptococcus dysgalactiae subsp equisimilis isolates. ... 41 Figure 3.14 Minimum spanning trees of the core-genome MuliLocus Sequence Type profile for the 61 Streptococcus dysgalactiae subsp equisimilis isolates, coloured by host... 41 Figure 3.15 Distance matrix of the core-genome MuliLocus Sequence Type profile for the 61 Streptococcus
dysgalactiae subsp equisimilis isolates, ordered according to host. ... 42 Figure 3.16 Minimum spanning trees of the core-genome MuliLocus Sequence Type profile for the 61 Streptococcus dysgalactiae subsp equisimilis isolates, coloured by host and Tree cut-off set to 818. ... 43
Figure 3.17 Minimum spanning trees of the core-genome MuliLocus Sequence Type profile for the 61 Streptococcus dysgalactiae subsp equisimilis isolates, coloured by emm-type. ... 43 Figure 3.18 Minimum spanning trees of the core-genome MuliLocus Sequence Type profile for the 61 Streptococcus dysgalactiae subsp equisimilis isolates, coloured by Lancefield group. ... 44 Figure 3.19 Minimum spanning trees of the MuliLocus Sequence Type profile for the 61 Streptococcus dysgalactiae
subsp equisimilis isolates. ... 45
Figure 3.20 Minimum spanning trees of the MuliLocus Sequence Type profile for the 61 Streptococcus dysgalactiae
subsp equisimilis isolates, coloured by host. ... 46
Figure 3.21 Distance matrix of the MuliLocus Sequence Type profile for the 61 Streptococcus dysgalactiae subsp equisimilis isolates, ordered according to host. ... 46 Figure 3.22 Minimum spanning trees of the MuliLocus Sequence Type profile for the 61 Streptococcus dysgalactiae
subsp equisimilis isolates, coloured by host and NLV set to 4 and Tree cut-off set to 6. ... 47
Figure 3.23 Minimum spanning trees of the MuliLocus Sequence Type profile profile for the 61 Streptococcus dysgalactiae subsp equisimilis isolates, coloured by emm-type. ... 48 Figure 3.24 Minimum spanning trees of the MuliLocus Sequence Type profile for the 61 Streptococcus dysgalactiae
subsp equisimilis isolates, coloured by Lancefield group. ... 48
Figure 3.25 Clustergram of the pan-genome for the 61 Streptococcus dysgalactiae subsp equisimilis isolates, for all
10661 genes and the 4000 genes with higher variance. ... 49
Figure 3.26 Wordclouds for the set of genes exclusively associated with the Streptococcus dysgalactiae subsp equisimilis isolates in the human and horse clades. ... 50 Figure 3.27 Expression wordclouds for the set of genes exclusively associated with the Streptococcus dysgalactiae
subsp equisimilis isolates in the human and horse clades. ... 51
Figure 3.28 Density scatter plot of the genes associated with the human, horse and various hosts Streptococcus dysgalactiae subsp equisimilis clades. ... 53 Figure 3.29 Density scatter plot of the genes associated with the human, horse and various hosts Streptococcus
dysgalactiae subsp equisimilis clades, without splitting paralogous genes... 55 Figure 3.30 Pie chart for the most common Gene Ontology terms associated with the human Streptococcus
dysgalactiae subsp. equisimilis clade. ... 57 Figure 3.31 Pie chart for the most common Gene Ontology terms associated with the horse Streptococcus
dysgalactiae subsp. equisimilis clade. ... 58 Figure 3.32 Pie chart for the most common Gene Ontology terms associated with the human Streptococcus
dysgalactiae subsp. equisimilis clade, without splitting paralogous genes.. ... 60 Figure 3.33 Pie chart for the most common Gene Ontology terms associated with the horse Streptococcus
List of Tables
Table 2.1 Most common emm-types for the 16 Streptococcus dysgalactiae subsp. equisimilis isolates recovered in
human infection sites. ... 10
Table 2.2 Host diversity for the Streptococcus dysgalactiae subsp. equisimilis isolates recovered from animal
sources. ... 11
Table 2.3 Most common emm-types for the 35 Streptococcus dysgalactiae subsp. equisimilis isolates recovered from
animal sources. ... 12
Table 3.1 MultiLocus Sequence Typing (MLST) for the SD14, SD19 and SD31 samples, with and without scheme
Abbreviations
BLAST – Basic Local Alignment Search Tool. BSR – BLAST Score Ratio
CDS – Coding Domain Sequence
cgMLST – Core-Genome MultiLocus Sequence Typing CGN – Conserved Gene Neighbourhood
FDR – False Discovery Rate
GWAS – Genome-Wide Association Study HTS – High Throughput Sequencing MLST - MultiLocus Sequence Typing MST – Minimum Spanning Tree
NCBI - National Center for Biotechnology Information NLV – N-Locus Variant
PCR – Polymerase Chain Reaction
SDSD - Streptococcus dysgalactiae subspecies dysgalactiae SDSE - Streptococcus dysgalactiae subspecies equisimilis SLV – Single Locus Variant
STSS - Streptococcal Toxic Shock Syndrome
Chapter 1. Introduction
1.1 Streptococcus dysgalactiae
Streptococcus dysgalactiae are gram-positive bacteria divided in two subspecies: Streptococcus dysgalactiae subspecies equisimilis (SDSE) and Streptococcus dysgalactiae subspecies dysgalactiae
(SDSD). It was formally proposed as a species in 1984 by Farrow and Collins, englobing a heterogeneous group of streptococci associated with human and animal infections, accommodating S.
dysgalactiae, S. equisimilis and streptococci of Lancefield serological groups C G and L, under the name
of S. dysgalactiae (Farrow and Collins, 1984; Vieira et al., 1998). In 1996, Vandamme et al proposed the division of S. dysgalactiae in two subspecies, SDSE for human strains of Lancefield groups C and G, and SDSD for all strains of animal origin (Vandamme et al., 1996). Currently, the most common classification states that the beta-haemolytic Lancefield group G and C, and more rarely group A and L, streptococci are currently grouped under SDSE, from both animal and human origins. Animal origin group C streptococci are under SDSD (Brandt and Spellerberg, 2009; Facklam, 2002; Vieira et al., 1998). However, the genetic relationship between S. dysgalactiae isolates from human and animal origins remains controversial.
These streptococci can be initially characterized as forming large colonies (>0.5 mm in diameter), with beta-haemolysis (SDSE) and alpha or no-haemolysis (SDSD) when grown in blood agar plates (Brandt and Spellerberg, 2009), although exceptions may occur (Abdelsalam et al., 2013). Besides haemolysis and Lancefield groups, the two subspecies are not easily separated by standard methods, but have been differentiated on the basis of a set of biochemical tests (Facklam, 2002; Rantala, 2014; Vieira et al., 1998)
SDSE is a human commensal organism and a pathogen, usually colonizing the human upper respiratory, gastrointestinal, and female genital tracks, and the skin (Brandt and Spellerberg, 2009; Rantala, 2014). This subspecies was considered non-pathogenic for many years, but it’s now recognized as an important and emerging bacterial pathogen in humans, responsible for a variety of superficial, deep, toxin-mediated, or immunologically mediated diseases that range from harmless superficial skin infections to life-threatening streptococcal toxic shock-like syndromes (Brandt and Spellerberg, 2009; Rantala, 2014; Vasi et al., 2000). Sites of colonization and focal infections are principal reservoirs for transmission and infections are transmitted from person to person and, as has a clinical picture similar to with Streptococcus pyogenes, also known as group A streptococci (GAS), an important gram positive
Chapter 1. Introduction
bacterial pathogen, responsible for a variety of human diseases that range from superficial infections of the respiratory tract and skin to severe invasive infections associated with high morbidity and mortality, like streptococcal toxic shock syndrome (STSS) (Cole et al., 2011; Cunningham, 2000). SDSE has virulence factors similar to those of the S. pyogenes, including the M and M-like proteins (Brandt and Spellerberg, 2009; Rantala, 2014).
Beta-hemolytic S. dysgalactiae strains have been isolated from a wide range of animal hosts, including companion animals, livestock (such as horses, pigs, sheep and cows) and wild animals (Pinho et al., 2016; Vieira et al., 1998). In horses, they have been reported as being part of the microbiota of the skin and mucosal surfaces (Timoney, 2004), as in other animal species, with isolations being made from genital tract, including aborted placentas and fetuses; abscessed lymph nodes and respiratory tract, having been associated with cases of strangles-like disease (Erol et al., 2012; Laus et al., 2007; Timoney, 2004)
One of the most common ways of typing not only group A streptococci, but also beta hemolytic groups C, G, and L streptococci, is through emm typing, a technique that relies upon the use of the two highly conserved primers to amplify a large portion of the emm gene. The M-protein, encoded by the
emm gene, is a major virulence factor of S. pyogenes, confers resistance to phagocytosis and mediating
adherence to and internalization into human epithelial cells, interferes with the coagulation system and inhibits the complement cascade (Fischetti, 1989). The emm gene has been suggested to be part of a 47-kilobases pathogenicity island, of assumed ancient origin, due to its presence in all currently genome sequenced strains of S. pyogenes (Panchaud et al., 2009). Significant interspecies recombination between S. pyogenes and SDSE has been reported (Ahmad et al., 2009; McMillan et al., 2010), with evidence that subsets of this pathogenicity island comprising several contiguous genes, including the
emm gene, are present in SDSE (Suzuki et al., 2011). Based on the variability of the N-terminal end of
the emm gene, encoding the M protein, approximately 80 emm types have, thus far, been recognized by the Centers for Disease Control and Prevention1 (CDC) for SDSE.
For SDSE, 5 complete genome sequences are available in National Center for Biotechnology Information (NCBI) GenBank2 (detailed descriptions available in page 12, 2.1.2 Reference Data), all from isolates recovered from human infections between 1939 and 2007 (Watanabe et al., 2013).
1 http://www.cdc.gov/streplab/index.html;
ftp://ftp.cdc.gov/pub/infectious_diseases/biotech/emmsequ/ 2 http://www.ncbi.nlm.nih.gov/genome/genomes/823
Chapter 1. Introduction
1.2 Hight-Throughput Sequencing Technologies
Since the first complete genome sequencing of first microorganism, a non-pathogenic Haemofilus
influenzae in 1995 (Fleischmann et al., 1995), the field of microbial bioinformatics, with the adoption
of genome sequencing as a routine approach, has emerged as a distinctive discipline (Pallen, 2016). Most of the progress done in this field of expertise has been possible due to the advances in DNA sequencing, revolutionizing the fields of genomics, making it possible to generate large amounts of sequence data very rapidly and at a substantially lower cost in comparison to the first whole-genome Sanger sequencing by synthesis technologies (Kircher and Kelso, 2010; Loman and Pallen, 2015; Reuter et al., 2015).
Figure 1.1 20 years of bacterial genome sequencing. Three revolutions in sequencing technology since its primordial times in early nineties, with the older Sanger dideoxy chain termination whole-genome shotgun sequencing, high- throughput sequencing, from the early two thousands, and single-molecule long-read sequencing, having emerged in the last decade. Image reproduced from Loman and Pallen, 2015.
With the appearance of high-throughput sequencing technologies, capable of out- performing the older Sanger dideoxy chain termination sequencing technologies by a factor of 100–1,000 in daily throughput, and at the same time reduce the cost of sequencing one million nucleotides (1 Mb) to 4– 0.1% (Kircher and Kelso, 2010), the comparative genomic analysis between multiple genomes of individual species for in depth study of intra-species diversity was possible to be performed (Rouli et al., 2015; Tettelin et al., 2008), allowing the comparison of pathogens genomes specifically adapted to a particular diseases or hosts. These technologies do not generate complete genome sequences, rather producing megabases of genomic information as small DNA fragments, named reads, usually from 90
Chapter 1. Introduction
to 250 base-pairs depending on the technology used, that are then assembled either by mapping to a reference or by de novo assembly into larger sequences using specific software, forming contigs. These
contigs can then be used to define scaffolds if a paired-end/mate-pair approach is used.
Although the throughput and quality of data produced by current technologies are substantial, they come with tremendous bioinformatics challenges, for example, the large amount of data that must be collected, stored and analysed and the sequence assembly (Schloss, 2008).
These high-throughput sequencing technologies (Figure 1.1), composed firstly by the 454 pyrosequencing system, developed by Roche/454 Life Sciences and released in October 2005, and then by Illumina system by Illumina/Solexa in 2007, that then progressed to benchtop systems by 2012, are proficient at sequencing genomic content with high accuracy, with the withdraw of producing short read lengths (Kircher and Kelso, 2010; Loman and Pallen, 2015).
More recently, new technologies based on single-molecule templates have emerged, like Pac Bio single-molecule real-time (SMRT) sequencing in 2010 by Pacific Biosciences, and Oxford Nanopore sequencing in 2015 by Oxford Nanopore Technologies (Reuter et al., 2015). These are capable of producing long read lengths, at the cost of having lower accuracy, in comparison to the other older technologies, without having the necessity of preparing a library prior to sequencing (Loman and Pallen, 2015; Reuter et al., 2015). It revolutionises the industry as it allows for the data from sequencing to be obtained in real time, generating reference quality genome sequences, albeit at a higher cost (Loman and Pallen, 2015).
These advances in DNA sequencing have revolutionized the fields of genomics, making it possible for even single research groups to generate large amounts of sequence data very rapidly and at a substantially lower cost, greatly increasing our ability to sequence microbial genomes, both in quality and in quantity (Kircher and Kelso, 2010; Pallen, 2016; Reuter et al., 2015). This implies that for each study it is possible to sequence dozens or hundreds of isolates, bringing forth the ability to study the population structure of a species at genomic level, namely by performing pan-genome analysis.
1.3 The Bacterial Pan-Genome
The concept of pan-genome was firstly introduced in 2005, defined by sum of a “core genome”, containing genes present in all strains, and a “dispensable or accessory genome” containing genes present in two or more strains and genes unique to single strains, hence, core and accessory genes represent the essence and the diversity of the species, respectively (Medini et al., 2005; Tettelin et al., 2005). The presence of a set of accessory genomes in all isolates from certain group or clade of isolates can defined as the exclusive accessory genome for that clade, and, for pathogenic bacteria, may contain virulence factors and other genes that gives selective advantages such as adaptation to different niches, antibiotic resistance or colonization.
Chapter 1. Introduction
A pan-genome can also be defined as open or closed and it’s closely linked to the lifestyle of the studied bacterial species: allopatric species that live isolated in a narrow niche usually have a small genome and a closed pan-genome, mostly due to specialization, whereas sympatric species, living in a community, tend to have large genomes and an open genome (Rouli et al., 2015). An open pan-genome is typical of species that colonize multiple environments and have multiple ways of exchanging genetic material (Medini et al., 2005).
The study of a species pan-genome offers a rather wide panel of possibilities like predicting the allopatric or sympatric nature of a bacterium (open or closed pan-genome), precisely determining the genomic contents of s groups like the identification of genomic variants and gene presence/absence of virulence factors, and can even represent a new approach to species definition (Rouli et al., 2015). The core genome can also be used to create a phylogenetic tree and could provide much more information than a tree based on only one gene or whole ribosomal protein-encoding genes is too simplistic and not representative of reality (Rouli et al., 2015).
The construction of a pan-genome is a computationally complex problem, with the limiting step being the necessary all-against-all comparison of all genes present in all isolates of the analysis. Additional difficulties may arise due to contamination, fragmented assemblies and poor annotation, therefore, heuristics must be employed for the production of a pan-genome analysis (Nguyen et al., 2015; Page et al., 2015)
There are several dedicated bioinformatics tools for the pan-genome analysis like PANOCT (pan-genome orthologue clustering tool), which uses conserved gene neighbourhood information to separate recently diverged paralogous into orthologous clusters, and PGAP (pan-genome analysis pipeline) that takes the annotated assemblies, clusters the results and produces a pan-genome with only one command (Fouts et al., 2012; Zhao et al., 2012). Both these tools require an all-against-all comparison using BLAST, with the running time growing approximately quadratically as these exhaustive pairwise sequence comparison can become a bottleneck, thus limiting the number of genomes that can be simultaneously analyzed (Page et al., 2015; Wittwer et al., 2014).
The tool selected for the pan-genome analysis for SDSE was Roary (Page et al., 2015) and its algorithm is described in page 16, 2.4 Pan-Genome Analysis.
1.1 Gene-by-Gene Based Methods
Traditional characterization of SDSE population structure was performed MultiLocus Sequence Typing (MLST), a nucleotide sequence-based typing method that uses a defined scheme of typically 7 core housekeeping gene fragments, approximately 400 to 600 base-pairs in length, to characterize genetic relationships between isolates of the same species (Maiden, 2006; Maiden et al., 1998). For each locus in the scheme, each allele fragment is assigned a unique number in order of discovery, therefore,
Chapter 1. Introduction
a code made up of number for each of the loci included in the scheme is assembled, providing the isolate analysed an allelic profile or sequence type (ST). The schemes for a diversity of pathogenic and non-pathogenic bacteria are freely accessible in curated databases of nucleotide sequence data3. It’s a robust, portable and unified method for characterizing isolates at a molecular level, that can be used for evolutionary and population studies, regardless of the diversity, population structure and evolution of the bacteria in study (Maiden, 2006), .
A scheme for SDSE, containing seven housekeeping gene fragments, is available4 (Figure 1.2).
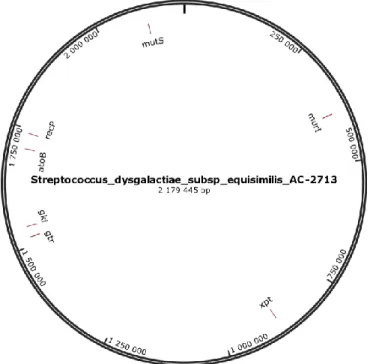
Figure 1.2 MultiLocus Sequence Typing schema for the Streptococcus dysgalactiae subsp equisimilis. The 7 schema alleles (atoB, gki, gtr, murI, mutS, recP and xpt) were aligned with the Streptococcus dysgalactiae subsp equisimilis AC-2713 complete reference genome using Burrows-Wheeler Aligner (BWA) (Li and Durbin, 2009) though Geneious 8 (Kearse et al., 2012). The representative image of the alignment was obtained through SnapGene Viewer (from GSL Biotech; available at http://snapgene.com).
The usual 7 genes present in the MLST schemes don’t offer enough resolution to perform high resolution typing. It has been shown by Medini et al that serotyping and MultiLocus Sequence Typing (MLST) sequence-types (ST) do not segregate with the comparison of the whole genome sequences, as often isolates belonging to different serogroups are more closely related than are isolates of the same serogroup due to events of capsular transformation, and that strains of the same sequence type can be genetically very distant (Medini et al., 2005). Furthermore, for population studies, further information could be gained by complete gene comparison since they are more likely to be the units of selection (Maiden, 2006).
3 http://pubmlst.org/ 4 http://sdse.mlst.net/
Chapter 1. Introduction
With current high-throughput sequencing technologies, providing high quality data for bacterial isolates in a single experiment, a new MLST-like gene-by-gene approach to the de novo-assembled genomes has emerged. This approach is inherently hierarchical and scalable, allowing the adjustment of the number of genes being used to create the allelic profiles according to the level of resolution desired (Maiden et al., 2013).
Core genome MultiLocus sequence typing (cgMLST) has the same basic principle as MLST but doing a gene-by-gene allelic profiling of core genome genes in a set of same species isolates (Maiden et al., 2013; Ruppitsch et al., 2015). This process is described in page 18, 2.5 Core-genome MultiLocus Sequence Typing and MultiLocus Sequence Typing Analysis. The cgMLST can provide high-resolution data across a group of related but not identical isolates and is the most promising typing method for extensive phylogenetic studies but still is incapable of picking up similarities present in the dispensable genome, which often are linked to pathogenic features (Glaeser and Kämpfer, 2015; Maiden et al., 2013; Medini et al., 2005)
1.2 Aims and Contributions
Streptococcus dysgalactiae subsp. equisimilis (SDSE) is being increasingly reported in human
infections (de Souza et al., 2016; Halperin et al., 2016; Rantala, 2014; Wajima et al., 2016) although strains in other animal species have not yet been well characterized. No genome sequences of SDSE isolates of animal origin were available prior to this work. Genomic analysis is fundamental to clarify the genomic identity and taxonomy of the isolates from animal origin.
To access the differences between SDSE isolates from human and animal sources, a pan-genome comparison was performed. Consequently, in this study, the main specific goals were the following:
Assembly, validation and annotation of SDSE genomes of a dataset composed by isolates of both animal and human origins
Determination of the core and accessory genome, with special emphasis on the exclusive accessory genome of isolates recovered from humans and other animal sources
Determination in silico of core genome MultiLocus Sequence Typing (cgMLST) and MultiLocus Sequence Typing (MLST)
Construction of a library of scripts in python and R, allowing the automatization and reproducibility of the analysis
This study will be conducted on a dataset containing 29 human SDSE samples, 18 SDSE samples recovered from horses, and 13 SDSE isolates recovered from other animal sources.
The implementation of the study was conducted by me, following the design and guidance of advisors and laboratory colleagues at the Molecular Microbiology and Infection group coordinated by Dr. Mário Ramirez, in Instituto de Medicina Molecular (Lisboa, Portugal). Laboratorial characterization
Chapter 1. Introduction
of the bacterial isolates, including phenotypic (hemolysis, Lancefield group) and genotypic methodologies (emm typing) were performed by Dr. Marcos D. Pinho.
I have also contributed to some open-source projects along my project development, notably, to the Scoary5, microbial pan-genome wide association studies software, related to the adjusted p-values and isolate restriction, and PHYLOViZ online6 (Ribeiro-Gonçalves et al., 2016), beta testing the website and providing suggestions for its development.
Part of this study and contributions are featured in the article “Beta-hemolytic Streptococcus
dysgalactiae strains isolated from horses are a genetically distinct population within the Streptococcus dysgalactiae taxon” (Pinho et al., 2016), mainly in the assembly and annotation of 14 SDSE genomes
recovered from horses to be used in the calculation of average nucleotide identity (ANI) (Konstantinidis and Tiedje, 2005) analysis, the analysis of the core genome of the horse (n=14) and human (n=13) SDSE isolates and confirmation of virulence gene presence through BLAST. The whole genome sequences of
S. dysgalactiae horse isolates were submitted to NCBI under BioProject number PRJNA321465.
5 https://github.com/AdmiralenOla/Scoary 6https://online.phyloviz.net/
Chapter 2. Materials and Methods
With the aim to provide easy access and reproducibility to the analysis, all scripts developed, both in python and R languages, are available online in GitHub (https://github.com/cimendes/
)
. The various results and reports obtained throughout the study are also available online, through private but sharable links, if the length of the file is not easily manageable and/or if the human readability of the file is limited. All files are hosted in a private figshare account (https://figshare.com) and shared through bit.do (http://bit.do/), a permanent URL shortener service with custom domain name, providing easier readability of the document.2.1 Dataset
With the purpose of establishing a diverse collection, the initial dataset consisted of 51
Streptococcus dysgalactiae subsp. equisimilis (SDSE) genome raw-reads, consisting of 16 isolates from
human sources and 35 isolates from animal origin. The isolates were selected for sequencing based on the diversity of emm types, for isolates from human origin, and host species, for isolates from animal origin. The genomes were sequenced in an Illumina HiSeq system, through paired-end whole genome shotgun sequencing and the reads obtained were pre-filtered for adapters.
2.1.1 Sequenced Bacterial Isolates
A total of 51 bacterial isolates were sequenced, separated into a collection of 35 isolates from animal sources and 16 isolates from human sources.
The isolates were previously identified as SDSE through Lancefield grouping, haemolysis identification and MultiLocus Sequence Typing (MLST), described in more detail by Pinho et al (Pinho et al., 2016).
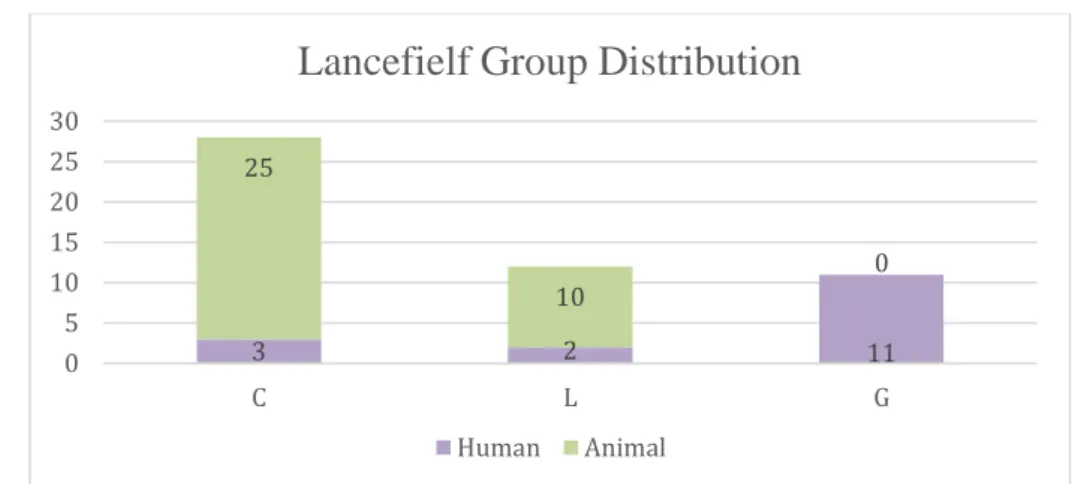
All isolates showed beta-haemolysis (n=49) with the exception of two, SD01 and SD14, from the animal collection, who showed gama-haemolysis. The majority of the isolates from human origin presented Lancefield group G (n=11), with group C (n=3) and L (n=2) also being present whereas the isolates from animal origin present only Lancefield group C (n=25) and L (n=10) (Figure 2.1).
Chapter 2. Materials and Methods
Figure 2.1 Lancefield group distribution for 51 Streptococcus dysgalactiae subsp. equisimilis isolates. The isolates recovered from human hosts show Lancefield group G (n=11), C (n=3) and L (n=2), and the isolates recovered from animal hosts present Lancefield group C (n=25) and L (n=10).
Isolates from Human Origin
The 16 SDSE isolates, recovered from human hosts, were collected between the years of 1998 and 2009, in various Portuguese hospitals: 10 isolates recovered in Hospital Santa Maria from the years of 1998 to 2009, 3 isolates recovered from Hospital Sao Pedro Hispano from 2003 to 2009, 1 isolate from Hospital de Vila Real in 2004, 1 isolate Hospital Sao Francisco Xavier in 2003, and another isolate recovered from Hospital Garcia de Horta in 2003. A full description of the isolates can be found in Annex I. Most of the isolates were associated with noninvasive infections, being recovered from skin and soft tissue (n=8) and respiratory tract (n=5). In invasive infections, 3 isolates were recovered from blood. Emm-type characterization of the 16 isolates from human origin was carried out7 and all isolates
showed amplification in the polymerase chain reaction (PCR), being the emm-type stG2078 the most common (Table 2.1).
Table 2.1 Most common emm-types for the 16 Streptococcus dysgalactiae subsp. equisimilis isolates recovered in human
infection sites. emm-types are presented by decreasing order of frequency; Other emm-types found present in only one isolate
(emm57, stC36, stG10, stG245, stG480, stG485, stG643, stG6792, stL2764)
emm type Number of isolates
stG2078 3 stC839 2 stL1376 2 Other 9 Total 16
7 The primers and conditions are available at https://www.cdc.gov/streolab/protocol-emm-type.html, as described by Pinho et al (Pinho et al., 2006)
3 2 11 25 10 0 0 5 10 15 20 25 30 C L G
Lancefielf Group Distribution
Chapter 2. Materials and Methods
Isolates from Animal Origin
A total of 35 SDSE isolates from animal sources were sequenced. A full description of the isolates can be found in Annex II.
Table 2.2 Host diversity for the Streptococcus dysgalactiae subsp. equisimilis isolates recovered from animal sources. A collection of 35 isolates was obtained, composed by 18 isolates from horse, 6 isolates from pigs, 4 isolates from dogs, 2 isolates from cows, 2 isolates from chickens, 1 isolate from a duck, 1 isolate from a fish and 1 isolate from an iguana. The isolates’ origin is indicated for each host species.
Host
Number of
isolates Origin
Chicken 2 BCCM/LMG collection (Gent, Belgium)
Cow 2 BCCM/LMG collection (Gent, Belgium)
Dog 4 Freie Universitat (Berlin, Germany) (n=1)
Faculdade de Medicina Veterinária (Lisboa, Portugal) (n=3)
Duck 1 Freie Universitat (Berlin, Germany)
Fish 1 University of Miyazaki (Miyazaki, Japan)
Horse 18 University of Kentucky (United States) (n=12) BCCM/LMG collection (Gent, Belgium) (n=5) Freie Universitat (Berlin, Germany) (n=1)
Iguana 1 BCCM/LMG collection (Gent, Belgium)
Pig 6 Freie Universitat (Berlin, Germany) (n=2)
BCCM/LMG collection (Gent, Belgium) (n=4) The isolates were recovered in various locations round the globe (Table 2.2). From University of Kentucky (United States) 12 horse isolates were recovered, between 1982 and 2011. 14 isolates came from BCCM/LMG collection (Gent, Belgium), 5 recovered from horses, 4 recovered from pigs, 2 recovered from chicken, 2 recovered from cows and 1 recovered from an iguana, between 1994 and 2009, but one of the pig isolates and one of the cow isolates were removed from the dataset. From Freie Universitat (Berlin, Germany) 5 isolates were recovered, 2 from pigs, 1 from a dog, 1 from a duck and 1 from a horse, between the years of 2002 and 2008. From Faculdade de Medicina Veterinária (Lisboa, Portugal) 3 dog isolates were recovered, from 2004 to 200. One fish isolate was recovered in the University of Miyazaki (Miyazaki, Japan).
Of the isolates with known source, most were associated with infections of the reproductive tract, being recovered from uterine (n=8), foetal/placenta (n=2) and vaginal specimens (n=1). Other sources include the respiratory tract (n=5) and skin and soft tissue (n=7).
Chapter 2. Materials and Methods
As done for the human origin isolates, the emm-type characterization of the 35 SDSE isolates from animal sources was carried out8 (Table 2.3) and, unlike the human group, only 57,1% (n=20) of the isolates could be amplified by PCR, being the rest classified as non-typable. The most common emm-type is stL1929 (n=3).
Table 2.3 Most common emm-types for the 35 Streptococcus dysgalactiae subsp. equisimilis isolates recovered from
animal sources. emm-types are presented by decreasing order of frequency; Nt non-typable; Other emm-types found present
in only one isolate (stC1, stC14, stG14, stG16, stG17, stG2574, stG5063).
emm type Number of Isolates
stL1929 3 stC12 2 stC210 2 stC37 2 stL1376 2 stL2764 2 Nt 15 Other 7 Total 35
2.1.2 Reference Data
A total of 13 SDSE reference genomes were added to the dataset, retrieved from National Center for Biotechnology Information (NCBI) GenBank9 including 5 complete sequences and 8 assembled
sequences. The complete genome of a bovine Streptococcus dysgalactiae subsp. dysgalactiae (SDSD) ATCC 2795710, also from GenBank, was also obtained for comparison purposes, along with
Streptococcus canis FSL 23-22711 representative genome, 8 Acinetobacter baumannii reference
genomes12 and 6 Streptococcus pyogenes reference genomes13. The full details can be seen in Annex
III.
8 the primers and conditions available at https://www.cdc.gov/streolab/protocol-emm-type.html, as described by Pinho et al (Pinho et al., 2006)
9 http://www.ncbi.nlm.nih.gov/genome/genomes/823
10 http://www.ncbi.nlm.nih.gov/genome/823?genome_assembly_id=169239 11 http://www.ncbi.nlm.nih.gov/genome/11108?genome_assembly_id=173518 12 http://www.ncbi.nlm.nih.gov/genome/genomes/403
Chapter 2. Materials and Methods
2.2 de novo Assembly
The de novo assembly of the collection of 51 animal and human paired-end reads was performed with SPAdes, version 3.6.1, that can be found in St. Petersburg Academic University of the Russian Academy of Sciences’ Algorithmic Biology Lab website (http://bioinf.spbau.ru/spades). SPAdes is an open source genome assembler for both single-cell and standard (multicell) bacterial datasets, supporting paired-end reads, mate-pairs and unpaired reads from Illumina or IonTorrent systems. SPAdes is also capable of providing hybrid assemblies using PacBio, Oxford Nanopore and Sanger reads and additional contigs can also be provided so that they can be used as long reads (Bankevich et al., 2012).
SPAdes runs in four stages: the first stage is the construction of assembly graph with the use of a multisized de Bruijin graph; then the distance between the mers in the genome is estimated, called
k-bimer adjustment; the third stage is the construction of the paired assembly graphs; and finally the contigs are constructed in the final phase.
SPAdes outperforms popular assemblers like Velvet and SoapDeNovo both on the number of
contigs generated and the total length of the assembly, with the drawback that SPAdes was initially
designed for small genomes, like bacterial and fungal data, and is not intended for larger genomes. For the collection of 35 animal and 13 human SDSE paired-end Illumina raw reads, a Python script, named easySPADEs, for the automatic assembly of all the paired-reads was developed and it’s available in a GitHub repository (https://github.com/cimendes/easySPAdes). EasySPAdes takes as input the path to directory with the paired-end read folders separated by sample, saving SPAdes assembly output in a new assembly folder in current directory, separating each genome assembly into different folders. It only requires SPAdes to be installed and SPAdes installation directory to added to the PATH variable. SPAdes is called for paired-end reads (forward and reverse) with the careful flag.
SPAdes takes into consideration the read quality and performs read correction with BayesHammer14 (Nikolenko et al., 2013), a read error correction tool for Illumina reads, using Bayesian sub-clustering to correct sequencing reads. The careful option uses MismatchCorrector, a tool which improves mismatch and short indel rates in resulting contigs and scaffolds, with the use of the Burrows-Wheeler Aligner tool15 (Li and Durbin, 2009) for mapping the reads back to the assembly and correcting the assembly.
14 http://bioinf.spbau.ru/spades/bayeshammer 15 http://bio-bwa.sourceforge.net/
Chapter 2. Materials and Methods
2.2.1 de novo Assembly Quality Assessment
The quality assessment of de novo assembly was performed with QUAST: Quality Assessment
Tool for Genome Assemblies, version 3.1. Another open source software developed by St. Petersburg
Academic University of the Russian Academy of Sciences’ Algorithmic Biology Lab and available online (http://bioinf.spbau.ru/en/quast). QUAST evaluates genome assemblies by computing various existing metrics from other software, as well as extending these with new metrics, evaluating assemblies both with and without a reference genome (Gurevich et al., 2013). QUAST uses the Nucmer aligner from MUMmer (Kurtz et al., 2004) to align assemblies to a reference genome and evaluate metrics depending on alignments, producing many reports, summary tables and plots, allowing the evaluation of contig sizes, misassemblies and genome representation, as well as permitting the easy visualization of the information, allowing for the comparison of several assemblies within the dataset and with the reference genome.
QUAST performs a gene alignment with the reference genome provided and compares the positions of aligned contigs. When the genome aligns with the reference, the contigs that align correctly are coloured blue if the boundaries agree (within 2000bp on each side) in at least half of the assemblies, and green otherwise. Contigs with misassemblies are broken into blocks and coloured orange if the boundaries agree in at least half of the assemblies, and red otherwise. Contigs are staggered vertically and are shown in different shades of their colour to distinguish the separate contigs.
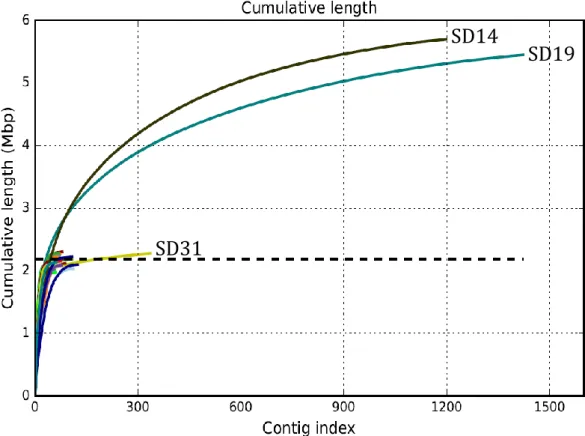
In the cumulative length plot provided by QUAST, the contigs are ordered from largest to smallest (in number of bases). It shows the number of bases in the first x contigs, as x varies from zero to the number of contigs. The cumulative length for the reference genome is marked with a dashed line.
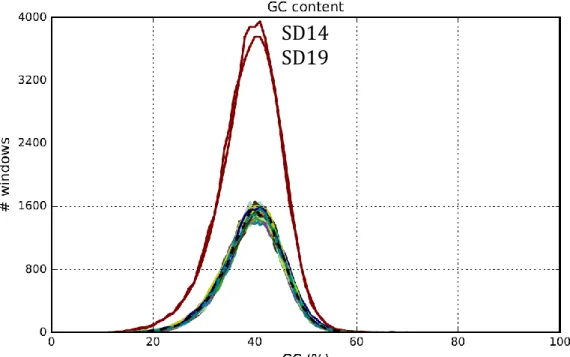
The GC content plot shows the distribution of GC content in the contigs, showing in the x value the percent of GC (from 0 to 100). The y value shows the number of non-overlapping 100bp windows whose GC content is x. This distribution is often Gaussian (Bohlin et al., 2010); however, if there are contaminants there will often be a superposition of multiple Gaussians.
To evaluate contig sizes, QUAST provides a Nx plot, showing the length for which the largest
contig lenght covers at least x % of an assembly, as x varies from 0 to 100. The NAx plot, where A
stands for aligned, is a combination of the Nx metric with the alignment to the reference provided, but in this case aligned blocks instead of contigs are considered.
As done with the assembly, a Python script, named quickQUAST, for the automatic quality assessment of collection of the 51 SDSE assemblies was developed and it’s available in a GitHub repository (https://github.com/cimendes/quickQuast). It requires the path to the directory of QUAST installation, the path to the directory containing the separate folders for each assembly in the collection and a reference genome to be used. For the assembly collection, the SDSE AC-2713 complete
Chapter 2. Materials and Methods
genome was used as reference and it’s available in NCBI’s GenBank16. QuickQUAST calls QUAST for all the assemblies present on the directory provided, as well as the reference genome file, saving the reports in the designated output directory, allowing for global assessment of the assembly quality and the comparison of different assemblies with the each other and with the reference provided.
For some of the samples that not passed the quality assessment, GScompare was used to perform an exploratory analysis, comparing these to reference genomes and another assembled genome with good results in the quality evaluation. GScompare is a web-based tool (http://gscompare.ehu.eus) for the comparison of oligonucleotide-based genomic signatures among sequences, comparing oligonucleotide composition of sequences by computing the Genomic Signature Distance, accessing the over or under-representation of oligonucleotides in the studied sequences. The type of frequency chosen was “Standardized Octanucleotides”, the statistical procedure was “Hamming distance” and the clustering method was “UPGMA”.
To check for contamination on samples with abnormal sequence length, Kraken (Wood and Salzberg, 2014) was used on the sample’s raw reads. Kraken is a tool for assigning taxonomic labels to short DNA sequences by utilizing exact alignments of k-mers and a novel classification algorithm. Its high speed and accuracy are achievable through the use of short exact alignments, allowing for the identification of contaminant sequences rapidly. The analysis was performed with MiniKraken DataBase, a pre-built 4 GB database constructed from complete bacterial, archaeal, and viral genomes in RefSeq17 as of December 8, 2014. Kraken produces a report, with one line per taxon, with information on the percentage of reads covered by the clade rooted at this taxon, the number of reads covered by the clade rooted at this taxon, the number of reads assigned directly to this taxon, a rank code, the NCBI taxonomy ID and the indented scientific name, indented according to the tree structure specified by the taxonomy.
To easily clean the contigs in an assembly file, a python script was developed, called
cleanSPAdesContigs, and it’s available in a GitHub repository
(https://github.com/cimendes/cleanSPAdesContigs). In the script, all contigs in an assembly file with a length smaller than 200 base-pairs or with coverage smaller than 10 times are removed, giving information of the size of all DNA fragments removed.
2.3 Annotation
The tool chosen for annotation of the complete dataset, including the 48 assembled contigs, 5 complete reference sequences and 8 reference assembled genomes, was Prokka (Seemann, 2014), an open source command line software, version 1.11, that coordinates a suite of existing software tools to
16 http://www.ncbi.nlm.nih.gov/genome/823?genome_assembly_id=169237 17 http://www.ncbi.nlm.nih.gov/refseq/
Chapter 2. Materials and Methods
achieve a rich and reliable annotation of genomic bacterial sequences. Prokka uses external feature prediction tools to identify the coordinates of genomic features within contigs, or finished sequences, calling upon tools such as Prodigal (Hyatt et al., 2010) for coding sequence identification or RNAmmer (Lagesen et al., 2007) for ribosomal RNA gene identification, among several others.
To increase the speed of the annotation an optional user-provided set of annotated proteins can be provided to Prokka to be used as the primary source of the annotation. For this step the available 5 protein annotations for SDSE in NCBI Genomes FTP site18 were downloaded and concatenated in one single fasta protein file.
A Python script, named easyPROKKA, for the automatic annotation of the dataset containing the 61 SDSE nucleotide files was developed and it’s available in a GitHub repository (https://github.com/cimendes/easyPROKKA). EasyPROKKA requires the path to the directory where the subfolders with the assembly files are, the path to the directory of the reference nucleotide files and the concatenated annotated proteins file. It will save all 10 Prokka output files for each sample in a separated folder within the directory where the script is located. The collection of Prokka’s output files include a series of nucleotide and protein FASTA files, the annotation and sequences in GenBank file format and GFF v3 file format, a log file and an annotation summary statistics file.
To evaluate Prokka’s annotation performance, a series of Python scripts were developed to compare the number of genes present on the 5 reference annotated protein files retrieved from NCBI’s FTP site versus Prokka’s annotation output on those same reference sequences. These scripts, named
ProkkaHistograms and available in a GitHub repository (https://github.com/cimendes/ProkkaHistograms), produces a series of histogram graphs for the gene size distribution for each of the genomes and also a for all the reference genomes together.
2.4 Pan-Genome Analysis
Having the annotated nucleotide files from reference files and de novo assemblies for the dataset, the pan-genome analysis of SDSE was performed. For that, the software chosen was Roary (Page et al., 2015), an open source tool for the rapid large-scale prokaryote pan-genome analysis, version 3.6.2.
Roary address the computational issues associated with pan-genome creation by performing a rapid clustering of highly similar sequences, which can reduce the running time of BLAST substantially, and carefully manage RAM usage so that it increases linearly, both of which make it possible to analyse datasets with a high number of samples (Page et al., 2015).
The input to Roary is one annotated assembly file per sample, in GFF3 format (Stein, 2013), such as that produced by Prokka (Seemann, 2014). From the annotation files Roary extracts the coding
Chapter 2. Materials and Methods
sequences and converts them to protein sequencing, using the CD-HIT (Fu et al., 2012) to perform an iterative pre-clustering of the sequences. From this point, an all-against-all comparison is done with BLAST protein (BLASTp) on the reduced sequence set. These sequences are then clustered with TRIBE-MCL (Enright et al., 2002), based on the Markov cluster (MCL) algorithm, and finally, the pre-clustering results from CD-HIT are merged together with the results of MCL. Using conserved gene neighbourhood information, homologous groups containing paralogous genes are split into groups of true orthologous. A graph is constructed of the relationships of the clusters based on the order of occurrence in the input sequences, allowing for the clusters to be ordered and thus providing context for each gene. Isolates are clustered based on gene presence in the accessory genome, with the contribution of isolates to the graph weighted by cluster size.
A suite of command line tools is also provided to interrogate the dataset providing union, intersection and complement. Roary also provides an option to not split paralogous genes, meaning homologous genes from the same genome. These genes could skew the results by producing falsely large and well-distributed gene groups(Page et al., 2015). If this option is not chosen, Roary will try to split these orthologous groups where paralogous genes are detected by using the conserved genes neighbourhood of each gene.
As output Roary produces a collection of files, including a comma separated value file with the gene presence and absence in all isolates, a statistics file and, if requested, a core gene alignment containing genes that occur exactly once in every isolate.
Roary separates the pan-genome into four sections: the core genes, present in at least 99% of the isolates, the soft core genes, present in 95-99% of the isolates, the shell genes, present in 15-95% of the isolates; and the cloud genes, present in 0-15% of the isolates. The core genes and the soft core genes make up the core genome, and the shell and the cloud genes make up the accessory genome.
A total of three datasets were used in the pan-genome analysis: a dataset containing the 61 SDSE isolate sequences, another dataset with the inclusion of the SDSD ATCC 27957, with generation of the core genome alignment with MAFFT (Katoh and Standley, 2013) to be used to obtain a rooted phylogenetic tree, and the third dataset, similar to the first, but with the option to not split paralogous genes.
To obtain a rooted phylogenetic tree, the core genome alignment of the second dataset was used in
Molecular Evolutionary Genetics Analysis 7 (MEGA7) (Kumar et al., 2016) software to generate a
Maximum Likelihood, a Neighbour Joining and a Minimum Evolution phylogenetic trees, each with a bootstrap of 500. The Maximum Likelihood Tree was chosen as Roary can then use this tree, in Newick format, to produce different plots of the pan-genome, including pan-genome frequency plot, a gene presence and absence matrix against the tree and a pie chart of the pan-genome, breaking down its core, soft core, shell and cloud, allowing for easier evaluation and study of the pan-genome.