Reference pricing with elastic demand for pharmaceuticals
Ricardo Gonçalvesy
Faculdade de Economia e Gestão, Universidade Católica Portuguesa (Porto) Vasco Rodrigues
Faculdade de Economia e Gestão, Universidade Católica Portuguesa (Porto) February 2012
PRELIMINARY DRAFT
Abstract
This paper analyzes pharmaceutical producers’ (of branded and generic drugs) pricing de-cisions in a context which combines the classical Hotelling framework (commonly adopted in the literature) with the possibility that consumers’demands are price elastic. We analyze with particular interest two commonly adopted reimbursement mechanisms: …xed percentage reim-bursement (FPR) and reference pricing (RP). We …nd that assuming an elastic demand has a signi…cant impact under a RP mechanism, as it allows …rms to raise their prices when the copayment rate increases. Contrary to previous literature, we show that RP may be worse than FPR in terms of social welfare for su¢ ciently high copayment rates. From a policy viewpoint, our results indicate that the introduction of RP is not necessarily always bene…cial (compared to FPR) and thus constitute a model towards which all reimbursement mechanisms should converge.
JEL Classi…cation: I18, L13
Keywords: reference pricing, reimbursement mechanisms, elastic demand
Financial support from Fundação para a Ciência e Tecnologia (project PTDC/EGE-ECO/100296/2008) is grate-fully acknowledged.
yCorresponding author. Postal address: Faculdade de Economia e Gestão, Universidade Católica Portuguesa
1
Introduction
The extant literature contains a number of strong claims on the relative properties of di¤erent pharmaceutical reimbursement mechanisms, and especially on the merits of reference pricing as compared to …xed percentage reimbursement schemes. In this paper, we show that some of those claims are driven by speci…c modelling assumptions and would, at least, be mitigated under more general assumptions.
In a large number of countries, individuals only pay a fraction of the price of the prescription pharmaceuticals they consume, whilst the government or other third-party payers are responsible for the remainder. Two widely adopted mechanisms to determine the relative contribution of the patient and the government are …xed percentage reimbursement (FPR) and reference pricing (RP). Under FPR, the government pays a …xed percentage of the pharmaceutical’s price and the patient is responsible for the remainder. Thus, the patient’s payment corresponds to a …xed percentage of the price, also known as the copayment rate. By contrast, under RP, within each cluster of pharmaceuticals1, one is chosen as the ‘reference’ for the determination of the government’s con-tribution: the government only pays a …xed fraction of the ‘reference’pharmaceutical’s price, even if the consumer actually buys a more expensive alternative. Naturally, RP is only viable if more than one pharmaceutical is available for the treatment of the same condition and is especially used when low-price generic competition exists.2
Reference pricing has attracted a lot of attention in the literature and a large consensus has emerged regarding its merits. For instance, Brekke et al. (2007) show that RP leads to lower prices than FPR mechanisms. They further show that the two mechanisms are equivalent from a social welfare perspective but RP is superior if, adopting a public payer’s perspective, the producers’ pro…ts are excluded from the analysis. Merino-Castelló (2003) also shows that RP enhances price competition and leads to signi…cant reductions in the price of branded pharmaceuticals. On a cautionary note, whilst also acknowledging the potential bene…ts of this mechanism, Miraldo (2009) notes that if …rms anticipate the introduction of RP, they will optimally revise their prices upwards ahead of that introduction, thus signi…cantly limiting its expected e¤ectiveness. Nevertheless, Brekke et al. (2009) and Brekke et al. (2011) present empirical evidence of signi…cant price reductions for all pharmaceuticals following the introduction of RP in Norway.
Most of the models in the literature on reference pricing, namely Brekke et al. (2007), Brekke et al. (2011), Merino-Castelló (2003) and Miraldo (2009), are based on a Hotelling framework: …rms sell di¤erentiated versions of a pharmaceutical, with di¤erentiation being represented by their position along a Hotelling interval, and compete by (simultaneously) setting prices; consumers are uniformly distributed along that interval and their position represents their preferences towards
1
Several criteria could be used to cluster pharmaceuticals: chemical, pharmacological or therapeutic (Miraldo, 2009).
2
the potential varieties of the product; any mismatch between the locations of …rms and consumers generates a utility loss to the latter, often described as a ‘transportation cost’, which is added to the price of the pharmaceutical; each consumer buys one unit of the pharmaceutical if total cost -price plus transportation cost - does not exceed his reservation -price. Authors commonly assume this restriction to be ful…lled thus implying that every consumer buys one unit of the product. In this type of setting, it is not surprising that social welfare is equal across reimbursement regimes (e.g. as in Brekke et al., 2007), as there are no quantity e¤ ects. Reimbursement regimes merely determine who captures the surplus created but not its amount.
This paper’s main purpose is to analyze the impact of reimbursement mechanisms such as FPR and RP in a setting where each consumer’s demand depends on prices. This strikes us as a realistic assumption, at least for some health conditions. Consider, for instance, conditions that result in recurring episodes of symptoms of variable intensity, such as sleeping disorders, muscular pain or migraines. It is entirely plausible that the patient will react to the price of the pharmaceutical he has been prescribed when deciding whether to take it on a speci…c occasion. Thus, over time, the quantity he buys may be inversely related to price. On the other hand, our setting may be less adequate for pharmaceuticals that are used to treat serious non-recurring conditions, in which case the patient will often be limited to the choice of following his physician’s prescription, and buying the pharmaceutical, or not buying it at all. In this case, the standard Hotelling framework used by Brekke et al. (2007) seems more …tting.
We obtain two novel results. First, we …nd that, under RP, prices are increasing in the share of the pharmaceutical’s price borne by the consumer, converging to FPR prices as that copayment rate approaches one. This contrasts, for instance, with Brekke et al. (2007) or Gonçalves et al. (2011), who …nd that, under RP, prices are independent of the copayment rate. Second, we show that, for su¢ ciently high copayment rates, social welfare under RP is lower than under FPR, a result which runs contrary to the previous literature boasting the merits of RP.
The di¤erences with respect to previous literature’s results are mainly determined by the impact of the elastic demand assumption on the properties of RP mechanisms, as our results for FPR are in line with the previous literature. In a nutshell, whereas under FPR an increase in the copayment rate has no impact on the relative prices faced by the consumer, as all prices rise by the same percentage, under RP this is not so: an increase in the copayment rate changes the relative prices faced by the consumer in favor of the more expensive pharmaceuticals. Ceteris paribus, this would increase their market share but their producers take the opportunity to raise their prices. Prices being strategic complements, other …rms respond by also raising prices. Thus, in equilibrium, higher copayment rates lead to higher prices, explaining our …rst result. Under FPR, social welfare does not depend on the copayment rate: …rms’‘mark-up’their prices (and pro…ts) in an inversely proportional manner with respect to the copayment rate such that the amount the consumer has to pay does not change (and, thus, consumer surplus does not depend on the copayment rate). Under
RP, however, higher copayment rates lead to higher prices and lower consumption levels and, thus, to a fall in consumer surplus that is only partially compensated by the increase in pro…ts (net of government expenditure). For su¢ ciently high copayments rates, this brings social welfare under RP below what it would be with FPR, hence explaining the second result.
From a policy viewpoint, two conclusions emerge: …rstly, from a consumer’s perspective, price di¤erences across reimbursement mechanisms are likely to be lower when copayment rates are rel-atively high. In such a scenario, the introduction of RP is unlikely to result in signi…cant price reductions (and, thus, signi…cant government expenditure savings) compared to FPR. Secondly, when copayment rates are relatively high, RP may lead to lower social welfare levels and its in-troduction may not be advised. Clearly, and from a broader perspective, our results indicate that the introduction of RP is not necessarily always bene…cial and thus does not constitute a model towards which all reimbursement mechanisms should converge.
This paper has the following structure: section 2 describes the base model; section 3 contains our main results and section 4 looks at their welfare implications; …nally, section 5 concludes.
2
Model
Our model is loosely inspired by Rath and Zhao (2001), who combine horizontal di¤erentiation, a la Hotelling, with elastic demand for each consumer.
Consumers are assumed to buy a Hicksian composite good (denoted by h) and a di¤erentiated pharmaceutical (denoted by d). This di¤erentiated product exists in two varieties: branded (in which case d = b) and generic (in which case d = g). We use the terms ‘incumbent’and ‘entrant’to refer to the producers of the branded and generic varieties of the di¤erentiated product, respectively. These two …rms compete by simultaneously setting prices.
The consumer’s utility from consuming qh units of the Hicksian good and qd units of the
dif-ferentiated good is u (qh; qd) = qh 1=qd fd; where fd is a disutility parameter discussed in more
detail below.3 In this utility function, increased consumption of the di¤erentiated product reduces a negative element that can be interpreted as ‘disease’or ‘discomfort’. The marginal utility asso-ciated with consuming the di¤erentiated product is decreasing, i.e. increasing consumption levels contribute gradually less towards the treatment of the underlying health condition.
The consumer’s budget constraint is given by phqh + pdqd = m; where m represents the
con-sumer’s income. When we normalize ph = 1; the demand functions that result from utility
maxi-mization subject to the budget constraint are given by:
3
Several utility functions could be used to represent a consumer’s utility in the consumption of these two goods; for instance, Rath and Zhao (2001) assume a utility function which gives rise to linear demand functions. However, many such functions (including that of Rath and Zhao, 2001) make the model untractable and equilibrium prices cannot be explicitly obtained. The exact speci…cation of the utility function (and its implicit demand functions) may not be critical to our results, as we discuss in Section 5.
qh = m p1=2d
qd =
1 p1=2d
(1)
Note, in particular, that demand for the di¤erentiated product is isoelastic and the (absolute value of) demand elasticity is equal to 1=2:
We assume that consumers di¤er in the degree to which they distrust the generic pharmaceutical to be therapeutically equivalent to the branded product. This seems plausible not only among the general public but among trained physicians as well. Kesselheim et al. (2008, p. 2514) note that “...generic drugs are chemically equivalent to their brand-name counterparts in terms of active ingredients but may di¤er in peripheral features, such as pill color or shape, inert binders and …llers, and the speci…c manufacturing process”. However, “...[s]ome physicians and patients have expressed concern that bioequivalent generic and brand-name drugs may not be equivalent in their e¤ects on various clinical parameters, including physiological measures such as heart rate or blood pressure, important laboratory measurements, and outcomes such as health system utilization or mortality” (Kesselheim et al., 2008, p. 2515). The scienti…c debate on whether bioequivalence translates onto treatment e¤ect equivalence is still ongoing, but at the very least suggests that it is plausible and possibly rational for a consumer to “suspect” that a generic drug may not have the same treatment e¤ect as the branded drug.4 ;5
The parameter fd in the utility function measures the utility loss the consumer su¤ers by
buying a drug he trusts less than the branded product. By de…nition, fb = 0, as the branded
product is the benchmark against which trust is measured. As for consumers that buy the generic, we assume fg(c) = tc. The parameter c 2 [0; 1] measures the "level of distrust". The parameter
t > 0 measures the negative impact of this distrust on the consumer’s utility. We assume c to be uniformly distributed in the [0; 1] interval.
Our model can be interpreted in two ways. As an analogy with previous models in the RP literature, it is possible to describe the [0; 1] interval as a Hotelling line. In this interpretation, the entrant is located at the left end of the interval and uses mill pricing: consumers bear transportation costs. The incumbent, however, uses delivered pricing, making its location not directly relevant to
4
Kesselheim et al. (2008) conclude, in their meta-analysis of various studies, that generics and branded drugs have similar clinical outcomes in the treatment of cardiovascular diseases; by contrast, Borgherini (2003) reaches an opposite conclusion - that bioequivalence and therapeutic e¤ectiveness are not necessarily the same - for psychoactive drugs; in line with those …ndings, Meredith (2003) suggests that average measures of bioequivalence are not necessarily su¢ cient to ensure treatment e¤ect equivalence for some drugs and notes that “...measures of bioequivalence that take into account variability among subjects and between healthy populations and patient populations may be more appropriate” (p. 2887).
5Kobayashi et al. (2011) discusses evidence from various countries (United States, Spain, Portugal, Germany and
Norway) where consumers were (or are) skeptic on the e¤ectiveness and safety of generic drugs. In a study on the underlying reasons for generic underuse in Portugal, Quintal and Mendes (2011) …nd that over 40% of respondents justify it due to their “lack of trust” in generics.
the determination of the equilibrium prices. It is more intuitive, however, to interpret the model as one of vertical di¤erentiation: in this interpretation, the [0; 1] interval is a scale that measures the subjective perceived vertical di¤erentiation between branded pharmaceutical and generic. A consumer with c = 0 shows "no distrust", i.e. believes the generic to be fully equivalent to the branded pharmaceutical. On the other hand, c = 1 implies that the consumer has the maximum level of distrust conceivable for a drug that has gone through the licensing process. Thus, if branded and generic prices’were equal, only the consumer with c = 0 would be indi¤erent between the two; all others would strictly prefer the branded drug. However, if the generic is cheaper than the branded drug, consumers face a trade-o¤ between their disutility in generic consumption (associated with their distrust of generics) and the higher utility in consumption they can obtain because of lower generic prices.
Further note that we assume this disutility to be independent of the quantity consumed (i.e. lump sum). Stahl (1987), Anderson et al. (1992) and Rath and Zhao (2001) justify this assumption by noting that in standard Hotelling models, where this disutility is a transportation cost associ-ated with the distance between the consumer and the producer’s geographical location, the act of consumption requires a shopping trip, whose cost is largely invariant to the quantity consumed and which translates into economies of scale. In a similar vein, we can regard the disutility associated with purchasing the generic variety as a (…xed) consumer-speci…c distrust in its treatment e¤ec-tiveness, which does not depend on the quantity he decides to consume of that drug. Assuming a …xed disutility in the consumption of a generic is equivalent to a decreasing average disutility per unit consumed (somewhat equivalent to the economies of scale mentioned above).6
In this context, consumer c 2 [0; 1] obtains the following utility from consuming the branded product: ub(qh; qb) = qh 1=qb fb = qh 1=qb, because we assume fb = 0: Similarly, the utility of
consuming the generic product is ug(qh; qg) = qh 1=qg fg(c) = qh 1=qg tc; because we assume
fg(c) = tc: The choice of which variety of the di¤erentiated product (branded or generic) to buy
is endogenous: consumers for which ub ug prefer the branded pharmaceutical, whilst all others
choose instead to consume the generic. The quantities consumed are given by the demand functions above. Note that the model implicitly assumes that each consumer purchases branded or generic pharmaceuticals, but not both simultaneously: consumers compare the maximum utility they can obtain (given their budget constraint) by consuming (a certain quantity of) each pharmaceutical variety - branded or generic - and choose whichever yields the highest utility.
6As an alternative, we could have assumed a constant per unit disutility, i.e. f
g(c) = tcqg: This would be a
sensible assumption if each consumer’s distrust in the generic treatment is likely to be proportional to the quantity consumed, thus implying that, all else equal, consumers would be less con…dent in the generic’s treatment e¤ectiveness the more they consumed it. Note that empirical studies, such as that of Quintal and Mendes (2011), point to an increased probability of consumers’ acceptance of generic substitution if they have consumed generics before, thus lending some support to our not using this alternative assumption. Nevertheless, when solving the model under this assumption, the results become computationally untractable and no closed form solutions can be found. However, some simulations indicate that the results of Proposition 1 and 2 would hold, but that those of Proposition 3 would not: under this alternative assumption, RP would always lead to higher social welfare levels than FPR.
Both the choice between the generic and branded product as well as the quantities consumed depend on the prices charged to the consumer and these depend on the existence and properties of the reimbursement mechanism. We analyze two reimbursement schemes: a …xed percentage reim-bursement (FPR) mechanism (henceforth represented by the superscript ‘F’), in which consumers pay the same percentage (copayment rate), 2 [0; 1], of their desired product’s headline price (the headline price being the price set by the producer); and a reference pricing (RP) mechanism (hence-forth represented by the superscript ‘R’), where the consumer’s copayment is based on the price of the ‘reference’pharmaceutical - typically the generic because it is cheaper and hence leads to a lower reimbursement expenditure by the third-party payer. Under a RP mechanism, the consumer must pay a percentage (copayment rate) of the reference pharmaceutical’s price if he chooses to purchase it, but if he chooses to purchase other pharmaceuticals in a predetermined reference group he must also pay the full price di¤erence between that pharmaceutical’s price and the reference price. In order to highlight the di¤erences between these two reimbursement mechanisms, under a FPR mechanism, e¤ective prices - by which we refer to the price paid by the consumer - are given by:
^
pFk = pFk (1 ) pFk = pFk; k = b; g (2)
We de…ne pFk (k = b; g) to be the headline prices set by …rms when the FPR mechanism is in place. By contrast, under a reference pricing mechanism, the e¤ective prices are given by (we assume that the reference pharmaceutical is the generic and that the copayment rate, ; is similar across mechanisms):
^
pRb = pRb (1 ) pRg ^
pRg = pRg (1 ) pRg = pRg (3)
where pRk (k = b; g) are the headline prices set by …rms when the RP mechanism is in place. We will also refer to the no reimbursement (NR) scenario, whereby patients must support the headline prices in full; this is equivalent to setting = 1 in equation (2) or (3). Finally, production costs are assumed to be zero and the total number of consumers is set equal to 1, i.e. product quantities can be interpreted as market shares.
3
Pricing
3.1 Fixed Percentage Reimbursement
Under a …xed percentage reimbursement mechanism, where the e¤ective prices for the branded and generic drugs are ^pFb = pFb and ^pFg = pFg respectively, the “marginal consumer”, cFb:g; who is indi¤erent between buying the branded (b) or generic (g) pharmaceuticals is found by solving ub = ug. This yields:
cFb:g = 2 1=2h pF b 1=2 pF g 1=2i t (4)
As the total number of consumers is assumed to be equal to one, cFb:g gives us the market share of the entrant (which produces the generic drug) and 1 cFb:g is the market share of the incumbent (which produces the branded drug). Each consumer in theh0; cFb:giinterval chooses to purchase qgF = 1= ^pFg 1=2 units of the generic drug, whilst consumers in thehcFb:g; 1iinterval choose to purchase qF
b = 1= ^pFb 1=2
units of the branded drug. Let pF = pF
b; pFg represent the price
vector. Using equation (2), the demand functions are thus given by:
B pF = qbF 1 cFb:g = 1 1=2 pF b 1=2: 0 @1 2 1=2h pF b 1=2 pFg 1=2i t 1 A G pF = qgFcFb:g = 1 1=2 pF g 1=2: 2 1=2h pFb 1=2 pFg 1=2i t (5)
The pro…t functions are given by b pF = pFb B pF and g pF = pFg G pF for
the incumbent and entrant respectively. Maximizing these functions with respect to pF
b and pFg
respectively we obtain the best-response functions:
pFb = t 2 16 + t 4 1=2 p F g 1=2 +1 4p F g pFg = 1 4p F b (6)
In a Nash equilibrium, when we insert the best response function pF
g = 14pFb in the …rst equation
of (6), the equilibrium value of pFb is the solution of this non-linear equation:
15 pFb 2t 1=2 pFb 1=2 t2
16 = 0 (7)
This equation’s solution is necessarily an approximate root, which leads to the following Nash equilibrium prices: pFb = 4 36 t 2 pFg = 1 36 t 2 (8)
qFb = 3 t qFg = 6
t (9)
whilst overall quantities sold are given by:
BF = 2 t GF = 2
t (10)
At the equilibrium prices, cFb:g = 1=3; which implies that whilst each individual consumer pur-chases more units of the generic drug than of the branded drug, the latter is sold to a larger number of consumers. These two e¤ects cancel each other out and in equilibrium each producer sells exactly the same quantity: 2=t units.
In equilibrium, pro…ts are:
F b = 4t 18 F g = t 18 (11)
When no reimbursement (NR) mechanism exists, = 1 and we obtain results which are in line with those of Rodrigues et al. (2011), Gonçalves et al. (2011) and Brekke et al. (2007). Note that pFk = 1pN Rk ; with k = b; g: Under a …xed percentage reimbursement scheme, …rms mark-up their headline prices in an inversely proportional manner relative to the copayment rate: the higher is the copayment rate, the lower is that mark-up under a FPR mechanism. This implies that the e¤ective price paid by consumers is equal in both cases and therefore equilibrium quantities are also the same, i.e. ^pF
k = ^pN Rk (k = b; g); BF = BN R and GF = GN R. Pro…t levels become Fj = 1 N Rj ; j = b; g,
i.e. …rms also increase their pro…ts in an inversely proportional manner relative to the copayment rate. Headline prices, pb and pg; are lowest when the patient’s copayment rate is maximal, i.e.
when = 1:
Consumer surplus (CS) is given by the sum of the surplus of buying the branded and generic pharmaceuticals (in equilibrium, cF
b:g = 1=3): CSF = Z 1=3 0 qFh 1=qFg tc dc + Z 1 1=3 qhF 1=qFb dc = m 11t 18 (12)
Note that CS does not depend on : as outlined above, the existence of a copayment rate has no impact on the e¤ective prices consumers must face, ^pb and ^pg: Hence, the existence of a FPR
mechanism (through parameter ) does not a¤ect consumer surplus, i.e. CSF = CSN R. Total pro…ts, which are equivalent to total pharmaceutical expenditure, are given by:
F = F
b + Fg =
5t
18 (13)
Government (or other third-party payers) expenditure with pharmaceuticals is a proportion (1 ) of total pharmaceutical expenditure:
GF = (1 ) F = (1 ) 5t
18 (14)
Note that government expenditure is decreasing with : This result has two causes: (i) …rst, there is the direct e¤ect that as increases, the reimbursement rate (1 ) ; applicable to total pharmaceutical expenditure, decreases; on the other hand, there is the strategic e¤ect that pro-ducers respond to higher copayment rates by reducing headline prices, thus bringing down total pharmaceutical expenditure.
3.2 Reference Pricing
Under a reference pricing mechanism, the e¤ective prices for the branded and generic drugs are ^
pRb = pRb (1 ) pgR and ^pRg = pRg respectively (see equation (3)) and the “marginal consumer”, cRb:g; who is indi¤erent between buying the branded (b) or generic (g) pharmaceuticals is again found by solving ub = ug, which in this case yields:
cRb:g = 2 ^p R b 1=2 2 ^pRg 1=2 t = 2 pRb (1 ) pRg 1=2 2 1=2 pRg 1=2 t (15)
Similarly to the FPR case, cRb:g gives us the market share of the entrant (which produces the generic drug) under a RP mechanism. Each consumer in the h0; cRb:gi interval chooses to purchase qgR = 1= ^pRg 1=2 units of the generic drug, whilst consumers in the hcRb:g; 1i interval choose to purchase qRb = 1= ^pRb 1=2 units of the branded drug. Let pR= pRb; pRg represent the price vector. The demand functions are thus given by B pR = qRb 1 cRb:g for the branded drug and by G pR = qR
gcRb:g for the generic drug. The pro…t functions are given by b pR = pRb B pR
and g pR = pRg G pR : When we maximize the latter pro…t function with respect to pRg, the
…rst-order condition for the entrant (after some simplifying steps) yields:
@ g pR =@pRg = 0 , pbR 2 (1 ) pRg 2 1=2 pRg 1=2
pRb (1 ) pRg 1=2= 0 (16)
This non-linear equation has two solutions, one of which results in pRb < pRg whenever > 1=4: This violates the assumption that the generic drug is the reference pharmaceutical because it is
cheaper, and hence the best-response function of the entrant is assumed to correspond to this equation’s other solution:
pRg = 1
1=2
2 (1 )p
R
b (17)
Maximizing the incumbent’s pro…t function with respect to pR
b and setting it equal to zero
(@ b pR =@pRb = 0) results in the following …rst-order condition:
tpRb 2t (1 ) pRg 4 pRb (1 ) pRg 3=2+ 2 1=2pRb pRg 1=2 4 1=2(1 ) pRg 3=2 2t pRb (1 ) pR
g
3=2 = 0 (18)
Substituting the entrant’s best-response function (equation (17)) into this equation, we obtain the incumbent’s Nash equilibrium price and subsequently substituting it into equation (17), we also obtain the entrant’s equilibrium price:
pRb = 2 1 + 1=2 4 1 + 2 1=2 2 t2 pRg = 4 1 + 2 1=2 2 t2 (19)
Under a RP mechanism, the equilibrium individually consumed quantities are given by:
qRb = 2 1 + 2 1=2 + 1=2 t qRg = 2 1 + 2 1=2 t (20)
whilst overall quantities sold are given by:
BR = 1=22 t GR = 1=22
t (21)
At the equilibrium prices, cRb:g = 1=2= 1 + 2 1=2 1=3; 8 2 [0; 1] (in particular, cRb:g is an increasing function of ) which implies that, as under the FPR mechanism, whilst each individual consumer purchases more units of the generic drug than of the branded drug, the latter is sold to a larger number of consumers. However, also as under the FPR mechanism, these two e¤ects cancel each other out and each producer sells exactly the same quantity: 2= 1=2t units.
Proposition 1 Under a RP mechanism, both headline (pR = pRb; pRg ) and e¤ ective equilibrium prices (^pR= ^pRb ; ^pRg ) are increasing in :
Proof. In equilibrium, under a RP mechanism, headline prices are given by equation (19), whose derivative with respect to is:
@pR b @ = 3 1=2+ 2 + 2 t2 4 1 + 2 1=2 3 @pR g @ = t2 4 1 + 2 1=2 3 (22)
Both derivatives are positive for any t > 0 and 2 [0; 1] : E¤ective equilibrium prices are easily calculated using equations (3) and (19), yielding ^pRb = 1 + 1=2 2t2=4 1 + 2 1=2 2 and
^
pRg = 2t2=4 1 + 2 1=2 2: The derivative of e¤ective prices with respect to is:
@ ^pRb @ = 1 + 3 1=2+ 4 + 2 3=2 t2 4 1 + 2 1=2 3 @ ^pRg @ = + 3=2 t2 2 1 + 2 1=2 3 (23)
Again, both derivatives are positive for any t > 0 and 2 [0; 1] :
When we compare these equilibrium prices with those obtained under a FPR mechanism, we also obtain the following result:
Proposition 2 Under a RP mechanism, both headline (pR = pRb; pRg ) and e¤ ective equilibrium prices (^pR= ^pRb ; ^pRg ) are never higher than under a FPR mechanism.
Proof. Recall that headline equilibrium prices under a FPR mechanism are those given by equation (8), whilst under a RP mechanism they are given by equation (19). Using those expres-sions, it is straightforward to show that pFb > pRb for any 2 [0; 1) and pFb = pRb when = 1: Similarly, pFg > pRg for any 2 [0; 1) and pFg = pRg when = 1:
E¤ective equilibrium prices under FPR are easily calculated using equations (2) and (8): ^pFb = 4t2=9 and ^pFg = t2=9: E¤ective equilibrium prices under RP are given above (see proof of Proposition 1). It is now straightforward to show that ^pF
b > ^pRb for any 2 [0; 1) and ^pFb = ^pRb when = 1:
Similarly, ^pFg > ^pRg for any 2 [0; 1) and ^pFg = ^pRg when = 1:
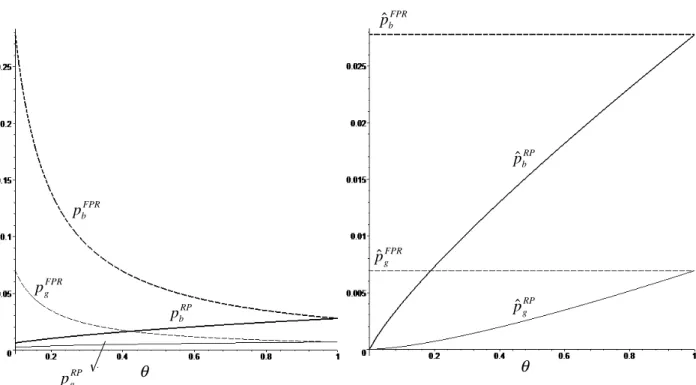
In order to understand the rationale underlying these two results, Figure 1 contains a graph-ical representation of equilibrium headline (left) and e¤ective prices (right) under the FPR and
RP mechanisms, assuming t = 0:5:7 First, note that headline prices under a FPR mechanism are decreasing with whilst under a RP mechanism they are increasing (Proposition 1). Under a FPR mechanism, an increase in the copayment rate ( ) would lead, ceteris paribus, to an increase in e¤ective prices, therefore reducing the quantity consumed of both the branded and generic phar-maceuticals. In this context, both …rms …nd it pro…t-maximizing to reduce headline prices and, thus, to reduce the (negative) impact on demand. It turns out that, in equilibrium, this reduction is su¢ cient for e¤ective prices not to change and, thus, for individually consumed quantities and overall sold quantities of both goods to remain constant. Inevitably, this hurts both …rms’pro…ts. As mentioned earlier, this result is similar to that of Brekke et at. (2007). An increase in the copayment rate leads to a reduction in total pharmaceutical expenditure (which is equal to prof-its) and, consequently, to a reduction in government expenditure, but consumer surplus remains unchanged. From a di¤erent point of view, reimbursement through a FPR mechanism can be seen as a public subsidy received by …rms; as the copayment rate increases (i.e. as the reimbursement rate decreases), this public subsidy decreases (and becomes equal to zero when = 1).
Under a RP mechanism, an increase in (ceteris paribus) would lead to an increase in e¤ective prices by the same amount. However, because it is lower, the e¤ective price of the generic would increase by more than the e¤ective price of the branded pharmaceutical in percentage terms. In comparative terms, the branded product would become relatively less expensive, thus attracting some of the consumers that were previously buying the generic. In this context, the incumbent …nds it pro…t-maximizing to respond to the increase in the copayment rate with an increase in its headline price. As prices are strategic complements, the entrant does the same. In equilibrium, the increase in the copayment rate coupled with the increase in headline prices unequivocally increases e¤ective prices and reduces individually consumed quantities as well as overall demand for both pharmaceuticals.
Note that, as shown in Proposition 2, headline and e¤ective prices are higher under a FPR mechanism (except for = 1; in which case they are equal). This suggests that RP is more e¤ective in bringing about price competition than FPR, to the bene…t of consumers. This result is in line with that of the existing literature (Brekke et al., 2007; Merino-Castelló, 2003).
Under a RP mechanism, in equilibrium, pro…ts are:
R b = 1=2 1 + 1=2 t 1 + 2 1=2 2 R g = 1=2t 2 1 + 2 1=2 2 (24)
7Note that the result in Proposition 2 does not depend on the value of t: This assumption is made here merely
FPR b pˆ FPR g pˆ FPR b p RP b pˆ RP b p pˆgRP FPR g p RP g p θ θ
Figure 1: Headline (left) and e¤ective (right) equilibrium prices under FPR and RP (assuming t = 0:5)
Corollary 1 The incumbent’s pro…ts are always increasing with ; whilst the entrant’s pro…ts are only increasing with when < 1=4:
Proof. For the incumbent, @ R b =@ =
1=2t(1+ 1=2)2
2(1+2 1=2)3( + 1=2)2 > 0; 8 2 [0; 1]. For the entrant, @ Rg=@ = t(1 2
1=2)
4 1=2(1+2 1=2)3; this is positive only when < 1=4:
As argued above, an increase in works to the incumbent’s advantage, as it allows it to raise headline prices and pro…ts. By contrast, the entrant’s pro…ts are only increasing with when the copayment rate is relatively low ( < 1=4); above that threshold, the entrant’s pro…ts are decreasing with ; as it …nds the net e¤ect of higher headline and e¤ective prices and lower demand to be negative.
Consumer surplus (CS) is given by the sum of the surplus of buying the branded and generic pharmaceuticals (in equilibrium, cRb:g = 1=2= 1 + 2 1=2 ):
CSR = Z 1=2 1+2 1=2 0 qhR 1=qRg tc dc + Z 1 1=2 1+2 1=2 qRh 1=qRb dc = m 5 + 2 1=2+ 4 3=2 t 2 1 + 2 1=2 2 (25)
because e¤ective prices are increasing with (Proposition 1). Total pro…ts, which are equivalent to total pharmaceutical expenditure, are given by:
R= R
b + Rg =
3 1=2+ 2 t
2 1 + 2 1=2 2
(26)
Thus, overall pro…ts are an increasing function of : as increases, the increase in pro…ts of the incumbent is su¢ cient to o¤set any reduction in pro…ts by the entrant. Government (or other third-party payers) expenditure with pharmaceuticals is a proportion (1 ) of total pharmaceutical expenditure:
GR= (1 ) R= (1 )
3 1=2+ 2 t
2 1 + 2 1=2 2
(27)
Corollary 2 Below a certain threshold ( 0 ' 0:14); government expenditure is increasing with : Proof. Note that @GR=@ = t(3 2
1=2 9 14 3=2 8 2)
4 1=2(1+21=2)3 : This derivative is positive whenever is below the threshold 0' 0:14:
For low values of , government expenditure is increasing with : producers respond to higher copayment rates by increasing prices but, at these low levels of copayment, this has little impact on demand; resulting price rises lead to a higher pharmaceutical expenditure which implies higher reimbursements. Above a certain threshold ( 0 ' 0:14), this no longer is the case: the reduced reimbursement rate applied to higher headline prices and lower total demand decreases government expenditure.
4
Welfare analysis
We now turn our attention to the welfare implications of our results. We …rst focus on social welfare (SW) - the sum of consumer and producer surplus minus government expenditure with pharmaceuticals - and show that:
Proposition 3 There exists a threshold value (~ = 2=3) below which social welfare is higher under a RP mechanism and above which social welfare is higher (or equal) under a FPR mechanism.
Proof. Under a FPR mechanism, social welfare is given by SWF = CSF + F GF. Using the expressions in equations (12), (13) and (14) we obtain:
SWF = m t
By contrast, under a RP mechanism, social welfare is given by SWR= CSR+ R GR. Using the expressions in equations (25), (26) and (27) we obtain:
SWR= m
2 1=2+ 5 + 3=2 2 2 t
2 1 + 2 1=2 2
(29)
The di¤erence between social welfare under the two reimbursement mechanisms is given by:
SWF SWR=
2 1=2+ 7 + 3 3=2 6 2 2 t
6 1 + 2 1=2 2
(30)
The denominator is always positive and t is also assumed to be strictly positive. Therefore, the sign of this expression depends on the numerator, which is a concave non-linear function. It has two roots: ~ = 2=3 and = 1: Therefore, when 0 < ~ = 2=3; we have SWF SWR< 0; by contrast, when 1 > ~ = 2=3; we have SWF SWR 0 (above the threshold ~ = 2=3; SWF SWR> 0 for all values of strictly below 1 and SWF SWR= 0 when = 1; as this is the second root of the non-linear function).
Brekke et al. (2007) suggest a di¤erent welfare measure which may be more relevant to countries which do not have a signi…cant pharmaceutical industry. In those cases, it is unlikely that pro…ts would enter the welfare function. Thus, welfare (W ) can be more narrowly de…ned in a public payer perspective, only taking into account consumer surplus net of government expenditure. Following this approach, we can state that:
Proposition 4 From a public payer’s welfare perspective, RP is never worse than FPR, i.e. WR WF; 8 2 [0; 1] :
Proof. Using the expressions in equations (12) and (14), welfare in a public payer’s perspective under the FPR mechanism is given by:
WF = CSF GF = m t 3
5t
18 (31)
whilst under a RP mechanism it is given by (see equations (25) and (27)):
WR= CSR GR= m +
5 1=2 7 3=2+ 2 2 t
2 1 + 2 1=2 2
(32)
The di¤erence in welfare under the two reimbursement mechanisms is given by:
WF WR=
20 1=2 26 + 21 3=2+ 39 2+ 9 5=2 18 3 5 t
18 1 + 2 1=2 2
The denominator is always positive and t is also assumed to be strictly positive. Therefore, the sign of this expression depends on the sign of the concave non-linear function in the numerator, which is negative for 8 2 [0; 1) (in which case WF < WR) and equal to zero when = 1 (in which case WF = WR):
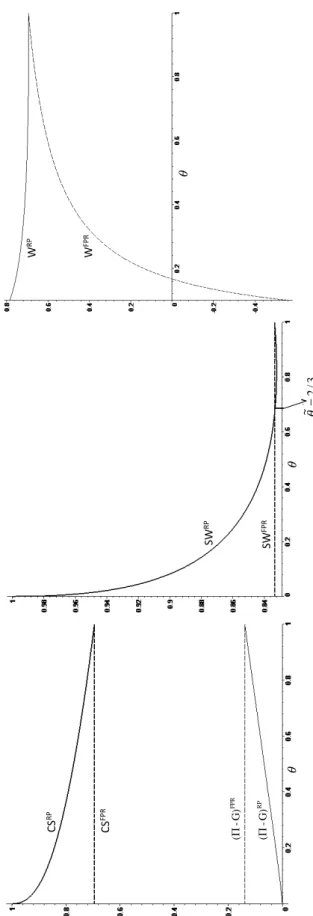
Figures 2 contains a graphical representation of consumer surplus, pro…ts net of government expenditure, social welfare and welfare from a public payer’s perspective under both reimbursement regimes, assuming t = 0:5 and m = 1:8 First, note that social welfare under a FPR mechanism does not depend on ; this result is similar to Brekke et al. (2007) (Proposition 6). As argued earlier, under a FPR mechanism, pharmaceutical …rms e¤ectively receive a public subsidy but consumers do not bene…t from lower (e¤ective) prices: the mark-up of headline prices (proportional to the reimbursement rate) is fully borne by the government and hence this transfer (e¤ectively a public subsidy) is neutral from a social welfare perspective. From a policy viewpoint, this result clearly indicates the need for pharmaceutical price regulation prior to inclusion in a FPR mechanism.
By contrast, under reference pricing, social welfare depends on : as it increases, headline and e¤ective prices also increase, thus reducing consumer surplus, increasing pro…ts and (above a certain threshold) reducing government expenditure. The net e¤ect of on social welfare depends on the relative contributions of these o¤setting e¤ects: the negative e¤ect on consumer surplus and the positive e¤ect on pro…ts and government expenditure.9 For a large range of values for
( 2 [0; 0:82) ; with the upper bound being an approximate value), the negative e¤ects dominates and thus social welfare is decreasing with ; whilst for higher values of social welfare is increasing with :
Combining these two results leads to the conclusion (Proposition 3) that a threshold exists below which RP yields a higher social welfare but above which it is FPR which yields a higher social welfare. This is not totally surprising: as increases, consumer surplus under RP decreases and approaches that of FPR (which is constant); by contrast, pro…ts net of government expenditure increase and approach those of FPR (see Figure 2). Above that threshold, the (marginally negative) contribution that pro…ts net of government expenditure make towards social welfare under RP (relative to FPR) becomes more signi…cant than the (marginally positive) contribution of consumer surplus.
When pro…ts are not considered in the welfare measure - as in Proposition 4 - then only consumer surplus and government expenditure should be considered. Under a RP mechanism, consumer surplus is decreasing with but always larger than (or equal to, when = 1) under FPR; government expenditure is always decreasing with under FPR and almost always (above ' 0:14) decreasing
8Again, note that the results in Propositions 3 and 4 do not depend on the value of t and m: This assumption is
made here merely with the objective of obtaining a graphical representation of the results and understanding their rationale.
9
Note that, taken together, the sum of pro…ts net of government expenditure is an increasing function of ; as we can see in Figure 2.
θ θ SW RP SW FPR W RP W FPR 3/ 2 ~ =θ θ CS RP CS FPR F PR G) -( Π RP G) -( Π
Figure 2: Consumer surplus and pro…ts net of government expenditure (left), social welfare (middle) and welfare from a public payer’s perspective (right) under FPR and RP (assuming t=0.5 and m=1)
with under RP, but under RP always lower than (or equal to, when = 1) under FPR. Therefore, from a public payer’s perspective, RP unequivocally leads to higher welfare levels than FPR, and this is particularly so the lower is the copayment rate (or the higher is the reimbursement rate) -when consumer surplus under RP is highest (relative to FPR) and -when government expenditure under FPR is also highest (relative to RP).
5
Discussion and conclusion
This paper studies the competitive properties of two commonly adopted reimbursement mecha-nisms, …xed percentage reimbursement (FPR) and reference pricing (RP), in a setting in which consumers’ individual demand is price-elastic. Contrary to previous literature, we show that RP may be worse than FPR, from a social welfare viewpoint, for su¢ ciently high copayment rates. This is because, in such a setting, RP has the counterintuitive property that higher copayment rates lead to higher prices. Policy-wise, our results throw some caution in the prevailing idea that intro-ducing RP is likely to generate substantial bene…ts to consumers (in the form of lower prices) and will necessarily lead to higher social welfare levels. Thus, whereas we show that RP does have some advantages compared to FPR, it is unlikely to be an ‘always better’reimbursement mechanism.
An important question is whether our results would hold for demand functions di¤erent from the very speci…c one we consider. The main driver of our results is the fact that, under RP, an increase in leads to a higher percentage increase in the e¤ective price of the generic and, thus, to a change in relative prices in favor of the branded pharmaceutical. This tips market shares in favor of the more expensive product. The key question, then, is whether this is su¢ cient to o¤set the direct negative impact on demand for that product that results from the higher copayment rate, creating the incentive for a price increase. Whilst we have not explicitly solved the model under alternative setups, it appears plausible that, for a large family of demand functions, it will. Exploring the conditions in which this happens is a possible avenue for future research.
Clearly, this paper’s results on pricing are amenable to empirical testing, as that which was carried out by Brekke et al. (2009) and Brekke et al. (2011). It is particularly relevant to highlight that our predictions only di¤er from those of Brekke et al. (2009) and Brekke et al. (2011) in what RP is concerned. In addition, it may be worthwhile to extend the analysis to a third possible, and to the best of our knowledge yet under-researched, reimbursement mechanism: asymmetric …xed percentage reimbursement, through which the reimbursement rates are di¤erent for di¤erent types of pharmaceuticals, with generics typically attracting higher reimbursement (lower copayment) rates. This type of mechanism has been used, for instance, in Portugal in order to help increase generic penetration at an early development stage. Whilst this type of mechanism introduces more complexity in the analysis, it may also have the merit to uncover more intricate details of …rms’ pricing incentives. These are also possible next steps in our research.
References
[1] Anderson, S.P., de Palma, A. and Thisse, J.-F. (1992), Discrete Choice Theory of Product Di¤ erentiation, MIT Press, Cambridge, MA.
[2] Borgherini, G. (2003), “The Bioequivalence and Therapeutic E¢ cacy of Generic Versus Brand-Name Psychoactive Drugs”, Clinical Therapeutics, 25(6), 1578-1592.
[3] Brekke, K., Königbauer, I. and Straume, O. (2007), “Reference pricing of pharmaceuticals”, Journal of Health Economics, 46, 613-642.
[4] Brekke, K., Grasdal, A. and Holmås, T. (2009), “Regulation and pricing of pharmaceuticals: Reference pricing or price cap regulation?”, European Economic Review, 53, 170-185.
[5] Brekke, K., Holmås, T. and Straume, O. (2011), “Reference pricing, competition and phar-maceutical expenditure: theory and evidence from a natural experiment”, Journal of Public Economics, 95, 624-638.
[6] Gonçalves, R., Rodrigues, V. and Vasconcelos, H. (2011), “Reference pricing in the presence of pseudo-generics”, mimeo.
[7] Kesselheim, A. S., Misono, A. S., Lee, J. L., Stedman, M. R., Brookhart, M. A., Choudhry, N. K. and Shrank, W. H. (2008), “Clinical equivalence of generic and brand-name drugs used in cardiovascular disease: a systematic review and meta-analysis”, Journal of the American Medical Association, 300, 2514-26.
[8] Kobayashi, E., Karigome, H., Sakurada, T., Satoh, N. and Ueda, S. (2011), “Patients’attitudes towards generic drug substitution in Japan”, Health Policy, 99, 60-65.
[9] López-Casasnovas and Puig-Junoy, J. (2000), “Review of the literature on reference pricing”, Health Policy, 54, 87-123.
[10] Meredith, P. (2003), “Bioequivalence and Other Unresolved Issues in Generic Drug Substitu-tion”, Clinical Therapeutics, 25(11), 2875-2890.
[11] Merino-Castelló, A. (2003), “Impact of the Reference Pricing System on the Pharmaceutical Market: A Theoretical Approach”, Universitat Pompeu Fabra, Working Paper 524a.
[12] Miraldo, M. (2009), “Reference pricing and …rms’pricing strategies”, Journal of Health Eco-nomics, 28 , 176-197.
[13] Quintal, C. and Mendes, P. (2011), “Underuse of generic medicines in Portugal: An empirical study on the perceptions and attitudes of patients and pharmacists”, Health Policy, 104, 61-68.
[14] Rath, K. P. and Zhao, G. (2001), “Two stage equilibrium and product choice with elastic demand”, International Journal of Industrial Organization, 19, 1441-1455.
[15] Rodrigues, V., Gonçalves, R. and Vasconcelos, H. (2011), “Anticompetitive impact of pseudo-generics”, mimeo.
[16] Stahl, K. (1987), “Theories of urban business decision”, in Mills, E.S. and Nijkamp, P. (Eds.), Handbook of Regional and Urban Economics, vol. 2, pp. 759-820.