Understanding e-business adoption across industries in
European countries
Tiago Oliveira (ISEGI – Universidade Nova de Lisboa, Lisboa, Portugal)
Maria F. Martins (ISEGI – Universidade Nova de Lisboa, Lisboa, Portugal)
This is the author peer-reviewed version of the article published by EMERALD as:
Oliveira, T., & Martins, M. F. (2010). Understanding e-business adoption across industries in European countries. Industrial Management and Data Systems, 110(9), 1337-1354. https://doi.org/10.1108/02635571011087428This work is licensed under a
Creative Commons Attribution-NonCommercial 4.0
International License
.
Introduction
Electronic business (e-business), or the use of Internet-based technologies to conduct business, is recognized as a significant area for information technology (IT) innovation and investment (Willcocks et al., 2000). As defined in Zhu et al. (2006a, page 601), “e-business refers to conducting transactions along the value chain (including purchasing from upstream suppliers and selling products and services to downstream customers) by using the Internet platform (e.g. TCP/IP, HTTP, XML) in conjunction with the existing IT infrastructure”. In this study we used the same definition of e-business. Firms using e-business obtain substantial returns through efficiency improvements, inventory reduction, sales increase, customer relationship enhancement, new market penetration, and financial returns (Amit and Zott, 2001, Barua et al., 2004, Lederer et al., 2001, Raymond and Bergeron, 2008, Zhu and Kraemer, 2002). The development of e-business capability is crucial because it is not only rapidly changing the way that companies buy, sell, and deal with customers, but also becoming a more central part of their business strategies (Abu-Musa, 2004). E-business adoption becomes a noteworthy research topic because it enables the firm to perform electronic transactions along value chain activities (Straub and Watson, 2001, Zhu and Kraemer, 2002) and it represents a new way to incorporate Internet-based technologies with core business, thereby potentially affecting the whole business (Zhu, 2004).
The European commission (2005) claims that more efforts are needed to improve e-business in European firms if the Lisbon targets of competitiveness are to be achieved. Under the pressure of their main international competitors, European firms need to find new opportunities to reduce costs, improve performance and the extent to which there are common behaviours across them. For these reasons, it is important to understand why firms adopt e-business or do not. Some studies analyse e-business adoption (Lin and Lin, 2008, Zhu et al., 2003, Zhu and Kraemer, 2005, Zhu et al., 2006b) but do not compare the different drivers’ importance for e-business adoption across industries.
Recent findings reveal that in the European context the most important aspect to characterize e-business adoption is the industry and its specific characteristics rather than the country the firms belong to (Oliveira and Martins, 2010). For this reason, it is important to understand e-business adoption by industry within the EU 27 context. The telecommunications (telco) industry is the most advanced sector in e-business adoption. This might serve as input for promoting e-business technologies to less e-business-intensive industries. Tourism as a whole is one of the fastest growing industries worldwide. In recent years, growth rates in tourism have been higher than those of the overall world economy. From a global perspective, the European Union (EU) is still the most tourism-intensive region worldwide (W@tch, 2007). For these reasons, we focus on these two industries. In the EU context, e-business adoption differs across these industries. In 2006, for the telco industry, e-business adoption was 82%; and for the tourism industry, it was 53% (W@tch, 2006c).
The purpose of this paper is to identify the factors that explain e-business adoption in two different industries (telco and tourism). Specifically, we want to understand what factors are important to explain e-business adoption in each industry, and to understand if the magnitude of these factors varies across
these industries in the EU27 context. To the best of our knowledge, very limited empirical research has been undertaken to evaluate the determinants of e-business adoption across different industries; this study fills this gap. To achieve our purpose we developed a research model that is a combination of the Tornatzky and Fleischer (1990) model and the Iacovou et al. (1995) model. The paper is organized as follows: first, we present the theories and literature review; then we describe the research model and hypotheses; finally, we estimate and test our model, discuss our results, and offer the main conclusions and implications.
Theories and literature review
A review of the literature suggests that the TOE framework (Tornatsky and Fleischer, 1990) may provide a useful starting point for studying e-business adoption (Lin and Lin, 2008, Zhu and Kraemer, 2005). The TOE framework identifies three features of a firm’s context that may influence adoption of technological innovation: (1) the technological context describes both the existing technologies in use and new technologies relevant to the firm; (2) the Organizational context refers to characteristics of the organization such as scope and size; (3) the Environmental context is the arena in which a firm conducts its business, referring to its industry, competitors, and dealings with the government. The TOE framework explains adoption of innovation, as can be seen in the left side of Figure 1. The TOE framework has been examined in a number of empirical studies on various information system (IS) domains. It was used to explain electronic data interchange (EDI) adoption (Kuan and Chau, 2001). Thong (1999) explained IS adoption and use. Pan and Jang (2008) explained enterprise resource planning (ERP) adoption. This framework was also used to explain e-business adoption (Zhu et al., 2003, Zhu and Kraemer, 2005) and use (Lin and Lin, 2008, Zhu and Kraemer, 2005, Zhu et al., 2006b). Empirical findings from these studies confirmed that the TOE methodology is a valuable framework in which to understand the adoption of IT innovation.
Over time, innovations become more complex and cross the limits of individual firms. More and more interorganizational systems (IOSs) become significant in the business world. For instance, electronic data interchange (EDI) and B2B e-commerce are innovations that entail integration between multiple businesses. Five years after TOE, Iacovou et al. (1995) analysed IOSs characteristics that influence firms to adopt IT innovations. They studied EDI adoption. Their framework is well suited to explain the adoption of an IOS. It is based on three factors: perceived benefits; organizational readiness, and external pressure (see right-hand side of Figure 1). Perceived benefits is a different factor from the TOE framework that will be added into our research model, whereas organization readiness is a combination of the technology and organization context of the TOE model. Hence, IT resources is similar to technology context and financial resources is similar to organizational context. The external pressure in the Iacovou et al. (1995) model adds the trading partners to the external task environmental context of the TOE as a critical role of IOSs adoptions.
----Insert Figure 1 here----
The present research combines features of the two earlier models, resulting in an integrated framework for e-business adoption. The research model proposed here comprises three dimensions, which are:
• perceived benefits;
• technology and organizational readiness; • environmental and external pressure.
The perceived benefits dimension comes from the Iacovou et al. (1995) model. The technology and organizational readiness is a combination of technology and organizational context from the Tornatzky and Fleischer (1990) framework and organizational readiness from the Iacovou et al. (1995) model. The environmental and external pressure is also a combination from both earlier studies.
Research model and hypotheses
We developed a conceptual framework for e-business adoption (see Figure 1) in which the dependent variable is the e-business adoption and we stipulated six hypotheses.
----Insert Figure 2 here----
Perceived Benefits
Perceived benefits and obstacles of e-business. Perceived benefits refers to the anticipated advantages that e-business adoption can provide to the organization. Better managerial understanding of the relative advantage of an innovation increases the likelihood of the allocation of the managerial, financial, and technological resources necessary to use that innovation (Iacovou et al., 1995, Rogers, 2003). Earlier studies argue that firms using e-business may obtain benefits such as sales increase, new market penetration, and cost reduction (Zhu and Kraemer, 2002, Zhu et al., 2004). Other empirical studies also validate that positive perception of the benefits of an innovation provides an incentive for its use (Beatty et al., 2001, Gibbs and Kraemer, 2004, Grover and Teng, 1994, Hsu et al., 2006, Iacovou et al., 1995, Kuan and Chau, 2001, Lin and Lin, 2008, Premkumar et al., 1994, Son et al., 2005). It is necessary to understand perceived benefits, as well as perceived obstacles, because the adoption process may be complicated and costly (Hong and Zhu, 2006, Pan and Jang, 2008, Zhu et al., 2006b). The adoption of e-business requires a substantial degree of technical and organizational competence for smooth transition (Hong and Zhu, 2006); these barriers can result in resistance from users. As a consequence, it is essential to reduce the perceived barriers. Cho (2006) concluded that firms that perceive fewer obstacles to the adoption of a technology will be more likely to adopt the IT. Other empirical studies have found that obstacles are a significant barrier: to e-business adoption and use (Zhu et al., 2006b); to e-commerce
migration (Hong and Zhu, 2006); to ERP adoption (Pan and Jang, 2008); and to e-markets adoption (Johnson, 2010). We postulate the following:
H1: Higher benefits combined with lower obstacles is a positive predictor of e-business adoption.
Technology and organizational readiness
Technology readiness can be defined as technology infrastructure and IT human resources (Zhu et al., 2006b). Technology infrastructure establishes a platform on which internet technologies can be built; IT human resources provide the knowledge and skills to develop web applications (Zhu and Kraemer, 2005). E-business can become an integral part of the value chain only if firms have infrastructures and technical skills. These factors may enable the technological capacity of the firm to adopt e-business. However, firms that do not have robust technology infrastructure and wide IT expertise may not wish to risk the adoption of e-business, implying that firms with greater technology readiness are in a better position to adopt e-business. Several empirical studies have identified technological readiness as an important determinant of IT adoption (Armstrong and Sambamurthy, 1999, Hong and Zhu, 2006, Iacovou et al., 1995, Kwon and Zmud, 1987, Pan and Jang, 2008, Zhu, 2004, Zhu et al., 2003, Zhu and Kraemer, 2005, Zhu et al., 2006b). Therefore, we postulate the following:
H2. The level of technology readiness is a positive predictor of e-business adoption.
Technology integration. Before the internet, firms had been using technologies to support business activities along their value chain, but many were ‘‘islands of automation’’ - they lacked integration across applications (Hong and Zhu, 2006). Evidence from the literature suggests that integrated technologies help improve firm performance through reduced cycle time, improved customer service, and lowered procurement costs (Barua et al., 2004). As a complex technology, e-business demands close coordination of various components along the value chain. Correspondingly, a greater integration of existing applications and the internet platform represent a greater capacity for conducting business over the internet (Al-Qirim, 2007a, Mirchandani and Motwani, 2001, Premkumar, 2003, Zhu et al., 2006b). We therefore postulate the following:
H3. The level of technology integration is a positive predictor of e-business adoption.
Firm size is one of the most commonly studied determinants of IT adoption (Lee and Xia, 2006). Some empirical studies indicate that there is a positive relationship between the two variables (Grover, 1993, Hsu et al., 2006, Pan and Jang, 2008, Premkumar et al., 1997, Soares-Aguiar and Palma-Dos-Reis, 2008, Thong, 1999, Zhu et al., 2003). However, larger firms have multiple levels of bureaucracy and this can impede decision-making processes regarding new ideas and projects (Hitt et al., 1990, Whetten, 1987). Moreover, e-business adoption often requires close collaboration and coordination that can be easily achieved in small firms. There is also empirical evidence against this positive relationship (Dewett
and Jones, 2001, Harris and Katz, 1991, Martins and Oliveira, 2007, Oliveira, 2008, Zhu et al., 2006a, Zhu and Kraemer, 2005, Zhu et al., 2006b). The actual adoption of e-business may entail radical change in firms’ business processes and organization structures, which might be hindered by the structural inertia of large firms (Damanpour, 1992). In the opinion of Zhu and Kraemer (2005), size is often associated with inertia; that is, large firms tend to be less agile and less flexible than small firms. The possible structural inertia associated with large firms may slow down e-business adoption. Hence, we postulate the following:
H4. Firm size is a negative predictor of e-business adoption.
Environmental and external pressure
Competitive pressure refers to the degree of pressure felt by the firm from competitors within the industry. Porter & Millar (1985) analysed the strategic rationale underlying competitive pressure as an innovation-diffusion driver. They suggested that, by using a new innovation, firms might be able to alter the rules of competition, affect the industry structure, and leverage new ways to outperform rivals, thus changing the competitive landscape. This analysis can be extended to IT adoption. Empirical evidence suggests that competitive pressure is a powerful driver of IT adoption and diffusion (Al-Qirim, 2007b, Battisti et al., 2007, Dholakia and Kshetri, 2004, Gibbs and Kraemer, 2004, Grandon and Pearson, 2004, Hollenstein, 2004, Iacovou et al., 1995, Lai et al., 2007, Mehrtens et al., 2001, Zhu et al., 2003). Therefore, we assume that:
H5: Competitive pressure is a positive predictor of e-business adoption.
Trading partner collaboration is an important factor because the value of e-business can be maximized only when many trading partners are using it (Iacovou et al., 1995). As suggested by empirical evidence, the success of e-business depends on the trading partners’ readiness to jointly use the internet to perform value chain activities (Barua et al., 2004). In a trading community with greater partner readiness, individual adopters reveal higher levels of e-business usage due to network effects (Shapiro and Varian, 1999). Some empirical researches suggest that trading partner is an important determinant for EDI, e-procurement and e-business adoption and use (Iacovou et al., 1995, Lai et al., 2007, Lin and Lin, 2008, Soares-Aguiar and Palma-Dos-Reis, 2008, Zhu et al., 2006a, Zhu et al., 2003). Thus, we expect that: H6: Trading partner collaboration is a positive predictor of e-business adoption.
Controls
In this study, we need to control for type of industry and country effects. It is usual in IS literature to use dummy variables to control these effects (Bresnahan et al., 2002, Soares-Aguiar and Palma-Dos-Reis,
2008, Zhu et al., 2006a, Zhu et al., 2003). We used dummy variables to control for data variation that would not be captured by the explanatory variables mentioned above.
Methods
Sample
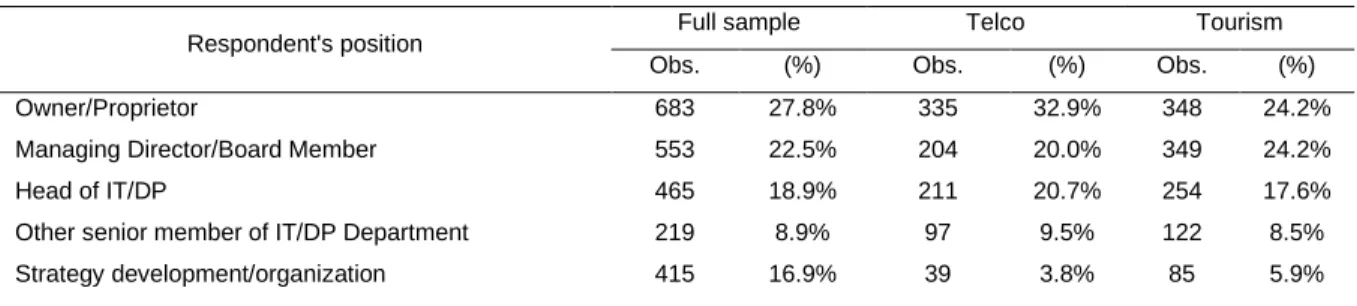
Our data source is e-Business W@tch (2006a, w@tch, 2006b), which collects data on the use of ICT and e-business in European firms. Pilot interviews were conducted with 23 companies in Germany in February 2006, in order to test the questionnaire (structure, comprehensibility of questions). The sample drawn was a random sample of firms from the respective industry population in each of the countries, with the objective of fulfilling minimum strata with respect to company size class per country-industry cell. Strata were to include a 10% share of large companies (250+ employees), 30% of medium sized enterprises (50-249 employees), 25% of small enterprises (10-49 employees) and up to 35% of micro enterprises with fewer than 10 employees. We studied 27 EU members in two industries (telco and tourism) which had a scope of 3708 telephone interviews with decision-makers in firms, carried out in March and April 2006, using computer-aided telephone interview (CATI) technology. Globally, the response rate was 13.1%, which was comparable to other studies of similar scale (Zhu and Kraemer, 2005). In particular, the response rates varied from country to country, ranging from 7.1% to 32.0%. We used data from the 2006 year because this was the last year with all countries of EU27 and these industries available. These data were collected by means of representative surveys of firms that used computers. According to the methodological recommendations of Eurostat, the situation of an operator that “did not answer” or “does not know” the answer to a specific question should not imply its imputation, in any case, based on the answer of the other operators. Consequently, we obtained a smaller sample that we compared, by a proportion test, with the original one. The proportion test for the variable e-business adoption reveals that there is no statistically significant difference by industry and country. The final sample includes 2459 firms belonging to the EU27. About 80 percent (78.1% full sample, 83.1% telco indusdry, and 74.5% tourism industry) of the data were collected from owners, managing directors, heads of IT, and other senior members of IT, suggesting the high quality of the data source (Table I).
Table I. Respondent’s position
Respondent's position Full sample Telco Tourism Obs. (%) Obs. (%) Obs. (%) Owner/Proprietor 683 27.8% 335 32.9% 348 24.2% Managing Director/Board Member 553 22.5% 204 20.0% 349 24.2%
Head of IT/DP 465 18.9% 211 20.7% 254 17.6%
Other senior member of IT/DP Department 219 8.9% 97 9.5% 122 8.5% Strategy development/organization 415 16.9% 39 3.8% 85 5.9%
Other 124 5.0% 133 13.1% 282 19.6%
Total 2459 100.0% 1019 100.0% 1440 100.0%
Factor analysis and reliability test
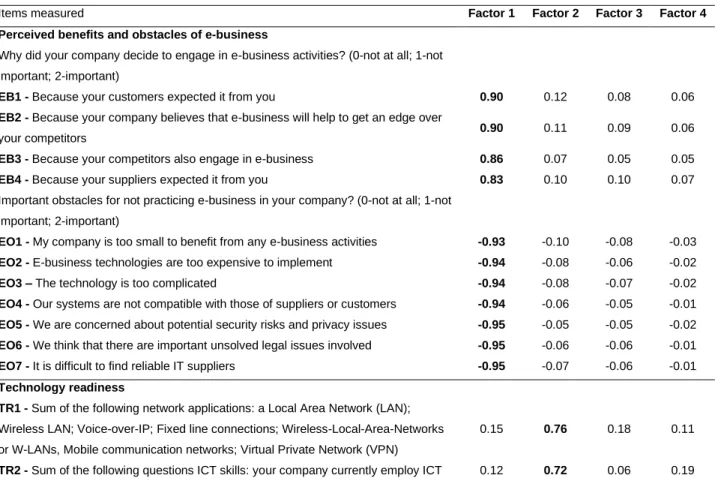
As a first step, we performed a factor analysis (FA) of multi-item indicators to reduce the number of variables of the survey and to evaluate the validity, which is a very common analysis in innovation studies (Eid and Trueman, 2004, Oliveira and Martins, 2010, Premkumar et al., 1994, Tan et al., 2009, Thong, 1999, To and Ngai, 2006, Wei et al., 2009). We used the principal component technique with varimax rotation (see Table II) to extract four eigen-values, which were all greater than one. The first four factors explain 71.3% of the variance contained in the data. The Kaiser-Meyer-Olkin (KMO) measures the adequacy of the sample; general KMO is 0.96 (KMO ≥ 0.90 is excellent (Sharma, 1996)), which reveals that the matrix of correlation is adequate for the FA. The KMO for individual variables is also adequate. All of the factors have a loading greater than 0.50 (except indicator TI4). This indicates that our analysis employs a well-explained factor structure. The four factors found are: perceived benefits and obstacles of e-business, technology readiness, trading partner collaboration, and technology integration. The factors obtained are in accordance with the literature review.
Table II. Factor analysis
Items measured Factor 1 Factor 2 Factor 3 Factor 4 Perceived benefits and obstacles of e-business
Why did your company decide to engage in e-business activities? (0-not at all; 1-not important; 2-important)
EB1 - Because your customers expected it from you 0.90 0.12 0.08 0.06
EB2 - Because your company believes that e-business will help to get an edge over
your competitors 0.90 0.11 0.09 0.06
EB3 - Because your competitors also engage in e-business 0.86 0.07 0.05 0.05
EB4 - Because your suppliers expected it from you 0.83 0.10 0.10 0.07 Important obstacles for not practicing e-business in your company? (0-not at all; 1-not
important; 2-important)
EO1 - My company is too small to benefit from any e-business activities -0.93 -0.10 -0.08 -0.03
EO2 - E-business technologies are too expensive to implement -0.94 -0.08 -0.06 -0.02
EO3 – The technology is too complicated -0.94 -0.08 -0.07 -0.02
EO4 - Our systems are not compatible with those of suppliers or customers -0.94 -0.06 -0.05 -0.01
EO5 - We are concerned about potential security risks and privacy issues -0.95 -0.05 -0.05 -0.02
EO6 - We think that there are important unsolved legal issues involved -0.95 -0.06 -0.06 -0.01
EO7 - It is difficult to find reliable IT suppliers -0.95 -0.07 -0.06 -0.01
Technology readiness
TR1 - Sum of the following network applications: a Local Area Network (LAN);
Wireless LAN; Voice-over-IP; Fixed line connections; Wireless-Local-Area-Networks or W-LANs, Mobile communication networks; Virtual Private Network (VPN)
0.15 0.76 0.18 0.11
Reliability measures the stability of the scale based on an assessment of the internal consistency of the items measuring the construct. It is assessed by calculating the composite reliability for each composite independent variable. Most of the constructs have a composite reliability over the cut off of 0.70, as suggested by Nunnally (1978). Perceived benefits and obstacles of e-business, technology readiness and trading partner collaboration have a Cronbach’s alpha value respectively of 0.98, 0.77 and 0.82. The last dimension, technology integration, comprises four items and has a Cronbach’s alpha value of 0.61 which may be adequate for exploratory research. We decided to retain this dimension as it relates to the important issue of technology integration in e-business adoption. Thus, constructs developed by this measurement model could be used to test the conceptual model and the associated hypotheses.
Data analysis and results
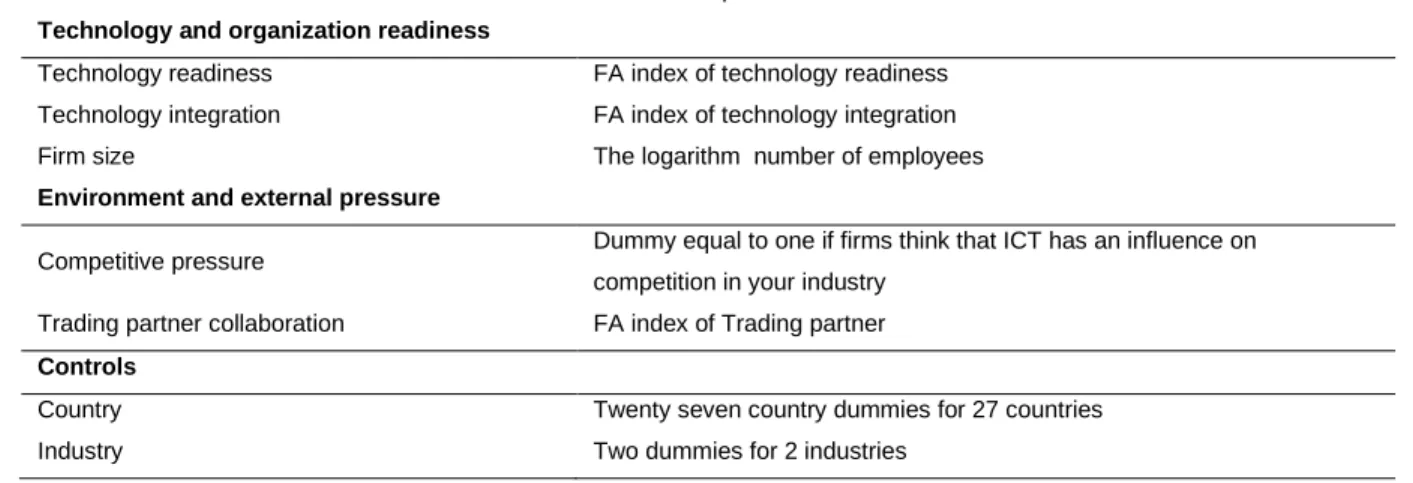
The independent variables are in accordance with our research model, which is a combination of the Tornatzky and Fleischer (1990) model and the Iacovou et al. (1995) model. Perceived benefits and obstacles of e-business, technology readiness, trading partner collaboration, and technology integration were obtained by factor analysis. All the other variables were obtained directly by the questionnaire. The dependent variable is e-business adoption, a binary variable which has value equal to one if firms adopt e-business and zero otherwise (Table III).
Table III. Description of independent variables
Variables Description
Perceived benefits
practitioners; your company regularly send employees to ICT training programmes
TR3 - Sum of the following security applications: secure server technology, for
example SSL, TLS or a comparable technical standard; digital signature or public key infrastructure; a firewall
0.20 0.67 0.21 0.08
TR4 - Sum of the following technologies: Internet; intranet; web site; 0.26 0.62 0.31 0.04
TR5 - Percentage of employees that have access to the internet 0.06 0.55 0.25 -0.18
Trading partner collaboration
Does your company use online applications other than e-mail, to support any of the following business functions (0- no, and not use internet; 1-no; 2-yes)?
TP1 - To collaborate with business partners in the design of new products or services 0.13 0.17 0.89 0.04
TP2 - To collaborate with business partners to forecast product or service demand 0.13 0.15 0.88 0.11
Technology Integration
Does your company use any of the following systems or applications for managing information in the company (0- do not know what this is; 1-no; 2-yes)?
TI1 - an EDM system, that is an Enterprise Document Management System 0.05 0.07 0.13 0.71 TI2 - an ERP system, that is Enterprise Resource Planning System 0.06 0.19 0.09 0.71 TI3 - a SCM system, that is a Supply Chain Management System 0.07 0.00 0.08 0.69
Perceived benefits and obstacles of e-business FA index of perceived benefits and barriers of e-business
Technology and organization readiness
Technology readiness FA index of technology readiness Technology integration FA index of technology integration Firm size The logarithm number of employees
Environment and external pressure
Competitive pressure Dummy equal to one if firms think that ICT has an influence on competition in your industry
Trading partner collaboration FA index of Trading partner
Controls
Country Twenty seven country dummies for 27 countries Industry Two dummies for 2 industries
We began our analysis by checking the multi-collinearity, for which we calculated the variance inflation factor (VIF) for the regression coefficients. The VIF ranged from a low of 1.06 to a high of 2.51. The values are below the threshold of 10, indicating that there is no problem of multi-collinearity amongst the variables (Hair et al., 1998).
Since the dependent variable is binary (to adopt or not), we applied logistic regression to test the research model, and used the significance of the regression coefficients to support the hypotheses. We also computed marginal effects of independent variables. We estimated three different regressions: one for the full sample, and one for each industry (Table IV).
Table IV. Logistic regression for e-business adoption in all industries
Independent variables Full sample Telco Tourism Coef. P-value Coef. P-value Coef. P-value Perceived benefits and
obstacles of e-business 0.737*** 0.000 0.704*** 0.000 0.788*** 0.000 Technology readiness 0.788*** 0.000 0.727*** 0.000 0.857*** 0.000 Technology integration 0.141** 0.032 0.257** 0.026 0.087 0.288 Firm size 0.004 0.931 -0.066 0.371 0.025 0.651 Competitive pressure 0.527*** 0.000 0.482** 0.029 0.590*** 0.000 Trading partner collaboration 0.638*** 0.000 0.547*** 0.000 0.677*** 0.000
Sample size 2459 1019 1440
Area under the curve (AUC) 0.834 0.820 0.847 Note: we also include dummies for the 27 countries in all regressions and industries dummies for regressions of all industries; ; * p-value<0.10; ** p-value<0.05; *** p-value<0.01.
The goodness-of-fit for all regressions was assessed in three ways. First, to analyse the joint statistical significance of the independent variables we computed the likelihood ratio (LR) test, which is statistically significant (p-value<0.001 for each regression). This implies a strong relationship between the dependent variable and the independent variables for each regression. Secondly, we used the Hosmer-Lemeshow test (Hosmer and Lemeshow, 1980, Lemeshow and Hosmer, 1982), which reveals that there are no
differences between fitted values of the model and the actual values, for any of the three regressions (p-values are respectively 0.38, 0.15, and 0.56). Finally, the discrimination power of the model is evaluated in two ways. We use the area under the curve (AUC), which is equal to 83%, 82%, and 85% respectively for e-business adoption in full sample, telco, and tourism industries. This reveals an excellent discrimination for all regressions (Hosmer and Lemeshow, 2000). We also computed the prediction accuracy: 81.2%, 84.5%, and 80.1% respectively. The adoption by random choices ([adopters/(adopters + non-adopters)]2+ [non-adopters/(adopters + non-adopters)]2) would result in 64.0%, 71.8%, and 59.6% respectively for each regression, which are much less than in the case of our regressions. Thus we conclude that the logistic regressions have much higher discriminating power than the random choice model. The three statistical procedures reveal a substantive model fit, a satisfactory discriminating power, and there is evidence to accept an overall significance of the models.
For the full sample regression, perceived benefits and obstacles of e-business, technology readiness, technology integration, trading partner collaboration, and competitive pressure are positively associated with e-business. All hypotheses (H1-H6) are confirmed except H4 (firm size). The same result is obtained for telco. For the tourism industry, the H1, H2, H5 and H6 are confirmed.
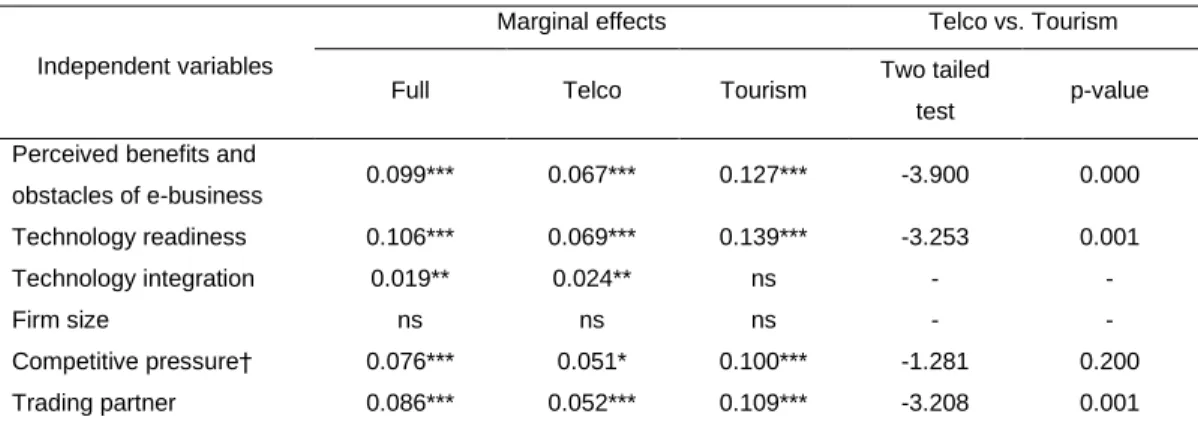
In deep analysis we computed the statistically significant marginal effects to test the differences between telco and tourism industries (Table V). Results reveal that marginal effects for perceived benefits and obstacles of e-business, technology readiness, and trading partner collaboration are significantly different between these two industries. In other words, competitive pressure is the unique driver that has the same marginal effect in both industries for e-business adoption.
Table V. Marginal effects of logistic regression for e-business in all industries
Independent variables
Marginal effects Telco vs. Tourism Full Telco Tourism Two tailed
test p-value Perceived benefits and
obstacles of e-business 0.099*** 0.067*** 0.127*** -3.900 0.000 Technology readiness 0.106*** 0.069*** 0.139*** -3.253 0.001 Technology integration 0.019** 0.024** ns - - Firm size ns ns ns - - Competitive pressure† 0.076*** 0.051* 0.100*** -1.281 0.200 Trading partner 0.086*** 0.052*** 0.109*** -3.208 0.001 Note: we also include dummies for the 27 countries in all regressions and industry dummies for regressions of all industries , ns – not significant; * p-value<0.10; ** p-value<0.05; *** p-value<0.01; variables with “†” are binary.
Discussion and implications
The purpose of this paper was to identify the factors that explain e-business adoption and to understand the extent to which the magnitude of these factors varies across the two industries (telco and tourism
industry) in the EU27 context. Our empirical results generally support the model. In the perceived benefits dimension, the perceived benefits and obstacles of e-business (H1) is a statistically significant facilitator for e-business adoption in both industries (Table IV). Therefore, for managers who think that e-business technologies are too expensive to implement, with the cost of technology decreasing, this obstacle is transposed. Also, policy makers should regulate the internet to make it a reliable commerce platform (e.g., dealing with fraud and credit card misuse), and promote the diffusion of the internet amongst end-users. This measure solves two more obstacles of e-business, which are: potential security risks and privacy issues, and legal issues involved. Moreover, the marginal effects are different between telco and tourism industries (Table V). The tourism industry is the one where this variable is more important, perhaps because in the telco industry the firms are more informed of the perceived benefits and obstacles of e-business.
In the technology and organization readiness dimension, the technology readiness (H2) is also a statistically significant facilitator for e-business adoption for all regressions. This means that managers and policy makers should be aware that technology readiness is constituted both by physical infrastructures and intangible knowledge, such as IT skills. For managers, investments in physical infrastructure and the hiring of employees with IT skills should be made; for current employees training programmes should be promoted. Policy makers should promote the construction of infrastructures and reduce tax laws to stimulate firms to provide IT training programmes to employees. This is in accordance with the European Commission (2008) that claims that the importance of ICT skills – i.e. professional skills, user skills, and e-business skills – for the competitiveness and growth of the European economy has been confirmed in several high-level documents and initiatives of the European Commission. The tourism industry reveals a statistically significant higher relative importance (marginal effects) of technology readiness for e-business adoption when compared with the telco industry. One possible explanation is that tourism workers have less ICT skill and the tourism firms have fewer ICT infrastructures; consequently, due to the lack of technology readiness, this variable is more important for the tourism industry. Technology integration (H3) is a statistically significant facilitator only in the telco industry (Table IV). One possible explanation is that as telco firms have higher levels of IT knowhow, only these firms can take advantage of technology integration, i.e., improving firm performance, improving customer service, and lowering procurement costs (Barua et al., 2004). In particular, managers in the tourism industry need to improve knowhow in IT workers, to take advantage of technology integration, which can provide more flexible dynamic packaging (bundling products with flexibility). Dynamic package depicts what is probably the most sophisticated and challenging e-business format in tourism in terms of technology requirements (W@tch, 2007). Firm size (H4) is not statistically significant for e-business adoption in both industries. This result is in accordance with literature where firm size is a “controversial” predictor for IT adoption. This means that in the telco and tourism industries the advantage of the availability of funds being greater for large firms (Iacovou et al., 1995, Rogers, 2003) does not prevail, nor does the disadvantage of larger firms having multiple levels of bureaucracy, which can impede
decision-making processes regarding new ideas and projects (Hitt et al., 1990, Whetten, 1987). This reveals that e-business is not a phenomenon dominated by large firms, this is special important for managers that think their firm is too small to benefit from any e-business activities.
In the environment and external pressure dimension, the competitive pressure (H5) is a statistically significant facilitator for e-business adoption in both industries (Table IV), and there is no statistically significant difference in terms of magnitude of importance (Table V). Hence, gaining competitive advantage is still one of the most important drivers of e-business adoption; furthermore, managers should be aware that competitive pressure (H6) has the same importance for e-business adoption across the industries, which reveals the same level of competition in the online market. Trading partner collaboration is a statistically significant facilitator for both industries (Table IV). Consequently, managers and policy makers should encourage the formation of networks with other players and the sharing of resources in order to satisfy the needs of diverse and ever faster changing customer requirements. This, in turn, could increase the competiveness of the whole network (W@tch, 2007). Our analysis indicates a statistically significant higher magnitude of trading partner collaboration for e-business adoption in the tourism industry when compared to telco (Table V). One possible explanation is that the trading partners are less collaborative in the tourism industry than in the telco industry (W@tch, 2007).
There is at least one variable from each dimension that is statistically significant in e-business adoption for the two industries; in the other words the main drivers of e-business adoption across industries are perceived benefits and obstacles of e-business adoption, technology readiness, competitive pressure, and trading partner; moreover, all three dimensions proposed are relevant for e-business adoption across different industries in the EU context. As the telco industry is the most intensive adopter and user of e-business (W@tch, 2007), it can serve as an example for other industries, and there is a e-business opportunity for this industry to provide e-business solutions for firms belonging to other industries.
Theoretical implications
Whilst there are many theoretical studies of e-business adoption, comparisons across industries are lacking. To promote e-business adoption and their comparison across industries, it is critical to clarify the factors that explain e-business adoption, and to conduct a deep analysis to understand if different industries have the same drivers for e-business adoption. Based on the Tornatzky and Fleischer (1990) model and the Iacovou et al. (1995) model, we define our research model to investigate the factors affecting the e-business adoption across the telco and tourism industries. To the best of our knowledge, this study is one of the first that examines adoption of e-business with a multi-industries comparison of EU27 countries using a research model that combines these two models. Using empirical data from 2459 firms belonging to the EU27, from two different industries, we found strong support for our research model, the three dimensions proposed are important for both industries. Moreover, we also found differences in the relative importance of drivers for e-business adoption for the different industries. Our
results reveal that to better understand e-business adoption it is not sufficient to use industry as a control variable. It is more adequate to estimate a model for each industry. This is one of the first research efforts to provide concrete empirical support for the theories of e-business adoption in the EU27 context comparing two different industries. As the sample was not limited to data from a single country, this helps to strengthen the generalization of the model and findings.
Conclusions
E-business adoption enables the firm to perform electronic transactions along value chain activities (Straub and Watson, 2001, Zhu and Kraemer, 2002). To promote e-business adoption, it is critical to clarify the factors that explain this adoption, and make a deep analysis to understand if different industries have the same drivers for e-business adoption. These have special importance, since recent findings reveal that in Europe the most relevant factor to characterize e-business adoption is the industry and its specific characteristics, and not the country that the firms belong to (Oliveira and Martins, 2010). In this paper, we have established and empirically tested the prediction model of the six determinants of e-business. In general, our hypotheses are confirmed, our research model seems appropriate. The perceived benefits and obstacles of e-business, technology readiness, competitive pressure, and trading partner collaboration are the drivers that are important for all industries. Through the comparison of the industries, we can verify that there are statistically significant differences between the telco and tourism industries. The relative importance of all drivers for e-business adoption in the telco differs from the tourism. The only exception is competitive pressure, where there is no difference between these industries.
Limitations and future studies
As in most empirical studies, our work is limited in some ways. Firstly, the cross-sectional nature of this study does not allow knowing how this relationship will change over time. To solve this limitation, future research should involve panel data. Secondly, our study investigates only adoption decisions. To provide a more balanced view of firms’ adoption and assimilation of e-business into the core business activities, the extent of e-business migration from traditional platform to the internet should also be examined, as suggested by Hong & Zhu (2006). Thirdly, we did not include the government regulation variables in our model because these variables are not available in this questionnaire. A new questionnaire should therefore be constructed for in further research. Fourthly, in the tourism industry the rate of adoption between business-to-business (B2B) and business-to-consumer (B2C) is different. Further research is needed to understand the different drivers of B2B and B2C, and across industries. Finally, we fully encourage confirmatory studies of our research model; and urge future researchers to test it in different contexts. It should be applied to other IT adoptions in order to be refined. Others studies with new
samples should be used for the validation of our model. Samples of specific context or industry, such as manufacturing or service, should be gathered to further examine the applicability of this model.
References
ABU-MUSA, A. A. 2004. Auditing e-business: new challenges for external auditors. Journal of American Academy of Business, 4, 28–41.
AL-QIRIM, N. 2007a. The adoption of eCommerce communications and applications technologies in small businesses in New Zealand. Electron. Commer. Rec. Appl., 6, 462-473.
AL-QIRIM, N. 2007b. The adoption of eCommerce communications and applications technologies in small businesses in New Zealand. Electronic Commerce Research and Applications.
AMIT, R. & ZOTT, C. 2001. Value creation in e-business. Strategic Management Journal, 22, 493-520. ARMSTRONG, C. P. & SAMBAMURTHY, V. 1999. Information technology assimilation in firms: The
influence of senior leadership and IT infrastructures. Information Systems Research, 10, 304-327. BARUA, A., KONANA, P., WHINSTON, A. B. & YIN, F. 2004. Assessing internet enabled business value:
An exploratory investigation. MIS Quarterly, 28, 585-620.
BATTISTI, G., HOLLENSTEIN, H., STONEMAN, P. & WOERTER, M. 2007. Inter and Intra firm Diffusion of ICT in the United Kingdom (UK) and Switzerland (CH) : An Internationally Comparative Study Based on Firm-level Data. Economics of Innovation and New Technology, 16, 669 - 687.
BEATTY, R. C., SHIM, J. P. & JONES, M. C. 2001. Factors influencing corporate web site adoption: a time-based assessment. Information & Management, 38, 337-354.
BRESNAHAN, T. F., BRYNJOLFSSON, E. & HITT, L. M. 2002. Information technology, workplace organization, and the demand for skilled labor: Firm-level evidence. Quarterly Journal of Economics, 117, 339-376.
CHO, V. 2006. Factors in the adoption of third-party B2B portals in the textile industry. Journal of Computer Information Systems, 46, 18-31.
COMMISSION, E. 2005. Information Society Benchmarking Report [Online]. Luxembourg. Available: http://ec.europa.eu/information_society/eeurope/i2010/docs/benchmarking/051222%20Final%20Benc
hmarking%20Report.pdf [Accessed 29 Jan 2009].
COMMISSION, E. 2008. The European e-Business Report 2008 - The impact of ICT and e-business on firms, sectors and the economy. 6th Synthesis Report of the Sectoral e-Business Watch, 1-304. DAMANPOUR, F. 1992. Organization Studies. Organizational Size and Innovation, 13, 375-402.
DEWETT, T. & JONES, G. R. 2001. The role of information technology in the organization: a review, model, and assessment. Journal of Management, 27, 313-346.
DHOLAKIA, R. R. & KSHETRI, N. 2004. Factors Impacting the Adoption of the Internet among SMEs. Small Business Economics, 23, 311-322.
EID, R. & TRUEMAN, M. 2004. Factors affecting the success of business-to-business international Internet marketing (B-to-B IIM): an empirical study of UK companies. Industrial Management & Data Systems, 104, 16-30.
GIBBS, L. J. & KRAEMER, K. L. 2004. A Cross-Country Investigation of the Determinants of Scope of E-commerce Use: An Institutional Approach. Electronic Markets, 14, 124-137.
GRANDON, E. E. & PEARSON, J. M. 2004. Electronic commerce adoption: an empirical study of small and medium US businesses. Information & Management, 42, 197-216.
GROVER, V. 1993. An Empirically Derived Model for the Adoption of Customer-Based Interorganizational Systems. Decision Sciences, 24, 603-640.
GROVER, V. & TENG, T. C. 1994. Facilitating the implementation of customer-based inter-organizational systems: an empirical analysis of innovation and support factors. Information Systems Journal, 4, 61– 89.
HAIR, J. F., ANDERSON, R. E., TATHAM, R. L. & BLACK, W. C. 1998. Multivariate Data Analysis, Upper Saddle River, NJ, Prentice-Hall.
HARRIS, S. E. & KATZ, J. L. 1991. Firm Size and the Information Technology Investment Intensity of Life Insurers. MIS Quarterly, 15, 333-352.
HITT, M. A., HOSKISSON, R. E. & IRELAND, R. D. 1990. Mergers and Acquisitions and Managerial Commitment to Innovation in M-Form Firms. Strategic Management Journal, 11, 29-47.
HOLLENSTEIN, H. 2004. Determinants of the adoption of Information and Communication Technologies (ICT). An empirical analysis based on firm-level data for the Swiss business sector. Structural Change and Economic Dynamics, 15, 315-342.
HONG, W. Y. & ZHU, K. 2006. Migrating to internet-based e-commerce: Factors affecting e-commerce adoption and migration at the firm level. Information & Management, 43, 204-221.
HOSMER, D. W. & LEMESHOW, S. 1980. A goodness-of-fit test for the multiple logistic regression model. Communications in Statistics, A10, 1043-1069.
HOSMER, D. W. & LEMESHOW, S. 2000. Applied Logistic Regression Willey.
HSU, P. F., KRAEMER, K. L. & DUNKLE, D. 2006. Determinants of e-business use in US firms. International Journal of Electronic Commerce, 10, 9-45.
IACOVOU, C. L., BENBASAT, I. & DEXTER, A. S. 1995. Electronic data interchange and small organizations: Adoption and impact of technology. MIS Quarterly, 19, 465-485.
JOHNSON, M. 2010. Barriers to innovation adoption: a study of e-markets. Industrial Management & Data Systems, 110, 157-174.
KUAN, K. K. Y. & CHAU, P. Y. K. 2001. A perception-based model for EDI adoption in small businesses using a technology-organization-environment framework. Information & Management, 38, 507-521. KWON, T. H. & ZMUD, R. W. 1987. Unifying the fragmented models of information systems
implementation. In critical issues in Information Systems Research (Boland RJ and Hirschheim RA, Eds). In: WILEY, J. (ed.). New York.
LAI, F., WANG, J., HSIEH, C. T. & CHEN, J. C. 2007. On network externalities, e-business adoption and information asymmetry. Industrial Management & Data Systems, 107, 728-746.
LEDERER, A. L., MIRCHANDANI, D. A. & SIMS, K. 2001. The search for strategic advantage from the World Wide Web. International Journal of Electronic Commerce, 5, 117-133.
LEE, G. & XIA, W. D. 2006. Organizational size and IT innovation adoption: A meta-analysis. Information & Management, 43, 975-985.
LEMESHOW, S. & HOSMER, D. W. 1982. The use of goodness-of-fit statistics in the development of logistic regression models. American Journal of Epidemiology, 115, 92-106.
LIN, H. F. & LIN, S. M. 2008. Determinants of e-business diffusion: A test of the technology diffusion perspective. Technovation, 28, 135-145.
MARTINS, M. & OLIVEIRA, T. 2007. Determinants of information technology diffusion: A study at the firm level for Portugal. In: REMENYI, D. (ed.) Proceedings of the European Conference on Information Management and Evaluation. Nr Reading: Academic Conferences Ltd.
MEHRTENS, J., CRAGG, P. B. & MILLS, A. M. 2001. A model of Internet adoption by SMEs. INFORMATION & MANAGEMENT, 39, 165-176.
MIRCHANDANI, D. A. & MOTWANI, J. 2001. Understanding small business electronic commerce adoption: An empirical analysis. Journal of Computer Information Systems, 41, 70-73.
NUNNALLY, J. C. 1978. Psychometric Theory, New York, McGraw-Hill.
OLIVEIRA, T. Year. Modelo Probit Bivariado com Selecção - Factores Determinantes da Adopção do CE. In: Actas do XV Congresso Anual da SPE, 2008 Lisboa. Actas do XV Congresso Anual da SPE, 401-414.
OLIVEIRA, T. & MARTINS, M. F. 2010. Firms Patterns of e-Business Adoption: Evidence for the European Union- 27. The Electronic Journal Information Systems Evaluation Volume, 13, 47-56. PAN, M. J. & JANG, W. Y. 2008. Determinants of the adoption of enterprise resource planning within the
technology-organization-environment framework: Taiwan's communications. Journal of Computer Information Systems, 48, 94-102.
PORTER, M. E. & MILLAR, V. E. 1985. How Information Gives You Competitive Advantage. Harvard Business Review, 63, 149-160.
PREMKUMAR, G. 2003. A meta-analysis of research on information technology implementation in small business. Journal of Organizational Computing and Electronic Commerce, 13, 91-121.
PREMKUMAR, G., RAMAMURTHY, K. & CRUM, M. 1997. Determinants of EDI adoption in the transportation industry. European Journal of Information Systems, 6, 107-121.
PREMKUMAR, G., RAMAMURTHY, K. & SREE, N. 1994. Implementation of electronic data interchange: an innovation diffusion perspective. Journal of Management Information Systems, 11, 157-186.
RAYMOND, L. & BERGERON, F. 2008. Enabling the business strategy of SMEs through e-business capabilities: a strategic alignment perspective. Industrial Management & Data Systems, 108, 577-595. ROGERS, E. M. 2003. Diffusion of Innovations, New York, Free Press.
SHAPIRO, C. & VARIAN, H. R. 1999. Information Rules: A Strategic Guide to the Network Economy, Boston, Harvard Business School Press.
SHARMA, S. 1996. Applied Multivariate Techniques, New York, John Wiley & Sons, Inc.
SOARES-AGUIAR, A. & PALMA-DOS-REIS, A. 2008. Why do firms adopt e-procurement systems? Using logistic regression to empirically test a conceptual model. Ieee Transactions on Engineering Management, 55, 120-133.
SON, J. Y., NARASIMHAN, S. & RIGGINS, F. J. 2005. Effects of relational factors and channel climate on EDI usage in the customer-supplier relationship. Journal of Management Information Systems, 22, 321-353.
STRAUB, D. W. & WATSON, R. T. 2001. Research commentary: Transformational issues in researching IS and net-enabled organizations. Information Systems Research, 12, 337-345.
TAN, K. S., CHONG, S. C., LIN, B. S. & EZE, U. C. 2009. Internet-based ICT adoption: evidence from Malaysian SMEs. Industrial Management & Data Systems, 109, 224-244.
THONG, J. Y. L. 1999. An Integrated Model of Information Systems Adoption in Small Businesses. Journal of Management Information Systems 15, 187-214.
TO, M. L. & NGAI, E. W. T. 2006. Predicting the organisational adoption of B2C e-commerce: an empirical study. Industrial Management & Data Systems, 106, 1133-1147.
TORNATSKY, L. & FLEISCHER, M. 1990. The Process of Technology Innovation, Lexington, MA, Lexington Books.
TORNATZKY, L. & FLEISCHER, M. 1990. The Process of Technology Innovation, Lexington, MA, Lexington Books.
W@TCH, E.-B. 2006a. e-Business Decision Maker Survey in European enterprises [Online]. Boon. Available: http://www.ebusiness-watch.org/about/documents/eBiz_Questionnaire_2006.xls [Accessed].
W@TCH, E.-B. 2006b. The e-Business Survey 2006 – Methodology Report [Online]. Boon. Available:
http://www.ebusiness-watch.org/about/documents/DMS2006_Methodology.pdf [Accessed].
W@TCH, E.-B. 2006c. e-Business Survey 2006: e-Business in 10 sectors of the EU economy [Online]. Available: http://www.ebusiness-watch.org/statistics/table_chart_reports.htm [Accessed].
W@TCH, E.-B. 2007. The European e-Business Report. A portrait of e-business in 10 sectors of the EU economy. European Commission.
WEI, T. T., MARTHANDAN, G., CHONG, A. Y. L., OOI, K. B. & ARUMUGAM, S. 2009. What drives Malaysian m-commerce adoption? An empirical analysis. Industrial Management & Data Systems, 109, 370-388.
WHETTEN, D. A. 1987. Organizational growth and decline process. Annual Review of Sociology, 13, 335-358.
WILLCOCKS, L., SAUER, C. & ASSOCIATES 2000. Managing the Infrastructure, London, Random House.
ZHU, K. 2004. The complementarity of information technology infrastructure and e-commerce capability: A resource-based assessment of their business value. Journal of Management Information Systems, 21, 167-202.
ZHU, K., DONG, S. T., XU, S. X. & KRAEMER, K. L. 2006a. Innovation diffusion in global contexts: determinants of post-adoption digital transformation of European companies. European Journal of Information Systems, 15, 601-616.
ZHU, K., KRAEMER, K. & XU, S. 2003. Electronic business adoption by European firms: a cross-country assessment of the facilitators and inhibitors. European Journal of Information Systems, 12, 251-268. ZHU, K. & KRAEMER, K. L. 2002. e-Commerce metrics for net-enhanced organizations: Assessing the
value of e-commerce to firm performance in the manufacturing sector. Information Systems Research, 13, 275-295.
ZHU, K. & KRAEMER, K. L. 2005. Post-adoption variations in usage and value of e-business by organizations: Cross-country evidence from the retail industry. Information Systems Research, 16, 61-84.
ZHU, K., KRAEMER, K. L. & XU, S. 2006b. The process of innovation assimilation by firms in different countries: A technology diffusion perspective on e-business. Management Science, 52, 1557-1576. ZHU, K., KRAEMER, K. L., XU, S. & DEDRICK, J. 2004. Information technology payoff in e-business
environments: An international perspective on value creation of e-business in the financial services industry. Journal of Management Information Systems, 21, 17-54.