Universidade de Aveiro Departamento de Eletrónica,Telecomunicações e Informática 2018
Catarina Isabel
Póvoa Santa Comba
Bengala de apoio a cegos
Cane for the visually impaired
“In the middle of every difficulty lies opportunity.”
Universidade de Aveiro Departamento de Eletrónica,Telecomunicações e Informática 2018
Catarina Isabel
Póvoa Santa Comba
Bengala de apoio a cegos
Cane for the visually impaired
Universidade de Aveiro Departamento de Eletrónica,Telecomunicações e Informática 2018
Catarina Isabel
Póvoa Santa Comba
Bengala de apoio a cegos
Cane for the visually impaired
Dissertação apresentada à Universidade de Aveiro para cumprimento dos requisitos necessários à obtenção do grau de Mestre em Engenharia Eletrónica e Telecomunicações, realizada sob a orientação científica do
o júri / the jury
presidente / president
Professora Doutora Ana Maria Perfeito Tomé
Professora Associada da Universidade de Aveiro
vogais / examiners committee
Professor Doutor Salviano Filipe Silva Pinto Soares
Professor Auxiliar do Departamento de Engenharias da ECT da Universidade de Trás-os-Montes e Alto Douro
agradecimentos /
acknowledgements
José Manuel Neto Vieira por toda a colaboração, disponibilidade e transmis-Em primeiro lugar gostaria de agradecer ao meu orientador, Professor Doutor são de conhecimentos que foram imprescindíveis para a realização deste tra-balho.Agradeço aos pilares da minha vida, os meus pais e a minha irmã, que acre-ditaram em mim desde o primeiro dia. Sou-lhes eternamente grata por todo o suporte e palavras de alento ao longo destes últimos seis anos.
Às minhas queridas amigas Daniela, Sofia e Rita que me acompanharam muito atentamente ao longo de toda esta jornada.
Aos meus colegas do laboratório Eduardo e Pedro que sempre se disponibi-lizaram para me ajudar.
Palavras Chave
Mobilidade; Deficiência visual; Ultra-sons; Impressão 3DResumo
A maior dificuldade que as pessoas cegas e com deficiência visual en-frentam no seu dia-a-dia é serem capazes de se movimentarem de forma independente e segura no exterior. Por forma a serem efetuados os desvios necessários mantendo o trajecto desejado, é necessário que estas consigam detetar correctamente possíveis perigos ou obstáculos. Embora os dispo-sitivos auxiliares de mobilidade tradicionais, como o cão guia e a bengala branca, tenham demonstrado ser ferramentas valiosas e eficazes em diver-sas situações, ainda existem casos em que estes meios não são eficazes. Por este motivo, durante as últimas décadas tem havido um grande inves-timento na pesquisa e desenvolvimento de dispositivos auxiliares de mobili-dade eletrónicos. Na Universimobili-dade de Aveiro nos anos de 2008 e 2009 foram também desenvolvidas duas bengalas eletrónicas que utilizavam ultra-sons para detetar buracos, desníveis e escadas. No entanto, em ambos os protóti-pos foi detetada a existência de acoplamento acústico de sinal entre o trans-dutor emissor e o transtrans-dutor receptor, o que reduzia drasticamente a eficácia de ambos os dispositivos.
Nesta dissertação propõe-se uma solução para este problema usando a im-pressão 3D também conhecida como manufatura aditiva. Esta tecnologia tem vindo a crescer exponencialmente nos últimos anos e ganhando maior destaque em diversos setores nomeadamente na indústria, engenharia e medicina. Neste caso em específico foi usada para produzir vários
protóti-Keywords
Mobility; Visually impaired; Ultrasounds; 3D printingAbstract
The biggest struggle that visually impaired and blind people face on their daily basis is the ability to navigate outdoors independently and safely. In order to make the necessary deviations while maintaining the desired course, it is necessary that visually impaired travellers are capable of correctly detect po-ssible hazards or obstacles. Even though the traditional mobility aids such as the guide dog and the white cane have proven to be valuable and effective tools in many mobility tasks, there are still situations where these means are not effective.
Therefore, in the last decades, there has been a great investment in the re-search and development of electronic travel aids. At the University of Aveiro in the years of 2008 and 2009, were also developed two electronic canes which used ultrasounds to detect holes, drop-offs, and steps. However, in both proto-types, it was detected the presence of acoustic coupling of the signal between the emitter and receiver transducers which reduced drastically the efficiency of both devices.
Thus, in this master thesis, it is proposed a solution to this issue using 3D print-ing also known as additive manufacturprint-ing. This technology has been growprint-ing exponentially in the last years and gaining prominence in several sectors such as industry, engineering, and medicine. In this specific case, it will be utilized
C o n t e n t s
C o n t e n t s . . . .
i
L i s t o f F i g u r e s
. . . .
iii
L i s t o f Ta b l e s . . . .
v
L i s t o f Ac r o n y m s . . . .
vii
1
I n t r o d u c t i o n . . . .
1
1.1
Objectives . . . .
2
1.2
Structure . . . .
2
2
T h e u lt r a s o u n d s . . . .
3
2.1
Historical development . . . .
4
2.2
Applications of ultrasounds
. . . .
5
2.2.1
In industry . . . .
5
2.2.2
In medicine . . . .
6
2.2.3
In nature . . . .
6
2.3
Measurement of distances using ultrasounds . . . .
8
2.4
Acoustic coupling of the signal . . . .
10
3
E l e c t r o n i c T r av e l A i d s
. . . .
13
3.1
Developed ETAs . . . .
14
3.1.1
Navbelt . . . .
14
3.1.2
The Voice . . . .
15
3.1.3
Guidecane . . . .
15
3.1.4
Blind-guide cane based on multi-sensors . . . .
16
3.1.5
Electric Long Cane (ELC) . . . .
17
3.1.6
FIU Project . . . .
17
3.1.7
CyARM . . . .
18
3.1.8
EPFL project . . . .
19
3.1.9
Blavigator . . . .
19
3.1.10 Hole-detecting cane for the visually impaired (v2008 and v2009)
. .
19
3.2
Commercial products . . . .
21
3.2.1
The Ultracane
. . . .
21
3.2.2
Miniguide . . . .
21
4
Ac o u s t i c t e c h n i q u e s f o r d i r e c t c o u p l i n g ’ s r e d u c t i o n . . . .
23
4.1
Testing system . . . .
24
4.1.1
Software and Harware used . . . .
24
4.1.2
Operation of the test system
. . . .
28
4.2
3D supports designed to reduce the acoustic coupling . . . .
30
4.2.1
Version 1 . . . .
30
4.2.2
Version 2 . . . .
33
4.2.3
Versions 3 and 4 . . . .
35
4.2.4
Version 5 . . . .
37
4.2.5
Individual supports . . . .
44
4.2.6
Version 6 . . . .
47
4.2.7
Version 7 . . . .
52
4.2.8
Version 8 . . . .
56
5
C o n c l u s i o n s . . . .
59
5.1
Future work . . . .
60
R e f e r e n c e s . . . .
61
ii
L i s t o f F i g u r e s
2.1
Ultrasonic cleaner. Source:[21] . . . .
5
2.2
Ultrasound image of a fetus at 12 weeks of pregnancy. Source:[23] . . . .
6
2.3
Representation of echolocation of bats. Source:[28]
. . . .
7
2.4
Operating principle of a ultrasonic sensor. Adapted from:[30]
. . . .
8
2.5
Transducer’s operation. Adapted from:[31]
. . . .
9
2.6
Measurement of distances using ultrasounds. . . .
10
2.7
Pulse sent and received echo affected with acoustic coupling. . . .
10
2.8
Output of the matched filter.
. . . .
11
2.9
Model of the three sources of the acoustic coupling. . . .
11
2.10 Real model of the acoustic coupling.
. . . .
12
3.1
Transducer’s operation. Source:[33]
. . . .
14
3.2
Typical set-up of the vOICe system. Source:[34] . . . .
15
3.3
GuideCane prototype. Source:[35] . . . .
15
3.4
Positioning of the ultrasonic sensors. Source:[2]
. . . .
16
3.5
Proposed prototype and its detection range. Source:[2]
. . . .
16
3.6
Handle of the Electric Long Cane. Source:[37]
. . . .
17
3.7
FIU project prototype. Source:[38]
. . . .
18
3.8
CyARM system. Source: [39]
. . . .
18
3.9
System arquitecture. Source:[40] . . . .
19
3.10 Prototype of v2008. Source:[5] . . . .
20
3.11 Test field of the v2009. Source:[5]
. . . .
20
3.12 The handler of the Ultra Cane. Source: [43]
. . . .
21
3.13 The second version of the Miniguide. Source: [44] . . . .
22
3.14 The K Sonar Cane. Source: [45] . . . .
22
4.1
MA40S4S/R Murata transducer.
. . . .
25
4.2
First step to setting up the sound card to record ultrasounds.
. . . .
26
4.3
Second step to setting up the sound card to record ultrasounds.
. . . .
27
4.4
Front view of the sound card.
. . . .
27
4.5
Back view of the sound card.
. . . .
28
4.6
Setup used.
. . . .
28
4.7
3D model of the first support.
. . . .
30
4.8
First 3D support printed.
. . . .
31
4.9
Setup used to test the first version of the transducer support.
. . . .
31
4.10 First pulse sent and received signals using the 1st version of the 3D support. . .
32
4.12 Mid plane of the second version with respective measures.
. . . .
33
4.13 First pulse sent and received signals using the 2nd version of the 3D support.
.
34
4.14 3D model of the third version and printed part (respectively).
. . . .
35
4.15 3D model of the forth version and printed part (respectively).
. . . .
35
4.16 Geometric construction for applying Huyghens’principle. Source:[48]
. . . .
38
4.17 Apperture distribution and its respective angular spectrum. Source:[48] . . . . .
39
4.18 Radiation pattern of the ultrasonic transducer in function of w
λ.
. . . .
39
4.19 3D model of the fifth version.
. . . .
40
4.20 Mid plane of the fifth version.
. . . .
41
4.21 Printed part of the fifth version. . . .
41
4.22 Printed part of the fifth version with upholster foam between the emitter and
receiver truncated cones.
. . . .
42
4.23 3D model of the individual supports and printed parts (respectively). . . .
44
4.24 Mid plane of the individual supports. . . .
44
4.25 Setup used to test the individual supports. . . .
45
4.26 Positioning of the individual supports in the stands.
. . . .
45
4.27 First pulse sent and received signals using the individual supports of the transducers.
46
4.28 3D models of the two 3D supports of the version 6 and their dimensions. . . . .
47
4.29 Main support of the 6th version.
. . . .
48
4.30 Individual supports of the 6th version.
. . . .
48
4.31 Assembly of the sixth version.
. . . .
49
4.32 First pulse sent and received signals using the sixth version of the 3D supports.
50
4.33 6th version with a piece of upholstery sponge between the two transducers.
. .
50
4.34 First pulse sent and received signals of the 6th version with a piece of upholstery
sponge between the transducers. . . .
51
4.35 3D models of the two 3D supports from the version 7 and their dimensions. . . .
52
4.36 Main support of the version 7. . . .
53
4.37 Individual transducers supports of the version 7.
. . . .
53
4.38 Assembly of the seventh version.
. . . .
54
4.39 First pulse sent and received signals using the seventh version of the 3D supports.
54
4.40 Upholstery sponge on the back of the transducers.
. . . .
55
4.41 Assembly of the seventh version.
. . . .
56
4.42 First pulse sent and received signals using the eighth version of the 3D supports.
57
4.43 Upholstery sponge on the back of the transducers.
. . . .
57
L i s t o f Ta b l e s
4.1
Maximum value in modulus of the recorded audio signal from version 1. . . .
32
4.2
Variance and maximum value in modulus of the recorded audio signal from version 2. 34
4.3
Maximum value in modulus of the recorded audio signal from version 3. . . .
36
4.4
Maximum value in modulus of the recorded audio signal from version 4. . . .
36
4.5
Maximum value in modulus of the recorded signal in the 5th version without
upholster foam. . . .
42
4.6
Maximum value in modulus of the recorded signal in the 5th version with upholster
foam. . . .
43
4.7
Maximum value in modulus of the recorded audio signal of the individual supports. 46
4.8
Maximum value in modulus of the recorded audio signal. . . .
49
4.9
Maximum value in modulus of the recorded audio signal. . . .
51
4.10 Maximum value in modulus of the recorded audio signal. . . .
54
L i s t o f Ac r o n y m s
CAD Computer Aided Design CAE Computer Aided Engineering CAM Computer Aided Machining ETA Electronic Travel Aids FDM Fused Deposition Modeling HIFU High Intensity Focused Ultrasound
MATLAB MATrix LABoratory STL Stereolithography TOF Time of flight USB Universal Serial Bus VI Visually impaired
c h a p t e r
1
I n t r o d u c t i o n
According to statistics from the World Health Organization, it is estimated that globally 1.3 billion people are visually impaired (VI), out of which 39 million are blind and 217 million have moderate to severe vision impairment [1].
On the daily basis, blind and visually impaired people face several accessibility and mobility problems while navigating. These problems are related with avoiding obstacles, locating position, finding a pathway and accessing information.
Thus, the need for navigation assistants will always be a constant. Nowadays the white cane and the guide dogs are the most used ones, however, each one of these solutions has its own limitations. To start with, the traditional white cane only provides information on a range of 0.5 meters and it cannot sense any obstacles above the waist level since it requires contact with the obstacles to sense them. On the other hand, there are the guide dogs which are expensive, need an extensive training and ultimately, they have a shorter life than humans[2][3].
Over the past decades, many researchers with the development of the radar and sonar technologies have worked on devices to aid blind people. These devices are called Electronic Travel Aids (ETA). The ETA acquire information about the surrounding environment which would be normally obtained through the visual sense and convert it into information that can be heard or felt by blind people. In other words, these devices are meant to help blind people to overcome problems related to spatial and geographical orientation during their everyday activities. Unfortunately, until these days none of the developed devices have been accepted in the blind community due to the various challenges inherent when using these tools in the real world. Most of these devices, in addition to having an excessive weight and size, had a poor performance and, often the information provided was not reliable or did not suit the needs of the visually impaired at the current situation.
To tackle these issues, in the University of Aveiro were also developed in the years of 2008 and 2009 two ETA, more specifically, two electronic white walking sticks that used ultrasounds to detect obstacles and holes on the ground [4][5]. However in both prototypes it was detected the presence of the acoustic coupling between the ultrasound emitter and receivers. This phenomenon appears whenever a receiver transducer detects a ultrasound signal that is not reflected from its intended target but caused by acoustic coupling. As a consequence, it caused false distance measurements thus reducing the efficiency of both prototypes. The ultrasound waves which originates this effect can be propagated throught the air, by mechanical means and throught the rear of the emitter transducer.
1.1
objectives
The aim of this dissertation is to solve the problem of the acoustic coupling of the signal between the ultrasonic transducers. To meet this need, the proposed solution involves the use of 3D printing. 3D printing or additive manufacturing are general terms used to designate a wide variety of technologies that allow the creation of objects based on a digital model. These technologies provide countless possibilities and advantages when compared to the traditional methods of manufacturing. This tool enables the creation and full customization of products according to specific needs and requirements that would be difficult to obtain using other production methods.
Although the access to 3D printers for a common citizen is quite restricted, these are already used in some educational institutions namely in the University of Aveiro where the first Portuguese 3D printer was created [6]. In laboratory applications, this tool has many advantages since it allows to produce custom-made pieces in a fast and efficient way.
In this particular case, 3D printing will be used in the creation of transducer supports to prevent ultrasounds from propagating directly from the emitter transducer to the receiver transducer. Having this in mind, it will also be studied the ideal configuration of these supports and which materials can be used in order to eliminate this negative effect.
1.2
structure
This document was divided into five chapters and a brief description of each one is given below. • Chapter 1 - The current chapter presents a framework of the theme of the master thesis as
well as the objectives established and the technology used.
• Chapter 2 This chapter begins by introducing a brief description of the discovery and develop-ment of ultrasounds in the last decades until now. Afterwards, some applications of ultrasounds in industry, medicine and nature are presented. Considering the concept of echolocation it is explained how distances can be measured using ultrasounds. Lastly, it is presented a more detailed description of the acoustic coupling and its origins.
• Chapter 3 - In this chapter are presented some of the various electronic aid devices developed during the last decades and, some commercial versions which are still available for sell in the market.
• Chapter 4 In this chapter, an analogy is made between the simulation process and the development of prototypes using 3D printing. This chapter is devoted entirely to the experimental process, including the choice of transducer supports to be printed, the software and hardware used, the tests performed, and the decisions made during the experiments. The final prototype is also presented.
• Chapter 5 - This chapter focuses on the conclusions drawn from the work done as well as some considerations about future work.
c h a p t e r
2
T h e u lt r a s o u n d s
According to Oxford’s Physics dictionary, the sound is "a vibration in an elastic medium at a frequency and intensity that is capable of being heard by the human ear. The frequency of sound lies in the range 20-20000 Hz[...]"[7]. Sound waves with a frequency below 20 Hz are classified as infrasounds and those with a frequency beyond the upper limit are referred to as ultrasounds or ultrasonics.
Even though ultrasounds are not used in oral communication between human beings, these are utilized in a wide range of applications such as medicine and industry. Ultrasonic applications can be divided into two distinct categories: low and high power ultrasonics. Concerning low power ultrasonics, these are used as a way of studying materials or as a method of control[8]. This is accomplished without any structural changes in the propagating material. A widely known example is medical imaging. On the other hand, the function of high power ultrasonics is to modify the material in which the ultrasonic wave is propagating. High power ultrasonics are used per example in medical therapy, surgery and, ultrasonic cleaning.
The focus of this chapter are the ultrasound waves starting with a brief introduction of the historical development of these sound waves and the respective applications throughout the past centuries.
Afterwards, in section 2.2 are introduced some of the current applications of the ultrasounds in the industry and in medicine and their advantages. At the end of this section are also presented some animals that use their ability to emit ultrasounds to move around and communicate.
The function of the ultrasound transducers and the method of measuring distances using ultrasounds are explained in section 2.3.
This chapter finishes in section 2.4 with a more detailed description of the problem which originated this master thesis, that is, the acoustic coupling between the emitter and receiver transducers.
2.1
historical development
It it not known the moment at which the human being became aware of the existence of sounds above their limits of hearing since there are no records of investigation before the 19th century. Although the study of ultrasound has only begun in that century it can be said that the next 100 years were crucial to create foundations for the growth and development of ultrasounds in the 20th century. The two major discoveries that had a dominant impact on the 20th century ultrasonics, were made during the 19th century. The first was made by Joule in 1847 who discovered magnetostriction, which means, changing the dimensions of a ferromagnetic material such as iron or nickel when subjected to a magnetic field. The second occurred in 1880 when the Curie brothers discovered piezoelectric properties in some crystals. Piezoelectricity refers to electrical charges that are developed in some types of crystals when subjected to pressures or tensions [9][10]. Thanks to the discovery of piezoelectricity and magnetostrictive effects it was then possible to generate and detect ultrasounds.
In 1912 after the sinking of the Titanic there were several scientists who sought to discover acoustic ways to detect submerged obstacles. However, the study of ultrasounds as a specific branch of science only began during World War 1 due to the need of Allied forces to detect German submarines[10].
It was only by the end of the First World War that a former student of Pierre Curie named Paul Langevin invented the quartz ultrasonic transducer. He thus became the father of the underwater SONAR and his ideas were extensively utilized by the Americans and the French[11][12][13].
The sonar, also called Anti-Submarine Detection Investigation Commitee (ASDIC), consisted on a transmitter that would sent a sound wave through the water. If the wave hit any target it would be reflected and detected by a receiver. The time between sending the sound wave until receiving the reflection allowed to calculate the range to the target [14][15].
Between the two wars, the main focus was directed towards the development of ultrasounds of high intensity including whistles, electric spark-devices, and sirens [16]. It is necessary to highlight the work developed by Wood and Loomis during this period in the study of the effects of intense ultrasounds[9]. Between 1927 and 1939 there was an immense application of high-intensity ultrasounds in the most diverse fields.
During the years 1940-1955, there was a great development of the technology. They include [17][18]: • Development of the modern horn transducer by Mason in 1950;
• Appearance of the concept of a prestressed sandwich transducer;
• Appearance of major processes like ultrasonic cutting, cleaning, soldering and metal welding; • Discovery of ultrasonic drilling and cleaning;
• Ultrasonics for medical purposes such as ultrasonic therapy. Ultrasounds were also used for diagnostic purposes.
Since 1970, ultrasonic technologies suffered rapid and extensive advances due to a significant improvement of theoretical analysis [9]. In the field of high frequency, it stands out the invention of the ultrasonic scanning microscope by Lemons and Quate in 1974 [10]. Between 1970 and 1980 in medical ultrasounds, it was possible to scan a fetus in a pregnant woman as well as measuring the blood flow [19].
2.2
applications of ultrasounds
2.2.1
in industry
In the industry, the oldest and most important commercial application of ultrasounds is the ultrasonic cleaning. This process is composed by a tank filled with a proper cleaning fluid under which are connected piezoelectric transducers calibrated to oscillate at a given frequency. By applying an alternated current to the piezoelectric crystals, vibrations are generated in the tank and consequently, all the material in its interior is cleaned up. The main advantage of this process over the tradicional ones like brushes is that it can reach places otherwise inaccessible [20].
Figure 2.1: Ultrasonic cleaner. Source:[21]
Another major industrial application is the welding of thermoplastics which is considered to be fast, clean and easily automated. This process requires very high intensities, generally up to 90kHz and, it is primarily a thermal operation allied with a steady pressure and a large oscillatory amplitude. In plastic welding, the plastic at the target join is melted and consequently, the two parts are joined. It is often used in the production of plastic toys, sealing of plastic bottle caps and manufacture of electrical goods.
In the last years, ultrasonic cutting has been utilized in a variety of industries since it allows a highly precise cut in several kinds of material such as bones, multi-layered fabrics and even confectionery. This technique reduces the amount of waste produced as wells as the process time comparatively to conventional methods. Since the middle of the 1990s, ultrasonic cutting has been used in the food industry because some goods can be extremely difficult to cut by non-ultrasonic cutting methods due to their texture and structure [22].
Besides ultrasonic cutting of food, the use of this technology in the food industry also includes food preservation. In this case, ultrasonic waves are utilized to break down bacterial cell walls. The application of ultrasonics in this process significantly reduces the amount of chemicals or heat added to the food.
Lastly, ultrasonic waves can be used to test components non-destructively, more specifically, to detect internal flaws or discontinuities within ferrous or non-ferrous materials.
2.2.2
in medicine
Medical applications of ultrasounds can be divided into 2 distinct groups: diagnosis, also called sonography, and therapy [9].
In medicine, in the diagnosis category, it can be found one of the most important applications of the ultrasounds which is the ultrasound. Through this technology, it is possible to obtain images of internal organs and tissues and thus evaluate their condition. Nowadays, it is used as a complement to x-ray exam due to its ability to detect details that go unnoticed by the x-rays. Since ultrasound does not use ionizing radiation it does not bring any risks to the health of patients.
Figure 2.2: Ultrasound image of a fetus at 12 weeks of pregnancy. Source:[23]
On the other hand, the therapy uses high-intensity waves to cause physical changes in the patient in order to improve their health [9]. An innovative therapeutic technique is the HIFU also known as High Intensity Focused Ultrasound. This procedure was originally used to treat prostate cancer and uses high-frequency ultrasounds to destroy cancer cells through thermal absorption[24]. The duration of each session can vary between 1-30 seconds[25]. Ultrasounds also have been used in rheumatology since the heat caused by these waves favors the regeneration of the tissues, as well as, the muscular strengthening of the damaged area.
2.2.3
in nature
In nature, there are several animals capable of hearing and producing ultrasounds. It was back in 1794 that Lazzaro Spallanzani first found out the ability of bats to navigate across obstacles in the dark or even blindly. However, it was only in 1938 that Pierce and Griffin detected the ultrasonic signals produced by bats. In the next 20 years along with other collaborators, they continued to study this phenomenon and since then a lot of information has been discovered regarding echolocation [26]. Echolocation, also called bio sonar, is a physiological process used by some animals to detect and localize obstacles. Echolocation in animals consists of the production and emission of a series of ultrasonic pulses and through the received echoes, of their strength and delays perceive the distance to the obstacles[27].
One of the animals best known for its echolocation capability is the bat. Bats produce echolocation calls through their mouths and sometimes through their noses and through the reflected echoes they can create an acoustic map of the objects around them [28]. Their ears have also a very important function because they can move dynamically in order to improve the detection of echoes in specific directions [29].
Figure 2.3: Representation of echolocation of bats. Source:[28]
Sea animals are also known for their echolocation capabilities. Many toothed whales species, such as dolphins, produce short clicks(50-100 µs) for hunting and acquire information about the surrounding environment. Marine animals are at advantage over terrestrial animals since the attenuation in water is smaller than in the air, which leads to an increase in the range of location [10].
2.3
measurement of distances using ultrasounds
The heart of any ultrasound system is the transducer which is a device capable of transforming a type of energy into another, in this case, electric energy into mechanical energy and vice versa. The most commonly used type of transducer is the piezoelectric transducer. This transducer contains a crystal that vibrates when a voltage is applied thus generating a particular frequency response.
A simple and effective way of measuring distances is through ultrasonic sensors. These sensors use the concept of echolocation to calculate relative positions of obstacles. Echolocation consists of the determination of time of flight (tof), ie the time elapsed between the emission of the sound waves and the arrival of the echo.
Figure 2.4: Operating principle of a ultrasonic sensor. Adapted from:[30]
Thus, when transmitting an ultrasound pulse it is possible to calculate the distance to an object by measuring the time t in seconds taken for a reflected echo to be received. Considering that the measured time corresponds to the outward and return paths, the distance d in meters is given by (2.1):
d = t ∗ c
2 (2.1)
where, c is the velocity of sound as it propagates through an elastic medium.
Sound speed is also closely related to the density of the medium in which it propagates, per example, the speed of sound is lower at denser materials. Another factor that affects the velocity of sound is temperature. The relationship between sound speed and temperature T is given by the formula (2.2):
c = 331.4 + 0.6T (2.2)
Thus, at room temperature, the velocity of the sound is about 344 m/s.
Although the process of measuring distances with ultrasounds is quite simple, there are other factors which need special attention since they can affect the measurements.
To begin with, the transducer has a minimum sensing range also known as the blind zone. This corresponds to an area in front of this device where it is not possible to obtain a reliable measurement because even after the signal transmission is complete, the transducer continues to vibrate. Therefore, it is not possible to receive any echo immediately after to avoid coupling between both signals. In figure 2.5 it is possible to visualize the blind zone, as well as, the sensing range where the detection of objects is possible.
Figure 2.5: Transducer’s operation. Adapted from:[31]
Lastly, attenuation and reflection phenomenons can also affect the correct obtainment of a distance d due to the following factors:
• Dimensions of the object
The higher the target the higher the reflected wave energy and consequently the greater the detection distance possible;
• Materials
Wood, metal, concrete, glass and paper objects can reflect approximately 100% of the ultrasonic waves. On the other hand, clothing, cotton and wool are very difficult to detect since they absorb some of the ultrasounds. These can only be detected short distance;
• Surface of target
Objects with irregular or porous surfaces such as felt or sponge cause the dispersion of the beam and therefore may not be detected.
2.4
acoustic coupling of the signal
The acoustic coupling of the signal occurs when two ultrasonic transducers, one emitter and one receiver, are in close proximity and part of the signal being transmitted leaks to the receiver transducer. Since it is not possible for the receiver to know that the signal acquired is not a reflected echo, the time of flight measured is incorrect and consequently, it is not possible to detect obstacles accurately. Therefore, this phenomenon has negative effects on the performance and response of the transducers. In figure 2.6 is represented the principle of distance measurement using two ultrasonic transducers, where the transducer T represents the transmitter and R is the receiver.
Figure 2.6: Measurement of distances using ultrasounds.
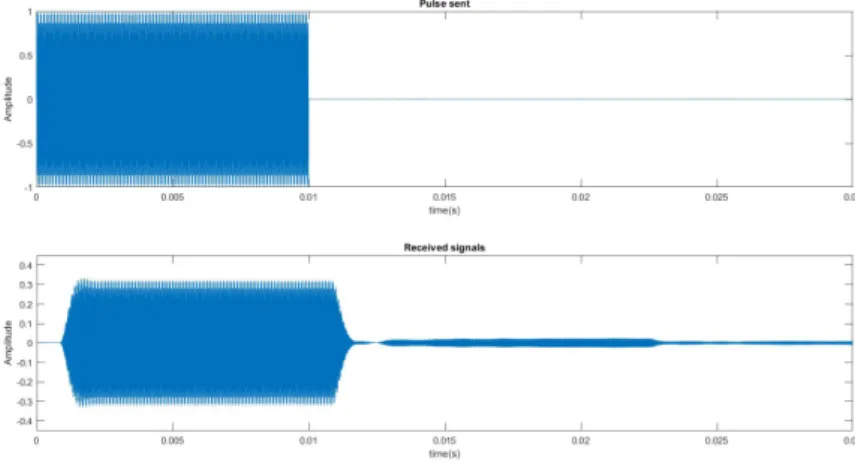
The presence of the acoustic coupling of the signal can be observed in figure 2.7, where the first pulse corresponds to this negative effect and the second one to a reflected echo.
These signals were acquired using one of the several 3D supports designed throughout this work when the transmitter transducer was sending a short pulse. As it can be seen the pulse corresponding to the acoustic coupling remains approximately constant throughout the time.
Figure 2.7: Pulse sent and received echo affected with acoustic coupling.
The problem inherent to the acoustic coupling becomes more perceptible when applying a matched filter. These filters are typically used in radar for distance measurement and are obtained by correlating a known signal with an unknown signal. The aim of the matched filters is to detect the presence of the known signal in the unknown signal.
In this specific case a matched filter was obtained by correlating the pulse sent from figure 2.7 with the respective signals received. If the output of the filter exceeds a certain threshold it can be concluded that the received signal is in fact a reflected echo. In figure 2.8, it is notorious that the magnitude of the acoustic coupling is superior comparatively to the magnitude of the reflected echo. Thus, it is not possible to correctly detect the presence of obstacles. On the other hand, if the echo arrives too early, both the acoustic coupling and the echo signals overlap making it also impossible to accurately detect obstacles.
Figure 2.8: Output of the matched filter.
In figure 2.9 is portrayed the acoustic coupling between the two ultrasonic transducers. As stated in the Introduction, the ultrasound signal that originates this phenomenon can reach the receiver by three different means which are represented by H1(s), H2(s) and H3(s).
The H1(s) illustrates the acoustic coupling through the rear of the transducers, the H2(s) refers to
the acoustic coupling with mechanical origin and H3(s) corresponds to the acoustic coupling through
the air.
The figure 2.10 presents one of the many versions of the 3D supports created and in which it is represented the three different ways in which the ultrasound signal propagates. Once again, the upper transducer corresponds to the transmitter and the lower one to the receiver.
Figure 2.10: Real model of the acoustic coupling.
The acoustic coupling through mechanical means H2(s) results from the mechanical interference of
the transmitter transducer relatively to the receiver transducer. The emitter transducer during pulse transmission vibrates and consequently, this vibration propagates through the structure between the two transducers being eventually transferred to the receiver transducer.
On the other hand, the acoustic coupling through the air H3(s) results from the radiation patterns
of the emitter and receiver transducers. Since their radiation diagrams aren’t zero for 90◦it occurs interference between both transducers which causes the frontal acoustic coupling.
Finally, on the back of the emitter, there may be signal losses during signal transmission which can be detected by the receiver causing the acoustic coupling through the rear of the transducers H1(s).
c h a p t e r
3
E l e c t r o n i c T r av e l A i d s
When in movement, blind and visual impaired people face several challenges to get from one place to another safely, efficiently and with dignity. One of their biggest difficulties is avoiding obstacles along the way. These obstacles include stationary objects like posts, walls, and vehicles and also moving objects such as pedestrians or even hazards such as steps or icy patches. Another challenge is related to spatial localization and the establishment of a route to follow in order to go from the current location to the desired destination.
In that sense, given the limitations associated with traditional navigation assistants, several electronic aid devices have been developed throughout the last four decades. These devices can be classified as primary or secondary aids. The primary aids are devices which can be used alone since they provide enough information for the user to move around safely and independently. The most widely known primary aids are the guide dogs and the white cane. In addition to these two familiar examples, there are also the LaserCane and the K-sonar which will be later presented in this section. Regarding the secondary aids, these cannot be used by themselves because the information which they provide isn’t sufficient for the user to move around without the risk of being hurt.
These devices besides providing spatial information about the environment in which the visually impaired person is, must also satisfy some requirements. One of the biggest concerns of the blind people is related to the appearance and characteristics of the ETA. These devices should be discrete, light-weighted and preferably consist of a single unit. Besides these aspects, it is also required that these are robust enough to be used both on outdoors and indoors, as well as, being capable to withstand different weather conditions. Concerning the operation mode of these aids, it is essential that they are easy to use and do not require an extensive period of training. It is also fundamental that their maintenance is simply to execute. Of all the requirements listed above, the one that is considered by the blind community to be the most important is the consistency of the information. This means that the information provided to the user at the equivalent time and at the same location must be the same otherwise the blind people will quickly dismiss the aid device [32].
This chapter presents some of the most important developed ETA with a brief description of each one of them. These systems are organized based on the type of the information which they provide to the blind user. The first two provide audio feedback and the following eight use tactile information. Finally, at section 3.2, a representative selection of electronic aid devices which are still available in the market are presented.
3.1
developed etas
3.1.1
navbelt
NavBelt was developed in the University of Michigan and, it is a guidance system which includes a belt with an array of ultrasonic sensors mounted on it, a small portable computer and stereophonic headphones. This device uses navigation and obstacle avoidance technologies which were originally designed for robots.
The computer receives the information from the eight ultrasonic sensors and creates an angle map and the corresponding distance of any obstacle at each angle. Afterwards, the information is transmitted to the user through the stereo headphones and the obstacle avoidance algorithm produces the sounds corresponding to each mode. The NavBelt has two different operational modes based on the type of information offered to the blind user: the guidance and the image mode. In the guidance mode, the computer knows the blind user final destination and guides him in terms of the direction to follow. On the other mode, it is created a panoramic virtual image of the environment in which, eight tones with different amplitudes ae played successively from eight different virtual direction. Then, these maps are translated to sounds which are heard and interpreted by the user [33].
This system besides having an voluminous size, it also requires extensive periods of training so that the blind person is be capable of understanding the guidance signals.
Figure 3.1: Transducer’s operation. Source:[33]
3.1.2
the voice
The vOICe system is a software which claims being able to substitue sound for low-vision. This software can be run on any computer with a camera and, it works by converting the pictures captured from the camera into a sound mapping. The alert messages consist on a series of beeps and whistles which are sent directly to the user through a pair of headphones [32].
Figure 3.2: Typical set-up of the vOICe system. Source:[34]
The system is light-weighted, discrete and easy to wear but it blocks both visually impaired ears. Other than that, it requires an extensive period of training so that the user is able to interpret the different sound patterns [34].
3.1.3
guidecane
GuideCane was developed in the University of Michigan’s Mobile Robotics Lab and is an update of NavBelt [33].
This device has the same components and algorithms of the Navbelt with the difference that the ultrasonic sensors are mounted on the main device which has wheels. There is also a cane which is attatched with the main device allowing the blind user to push it through along the way. The principle of operation is quite simple: when an obstacle is detected the obstacle avoidance algorithm changes the direction of the cane.
The GuideCane analyzes automatically each situation which translates into a period of training almost nonexistent. Even so, it is only capable of scanning a small area and the prototype is still hight weighted and hard to carry around [34]. The prototype sketch is visible in figure3.3.
3.1.4
blind-guide cane based on multi-sensors
It was developed by Yiting Yng and Lunfu Dog in 2015 a guidance system for blind people, able of detecting obstacles not only at the front of the user but also overhead [2].
This device consists on a cane with three ultrasonic sensors and a microcontroller. In figure 3.4 is possible to see the positioning of these sensors, where two of them are meant to detect obstacles in front and the remaining sensor is able to detect obstacles overhead. The microcontroller manages all the transmitted and received signals and based on the decision-making algorithm in case of existing an obstacles it alerts the blind user through vibration or an audio message.
The tests performed demonstrated that this device is capable of accuratly detect objects however its maximum range is only of two meters [36].
Figure 3.4: Positioning of the ultrasonic sensors. Source:[2]
Figure 3.5: Proposed prototype and its detection range. Source:[2]
3.1.5
electric long cane (elc)
In this protoype named as electric long cane(ELC), it was developed an improved version of the traditional white cane [37]. The ELC contains an electronic sensor in the handle of the cane which enables the detection of obstacles above the waistline of the blind person. All the eletronics such as the micromotor, the battery and the microcontroller are also embedded in the handle of the ELC.
When an object is detected by the sensors, a mechanical vibration caused by the micromotor alerts the user about a possible collision. The frequency of vibration increases as the object gets closer.
This device was tested on eight visually impaired people and proved to be effective at detecting several types of physicals barriers wich were located above the waistline. However, since its a navigation device, it is still necessary the usage of another aid which can provide orientation to the blind user [36].
Figure 3.6: Handle of the Electric Long Cane. Source:[37]
3.1.6
fiu project
This project was developed at Florida International University (FIU) and uses a pocket computer to generate 3D spatialized sounds and, according to the readings obtained from a multidirectional sonar system it is capable of detecting obstacles around the blind user.
It formed of two modules: a sonar composed by six ultrasonic range sensors which detects obstacles in six radial directions and, a pocket computer containg a software capable of processing the information coming from the sonar and headphones [38].
In order to associate the signals with the directions being explored by the sonar modules, Head Related Transfer Functions (HRTF) are used. This way, the user is capable of creating a mental image of his surroundings and thus avoiding possible obstacles [34].
Figure 3.7: FIU project prototype. Source:[38]
This project was tested inside the Engineering Center at FIU by four blind-folded individuals. Although the obtained results were promising, the navigation speed was rather low. The system though being wearable is not ergonomic and pratical.
3.1.7
cyarm
CyARM is an electronic aid device developed by researchers in Japan that measures and calculates the distance to an obstacle using an ultrasonic sensor [39].
The blind user is alerted of the presence of the obstacle through a tension apllied to a wire that is attached to him (e.g. his belt). The closer the object, the greater the tension that will be. The system is composed of a microcontroller that processes the information and a motor which controls the tension applied.
Figure 3.8: CyARM system. Source: [39]
As strong points, the system has a high detection rate in terms of static obstacles and it is easy to use [34]. On the other hand, for dynamic object the detection rate rapidly decreases and also implies a constant movement to sense the environment.
3.1.8
epfl project
This system consists on a wearable device capable of detecting obstacles at the shoulder height using a stereoscopic sonar. The protype is composed by sonar sensors, a microcontroller, eight vibrators and a calibration console (PDA). The information is gathered by the sonar sensors placed on the shoulders of the user and sent to the microcontroller which calculates the distances to the obstacles. The user then receives a vibro-tactile feedback of the position of the nearest obstacles [40].
Figure 3.9: System arquitecture. Source:[40]
The system main advantages are associated to its low height, power-consumption and cost. Since it is a hands-free device it allows the user to use a traditional cane, a guide dog or any other device [34]. However, this system was not tested on visually impaired people and in some cases it detected the users hands as an obstacle.
3.1.9
blavigator
At the University of Trás-os-Montes e Alto Douro a navigation system for blind people named as Blavigator has been developed [41]. The purpose of this system is to guide the blind user until the desired destination by providing contextual information about his surroundings.
Blavigator consists of a cane that contains an antenna, a RFID reader and a small box containing all the electronic components.
In order to provide spatial information about indoor and outdoor environments, this system uses different technologies such as GPS, RFID, and Wi-Fi [42].
3.1.10
hole-detecting cane for the visually impaired (v2008
and v2009)
As described in the Introduction, in 2008 at University of Aveiro it was developed the first prototype of a cane capable of detecting holes, drop-offs and steps [4]. For that purpose, this cane used ultrasound transducers and in case of danger it alerted the user through vibrations. In this version, photovoltaic solar cells were added to the cane to reduce the power-comsumption of the prototype and also to prevent the user from being worried about charging the batteries on a daily basis. In figure 3.10 is
possible to see the prototype from this version, noticing that all eletronic elements were placed inside an external box.
Figure 3.10: Prototype of v2008. Source:[5]
The main drawbacks from this device are related to its excessive weight and to the slow detection algorithm.
In 2009 a whole new prototype was developed which was way lighter and practical compared to the 2008’s version. The solar panel was removed, a smaller box containing the electronic components was mounted in the cane and, the obstacle detection algorithm improved.
Futhermore, it were performed test fields to test the viability of the new prototype. The device proved to be an useful tool in walking down stairs and was able of detecting all drop-offs and holes on time. However, in irregular surfaces such as portuguese sidewalk, carpet and grass were detected several false positives. In the figure 3.11 it is possible to see the v2009 being tested by blind people.
Figure 3.11: Test field of the v2009. Source:[5]
3.2
commercial products
3.2.1
the ultracane
The UltraCane is a primary mobility aid, which combines a cane with two ultrasonic sensors built into the handle of this device. One of the sensors is meant to sense the obstacles straight ahead on a range of 2 to 4 meters and, the other one to detect obstacles ahead and upwards up to 1.5 meters. Thanks to the two vibrating buttons present on the handle, it provides tactile feedback to the VI user by varying the intensity of the vibration according to the distance from the obstacle [36][43].
One of its positive aspects is the adaptation period which tends to be short if the blind person is already used to the traditional white cane. Futhermore, besides providing additional information comparatively to the white cane it also leaves the user with a free hand which is an important aspect for the majority of the visually impaired people. This device is available for sale in 10 standard lenghts from 105 cm to 150 cm in the UK and EU with a cost of 635£ [43].
Figure 3.12: The handler of the Ultra Cane. Source: [43]
3.2.2
miniguide
The Miniguide is a small device designed to be used as a complement to a traditional cane or the guide dog. This contains two transducers, one transmitter to emit short ultrasonic pulses and a receiver to acquire the reflected echoes.
In the begining, there were two distinct versions of this device based on the type of output provided to the user. One version provided an audio output and the other one provided an vibratory output. Since then, these two outputs have been combined resulting on a single device in which the output can be selected alternately. In the audio mode, the Miniguide beeps in order to alert the user of the presence of an obstacle and, the pitch of the beep depends on the distance from the obstacle. On the other hand, in the vibration mode a farther object will traduce on a slow rate of vibration and a close object results in a rapid vibration. Besides that, it has multiple operation modes of detection ranges which makes it appropriate for different environments.
The main strenghts of the Miniguide are related to its flexibility and versability. However, this device can not detect the existence of holes or steps and, since its a complement to the tradicional navigation assistants it leaves the user wihout an empty hand[32].
Figure 3.13: The second version of the Miniguide. Source: [44]
3.2.3
k-sonar
The K-Sonar is an ultrasonic sensing device that can be attached to the traditional white cane to increase the independence of blind people. Besides the ultrasonic sensor, it is also constituted by a microprocessor that converts the distances into sound signals that are heard by the user through the earphones. These audio warning signals vary according to the distance from the obstacles, that is, high-pitch sounds are associated with distant obstacles and low-pitch sounds to near obstacles [34]. Through these sound associations users are able to identify different obstacles and gather spatial information about the surroundings. One positive aspect of this device is that it can be easily detached from the white cane and used independently. However, similarly to happens with others sonar devices, occasionally the distances measured are incorrect due to the interference phenomenon caused by environmental sources [32].
Figure 3.14: The K Sonar Cane. Source: [45]
c h a p t e r
4
Ac o u s t i c t e c h n i q u e s f o r
d i r e c t c o u p l i n g ’ s r e d u c t i o n
The aim of this thesis is to find a solution to the acoustic coupling which exists between the ultrasound transmitter and receiver. To address this problem there are two viable options: simulation and 3D printing. Problem-solving through software development includes a set of activities such as requirements analysis, software implementation followed by testing and validation. On the other hand, 3D printing starts with the establishment of the prototype functionality, being succeeded by the development and evaluation phases. In the evaluation phase, the prototype is used and tested to find out if the 3D piece meets all the requirements specified initially. If issues are detected, the feedback obtained previously is used to improve and adjust the new prototype. Among the two options, 3D printing was chosen since the degree of complexity to develop an algorithm capable of reducing the acoustic coupling is too high when compared to the use of mechanical techniques.
This technology makes it possible to transpose a concept or an idea to a physical object in a short period of time. 3D printing also enables total customization of the prototype including the design of complex geometric shapes that are extremely complicated and expensive to produce using traditional means.
This process initiates using a modeling software Computer Aided Design (CAD) in which the geometry of the model is defined in 3D. The model is then converted into a STL format which defines the geometry of the 3D object translating the initial design into a readable file for the 3D printer. After this step, this file is transferred to the 3D printer. The printers utilized during this dissertation were the Beethefirst and BeenInSchool which uses the Fused Deposition Modeling technology. This technique, also known as FDM, selectively deposits plastic filament in a pre-determined path layer-by-layer to construct the drawn object. Once the printing process is finished, the 3D piece is removed from the printer’s platform and may need some final touches such as polishing or sanding.
In the context of this master thesis, 3D printing was used to produce several supports for the ultrasound transducers with different shapes and formats, in order to reduce the acoustic coupling. Based on the results and conclusions drawn with each prototype during the evaluation phase, it was possible to obtain a final 3D piece where this negative effect was greatly reduced.
4.1
testing system
To test each one of the 3D supports designed, it was assembled a test system in which all supports could be tested under the same conditions. The implemented system enabled not only to send and acquire ultrasounds but also to store all the reflected echoes into .wav files so these could be later analyzed using MATLAB.
Therefore, in a first approach, it will be presented all the software and hardware resources from the test system as well as their functions and features. This includes a detailed description of how to record and capture ultrasounds using the Roland audio card. Even before presenting the first 3D support drawn, in section 4.1.2 is explained the operation principle of the test system as wells as an elaborated description of the tests performed to the 3D supports.
4.1.1
software and harware used
4.1.1.1
matlab
MATLAB stands for MATrix LABoratory and it is a highly sophisticated numerical calculation tool developed by The MathWorks, Inc. One of its strengths comes from combining computing, visualization, and programming in a simple-to-use environment. Matlab has become a standard tool in engineering and science because complex numerical problems can be solved easily in a fraction of time required with programming languages like Fortran or C.
In a first approach, MATLAB was used to generate the wav file containing the pulses meant to drive the transmitter transducer. To start with, 400 periods of a sinusoid with a frequency of 40kHz and duration of 10 milliseconds were generated. The time between each burst was 100 miliseconds. Afterwards, using the audiowrite routine it was created a wav file containing the generated signal. The total duration of this audio file was 11 seconds and it was named as ’TestSignal.wav’.
Lastly, after performing the tests with each one of the 3D supports, this tool was used to calculate the maximum amplitude of the recorded signal, the value of the variance, as well as, for graphical visualization of the received signals.
4.1.1.2
audacity
Audacity is a free, open-source software used for editing and recording audio, being available on Windows, Mac OS X, GNU/Linux, and other operating systems.
This software allows the user to import and export various audio formats such as wav and mp3 and its project rate can go up to 384000 Hz. In this context, this program was used to reproduce the wav file TestSignal which contained the pulses to be transmitted by the emitter transducer and, to record the reflected echoes acquired by the receiver transducer.
4.1.1.3
autodesk fusion 360
Autodesk Fusion 360 is a clouded-based produt development platform which combines CAD,R
CAM and CAE into one integrated workflow. It is a multi-discipline tool since it incorporates industrial
design, mechanical engineering, and machine tool programming. Fusion 360 it is often used for 3D printing projects and it runs on Windows, Mac and in web browsers.
In this specific case, this software was used throughout the whole master thesis to design all 3D models, more specifically, the transducers supports.
4.1.1.4
transducers
The ultrasonic transducers chosen were the MA40S4T/R from Murata since they present a good compromise between cost, size, and reliability. Both transducers have a nominal frequency of 40 kHz and their dimensions are displayed in figure 4.1(b). Looking at this figure, it is possible to verify that the diameter of each transducer corresponds to 9.9 mm. This particular information was necessary to design the various supports.
The figures 4.1(c) and 4.1(d) show the radiation diagrams of both sensors. Throught its analysis, it is possible to state that for θ = 0◦ the transducers have their maximum value which is attenuated as the angle opens. According to the manufacturer’s data, both transducers have a typical directivity of 80◦.
4.1.1.5
sound card roland - quad-capture
The QUAD-CAPTURE is a sound card from Roland with two Ground Left Right (XLR) inputs, two Tip Ring Sleeve (TRS) inputs, two TRS outputs, headphone output and it is Universal Serial Bus(USB) bus powered. This USB connection in addition to powering the sound card also allows the exchange of data with the computer. Furthermore, this device is capable of delivering high sound quality with recording and playback rates up to 24-bit/192kHz. Also, the two inputs have microphone preamps which can be digitally configurated through the graphical Quad-Capture Control Panel software. Before connecting the sound card to the computer for the first time, it was necessary to install the QUAD-CAPTURE device driver software and to make some adjustments in the sound settings to be possible the recording of ultrasounds. Firstly, the QUAD-CAPTURE control panel was accessed through the Windows sound settings and the toolbar Driver was selected as shown in figure 4.2. Nextly, a window with the QUAD-CAPTURE Driver Settings was displayed and the sample rate of 192000Hz was chosen.
Figure 4.2: First step to setting up the sound card to record ultrasounds.
Moreover, it was also required to ensure that the previously selected sampling rate also appeared in the Sound settings of the Windows control panel. After accessing this panel, the navigation steps were: Hardware and Sound > Sound > Recording > 1-2 QUAD-CAPTURE > Properties > Advanced. Afterwards, in the Default Format the chosen option should be ’2 channel, 24 bit, 192000 Hz (Studio Quality)’ as shown in the figure 4.3.
Figure 4.3: Second step to setting up the sound card to record ultrasounds.
As previously mentioned, this device has two XLR inputs named as input 1L and input 2R (figure 4.4). Since only one input was needed and following the recommendations of the instructions manual the input 1L was used to connect the receiver transducer. The potentiometer was placed in the playback position to guarantee that there wasn’t any feedback, ie the sound card did not reproduce the input signal along with the output signal.
Figure 4.4: Front view of the sound card.
Regarding the back side of the audio interface, the switches PHANTOM, NOR and GROUND LIFT were set to the off position as shown in figure 4.5. The settings mentioned in this subsection relatively to the sound card configuration were maintained throughout the entire project.
Figure 4.5: Back view of the sound card.
4.1.2
operation of the test system
The figure 4.6 presents the block diagram of the platform of tests implemented which include the Roland sound card, two ultrasonic transducers, a portable computer and the target. The target refers to the surface used to reflect the ultrasound waves. In this case, the white board present in the laboratory was utilized due to its good reflection properties.
Figure 4.6: Setup used.
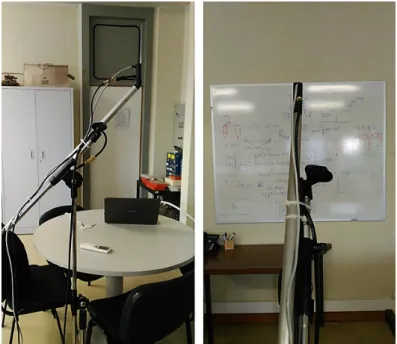
Before testing any of the printed 3D pieces, it was necessary to connect the computer and the ultrasound transducers to the sound card and check if all settings are as described in section 4.1.1.5. Afterwards, to guarantee that all supports are evaluated under the same conditions some measures were taken. Firstly, to fix the several 3D supports containing the ultrasound transducers, it was used a metal tube where these pieces could be easily placed and removed. Nextly, to assure that these were always at the same distance and height from the target, the metal tube was permanently attached to a microphone stand that was available in the laboratory and placed at two meters from the white board.
In order to evaluate the performance of each one of the 3D models designed, and according to the origin of the acoustic coupling to be measured, two types of tests were performed.
The first test that was performed on all 3D supports and includes the following steps:
• Step 1 The file TestSignal.wav generated by Matlab and whose characteristics were described in section 4.1.1.1 is imported to Audacity.
• Step 2 This file is played and sent to the transmitting transducer through the sound card. Consequently, the receiver transducer acquires the echoes reflected by the obstacle which are processed by the computer.
• Step 3 The audio track containing the reflected echoes is then exported and saved into a wav file.
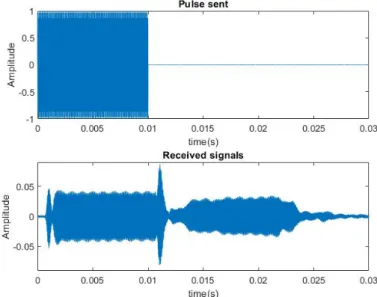
• Step 4 Using the audioread routine of Matlab, the samples of the recorded signal are obtained. Afterwards, the module of the maximum value recorded as well as the variance are calculated. The second test was only performed at a later stage in the design of the supports. The difference between this test and the first one is that in the second step while the wav file was played, the hole of the 3D support corresponding to the emitter transducer was covered with the index finger.
4.2
3d supports designed to reduce the acoustic
coupling
In this section, all the different prototypes produced to reduce the effect of the acoustic coupling are presented. This work began with the design of a simple prototype named as version 1. This 3D part allowed to verify the existence of the acoustic coupling in the worst case scenario, that is, when there wasn’t a physical barrier that prevented the signal from passing directly from the transmitter to the receiver. This prototype went through several modifications throughout the different versions of the 3D supports until reaching a final product. At the end of each version are presented the obtained results as wells as the conclusions drawn.
4.2.1
version 1
For the first version of the 3D supports, it was designed a very simple 3D support where the two ultrasonic transducers could be placed side by side. As shown in figure 4.7, this 3D model also contained a structure with a cylindrical shape that allowed the fitting of the transducer support into the metal tube from the test system.
The holes 1 and 2 correspond to the places where the receiver and the transmitter transducers were placed accordingly. Each one of the orifices designed in the support had a diameter of 10 mm to ensure a snug fit of the transducers.
Figure 4.7: 3D model of the first support.
The result of the first 3D model printed is shown in figure 4.8. Nextly, this piece was placed into the metal tube and the transducers were properly placed in the orifices. The positioning of the transducers was maintained for the remaining 3D pieces, that is, in the upper part of the support it was always placed the emitter transducer and in the lower part the receiver transducer.
In figure 4.9 it is possible to visualize the finished setup.
Figure 4.8: First 3D support printed.
4.2.1.1
obtained results
The version 1 was tested following the first test steps described in section 4.1.2. Observing the figure 4.10 that contains the first pulse sent and the respective recorded signals is quite visible the presence of acoustic coupling. This has a maximum amplitude of 0.3356, which is approximately 14 times bigger than the echo reflected by the surface. As stated in the section 2.4, since the acoustic coupling does not have an amplitude lower than the reflected echo, it can be interpreted as being one causing an incorrect detection of obstacles or measurement of distances.
Figure 4.10: First pulse sent and received signals using the 1st version of the 3D support.
max|RecordedSignal| 0.3356
Table 4.1: Maximum value in modulus of the recorded audio signal from version 1.
For 40kHz and considering that the velocity of the sound is about 344 m/s, for a distance of two meters the echo must be received after 11.7 milliseconds.
Using the ginput function from MATLAB, the points corresponding to the initial and final instants of the acoustic coupling and echo were identified. This allowed to calculate the duration of each signal, the acoustic coupling initiates at t=1.1 milliseconds and ends at t=11.1 milliseconds having a total duration of 10 milliseconds. On the other side, the echo was received at t=12.7 milliseconds and ends approximately at t=22.7 milliseconds also having a duration of 10 milliseconds. The small delay is caused by the sound card latency which does not have a fixed value. The variation of this delay is due to the different processing times that the computer and the sound card take.


![Figure 3.10: Prototype of v2008. Source:[5]](https://thumb-eu.123doks.com/thumbv2/123dok_br/15881542.1089336/44.892.259.617.192.465/figure-prototype-of-v-source.webp)