The impact of Corporate Social
Responsibility on the performance
of European firms
Patrícia Fernandes
152417011
Dissertation written under the supervision of Professor Diana Bonfim
Dissertation submitted in partial fulfilment of requirements for the MSc in
Finance, at the Universidade Católica Portuguesa, January 2019
ii
The impact of Corporate Social Responsibility on the performance of
European firms
Patrícia Fernandes
Abstract
This thesis investigates the relationship between a firm’s corporate social responsibility performance (CSR) and its financial performance in a European context. In order to evaluate this relationship, CSR performance is estimated through companies’ ESG scores, while financial performance is represented by the Return on Assets and Return on Equity Ratios, and Tobin’s Q is used as a proxy for firm value. Evidence is found that CSR performance and firm financial performance/value are positively correlated. However, the direction of causality is left to be determined. The findings suggest as well that top performers in CSR have higher returns than their peers with a lower CSR performance. Notwithstanding, no evidence is found that firms with the worst CSR performance are linked with worse financial results. Finally, the results indicate that the three pillars of ESG (Environmental, Social and Corporate Governance) have different significant relationships with firm value and financial performance. Environmental performance depicts a negative correlation with firm value and financial results, while Social and Corporate Governance performance are positively linked with the corporate financial performance indicators and with firm value.
Keywords:
Corporate Social Responsibility ESG Score
Corporate Financial Performance Firm Value
iii
The impact of Corporate Social Responsibility on the performance of
European firms
Patrícia Fernandes
Abstrato
A presente tese investiga a relação entre o desempenho em termos de responsabilidade social corporativa (RSC) de uma empresa e o desempenho financeiro da mesma num contexto Europeu. Para avaliar esta relação, o desempenho em RSC é estimado por meio das pontuações ESG das empresas, o desempenho financeiro é representado pelos índices de Retorno sobre Ativos e de Retorno sobre Capital Próprio, e o rácio de Tobin’s Q é usado como um proxy para o valor da empresa. Há evidências de que o desempenho em RSC e o desempenho/valor financeiro das empresas estão positivamente correlacionados. No entanto, a direção da causalidade é deixada por ser determinada. Os resultados sugerem ainda que as empresas com melhores desempenhos em RSC estão positivamente associadas a retornos mais elevados do que os seus pares com um desempenho em RSC menor. Não obstante, nenhuma evidência é encontrada de que empresas com o pior desempenho em RSE estão ligadas a resultados financeiros piores. Por fim, os resultados indicam que os três pilares de ESG (Ambiental, Social e Governança Corporativa) têm diferentes relações significativas com o valor da empresa e com o desempenho financeiro. O desempenho ambiental apresenta uma correlação negativa com o valor da empresa e com resultados financeiros, enquanto o desempenho da Governança Corporativa e Social está positivamente ligado aos indicadores de desempenho financeiro corporativo e ao valor da empresa.
Palavras-chave:
Responsabilidade Social Corporativa Pontuações ESG
Desempenho Corporativo Financeiro Valor de empresa
iv
Acknowledgments
I would like to express my deepest gratitude to everyone that has supported and guided me on this journey.
In particular, I want to acknowledge my supervisor, Professor Diana Bonfim. For all the help, advice and valuable inputs that have improved the quality of this project and enriched my experience as a Master student.
Secondly, I want to thank my family for all the love and support. Thank you for encouraging me to always keep pursuing new goals.
Finally, to all my friends, who have made all this process a lot more enjoyable, thanks for keeping me sane.
v
Table of
Contents
1. Introduction ... 7
1.1. CSR and financial performance ... 9
1.2. Corporate Social Responsibility in Europe ... 10
1.3 The ESG Framework ... 11
2. Literature Review ... 12
3. Data & Methodology ... 14
3.1. Data ... 14 3.2. Variables ... 14 3.3. Methodology ... 16 4. Empirical Results ... 18 4.1. Descriptive Statistics ... 18 4.2. Results ... 20
5. Further analysis on policy shifts ... 25
6. Limitations ... 27
7. Conclusions ... 28
8. Tables ... 30
9. References ... 39
vi
List of Tables
Table 1 - Weights attributed to each CSR category. ... 30
Table 2 - List of Variables. ... 30
Table 3 - Summary Statistics. ... 31
Table 4 - Regression Results: ESG Score ... 31
Table 5 - Regression Results: High ESG Score and Low ESG Score ... 32
Table 6 - Regression Results: Three pillars of ESG ... 33
Table 7 - Regression Results: ROA per country. ... 34
Table 8 - Regression Results: ROE per country ... 34
Table 9 - Regression Results: Tobin’s Q per country ... 35
Table 10 - Robustness Test: ESG Score ... 36
Table 11 - Robustness Test: High ESG Score and Low ESG Score ... 37
Table 12 - Robustness Test: Three pillars of ESG ... 38
Table 13 - Correlation Matrix ... 43
Table 14 - Countries' average ESG Score ... 43
7
1. Introduction
Nowadays, Corporate Social Responsibility (CSR) is a broad concept, but the idea goes back to the 1950’s, when Howard R. Bowen first suggested in his book “Social responsibilities of the businessmen” that managers have a moral obligation to make decisions and act in ways that are desirable to the overall society (Bowen, 1953). Since then, the topic of Corporate Social Responsibility has become a relevant element of the business world. Companies no longer had the sole objective of profitability but were now expected to expand their goals to match those of their stakeholders and contribute to society as a whole. Stakeholder management, therefore, had become a crucial part of a company’s strategy (Freeman 1984) and, as a result, CSR activities started to be implemented in order to appease to the interests of the various stakeholders.
According to Carroll (2015), the origin of CSR lies in the post-World War II period. The idea developed alongside with the emergence of social movements like the civil and women’s rights as well as consumer and environmental shifts. The shift towards a more socially responsible mindset was caused by the rising expectations of a larger set of stakeholders, especially the consumers and the employees (Carroll, 2015).
In 1979, Archie B. Carroll described CSR as follows:
“The social responsibility of business encompasses the economic, legal, ethical, and discretionary expectations that society has of organizations at a given point in time.”
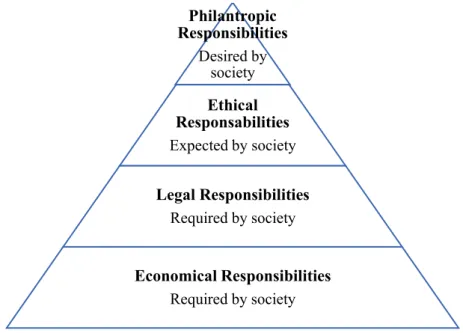
On the basis of this definition, the Corporate Social Responsibility pyramid, depicted in Figure 1, was later developed by Carroll in 1991, in which economical responsibility corresponds to the base of the pyramid, followed by legal, ethical and philanthropic responsibilities.
By the 1990s, the concept of CSR included a much broader group of topics and ideas, such as corporate social performance, sustainability, stakeholder theory and business ethics (Carroll, 2008).
8 Figure 1 Carroll's Pyramid
Due to the wide range of Corporate Social Responsibility definitions, the perception and idea of CSR varies significantly among companies, managers and in society (Lau et al., 2007). Nevertheless, there is some consensus in the CSR literature about its core definition. One common argument behind CSR is that instead of focusing the companies’ resources on maximizing profits and the wealth of shareholders, managers should focus direct their focus on improving stakeholders’ welfare (Becchetti et al., 2011). Another consensus reached on the theme of CSR are the three key areas on which all CSR activities are based. Those are the Environmental, Social and Governance (ESG) aspects, and they are known in the literature as the three pillars of sustainability (Staub-Bisnang, 2012).
It is the objective of this thesis to analyze and understand the impact of CSR performance on European firms between the years of 2002 and 2017. In order to do so, a series of regressions will be conducted to estimate this effect. The paper has the following structure. First, CSR will be defined as the underlying concept of ESG. Second, the theoretical framework is presented. The subsequent section describes the data and the methodology applied for the empirical analysis. Finally, the empirical findings will be examined, on which the main conclusions of this research will be highlighted and hopefully contribute to the existing literature.
Philantropic Responsibilities Desired by society Ethical Responsabilities Expected by society Legal Responsibilities Required by society Economical Responsibilities Required by society
9
1.1. CSR and financial performance
The relationship between CSR and profitability has, since the first work of Bowen in 1953, become a major topic of interest. As a result, the mindset of managers and shareholders has changed over the past decades, as we are now seeing an increasing number of organizations making CSR activities a priority in their agenda (Maretno H. et al. 2016) and implementing them in their strategies, using their own resources to boost or correct their social and environmental impact, while improving the communities around them. Changes in customer expectations and climate change concerns have become important strategic influences (Prahalad C. K. et al. 1994).
This recent development of CSR ideals has raised the question to managers worldwide if improving or not the performance in CSR activities pays off for firms in the long term, that is, whether the use of company resources to address social, environmental and governmental issues can create synergies to increase firm value as well as improve financial performance, ultimately benefiting the company and its shareholders.
Today, companies may engage in socially responsible activities in many forms such as the following: employing and training minorities, improving their ecology efficiency, respecting human rights, among many others (Carroll, 2008). As CSR commitment can be costly and requires that companies spend their limited resources that could otherwise be invested in other, more profitable, projects (Maretno H. et al. 2016), managers must know if such ventures will be valuable or not in order for investment in these areas to occur (Kurucz et al., 2008).
“Sustainability is becoming more important for all companies, across all industries. 62% of executives consider a sustainability strategy necessary to be competitive today, and another 22% think it will be in the future.” (Knut H., 2016)
As more and more managers perceive CSR as a way to get ahead of competition, companies have begun to develop their business strategies around CSR and managed indeed to create a competitive edge (Carroll, 2008) due to their socially responsible performance. It is reasonable to assume that most companies engage in CSR activities due to the potential gains that they can reap from it, in lieu of more altruist reasons. Notwithstanding the reasons behind CSR investment, society, as much as the company, has a lot to gain from such ventures. Regarding the benefits companies are able to generate from being socially responsible and engaging in CSR activities, these range from facility in attracting resources, to obtaining quality employees
10
and keeping them motivated, the companies’ products and services become more marketable as costumers perceive them as more ethical and sustainable, and therefore as a better choice, and finally, it can be ultimately a source of competitive advantage (Barnett et al 2006). Other benefits of pursuing a sustainability strategy include a positive effect on firm reputation and image, cost savings and higher (Weber 2008).
1.2. Corporate Social Responsibility in Europe
Although the first ideas of Corporate Social Responsibility emerged in the United States, the concept is very present in the minds of the Europeans as well. CSR in Europe, and particularly in the European Union, is seen as “a voluntary and self-regulatory program” to be conducted by the companies themselves. Nonetheless, the European Commission has discussed and released over the past years several tools and guidelines to foster CSR growth and sustainable development in Europe. For the European Commission, CSR is defined as “actions by companies over and above their legal obligations towards society and the environment” (European Commission, 2011).
The concept of Corporate Social Responsibility first appeared on the European Union agenda in 2001, in a Green Paper where the term was introduced. Since then, an ongoing debate about the topic has assured an increase in acceptance and compliance of CSR ideals in Europe (European Union, 2014). In the past years, more and more European companies have pursued projects designed to improve environmental and social sustainability and year by year, companies have been publishing an increased number of CSR/Sustainability reports (Nielsen et al., 2013). For these results and the drive that CSR has gained in recent years have contributed several European and international tools such as the ISO 9000, the United Nations Global Compact, the EFQM Framework for CSR, the ISO 26000 Guidance Standard on Social Responsibility, the Global Reporting Initiative and the OECD Guidelines for Multinational Enterprises.
Although the quick and swift rise of CSR investment in Europe, there is still much progress to be achieved. Despite the rising importance of implementing CSR activities in corporate strategy, the main goal of shareholders is still to increase their wealth. Therefore, there is still a challenge for European firms to find and create synergies between value creation and CSR implementation. Another problem faced is in the diffusion of information. Making shareholders aware that they can use CSR activities as a mechanism to gain a competitive advantage over their peers still poses a challenge for the European community (Nielsen et al., 2013).
11
1.3 The ESG Framework
There are many forms to quantify Corporate Social Responsibility performance, however, for the purpose of this study, it is of the most importance that the all data can be comparable across companies and countries and that it is assessed from an independent third party. As such, all data concerning CSR performance indicators is retrieved from an individual independent source: Thomson Reuters’ DataStream ESG Scores.
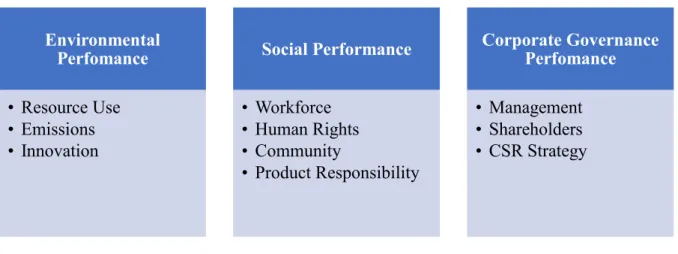
The scores provided by Thomson Reuters are computed from over 400 company-level ESG measures retrieved from the companies’ public sources and from other origins such as news reports. These measures are then classified into 10 different categories and finally congregated into the three major categories of ESG: Environmental performance, Social performance and Corporate Governance performance. The three pillars and the 10 categories that compose them are exhibited in Figure 2.
Based on the assessment of each pillar, the overall ESG score is calculated through a weighted average of the 10 categories (see Table 1), which reflects a company’s CSR effectiveness and performance on the three pillars.The ESG Score ranges from 0 to 1 (or 0 to 100), in which 0 corresponds to lowest possible score and to the letter grade “D-” and 1 to the highest possible score and the letter grade “A+”.
Environmental Perfomance • Resource Use • Emissions • Innovation Social Performance • Workforce • Human Rights • Community • Product Responsibility Corporate Governance Perfomance • Management • Shareholders • CSR Strategy
12
2. Literature Review
Throughout the past years, there has been a growing concern for environmental, social and governance issues and, consequently, the role of firms on these topics has been one of the main questions to arise on the mind of the academics. Since organizations have started to have a more prominent role on these issues, researchers have studied what is the impact, if any, of CSR on a firm’s financial performance.
Many argue that companies should just focus on increasing their value and distributing profit to their shareholders pockets, that “the social responsibility of business is to increase its profits” (Friedman 1970). However, through the last decades, as social consciousness increases, and the paradigm changes, it is now more widely accepted that managers and organizations have the moral obligation to make decisions that are desirable to the overall society (Bowen 1953). As these two concepts, profits and social awareness, are not completely contradictory, some authors believe that while engaging in CSR activities a firm could increase its profits and value. Although many studies have surfaced around the topic, there seems to be little consensus about the impact of CSR on corporate firm performance. Some argue that the relationship is conclusively positive (Bird et al. 2007; Waddock and Graves 1997; Orlitzky et al. 2003; Jiao 2010; Eccles et al. 2013), due to many different factors such as increased company reputation (Brown et al. 1997), or due to decreases in costs associated with lawsuits (Dhaliwal et al. 2011) among many other reasons such as a boost in customer loyalty (Brown et al. 2006). The European Commission finds several benefits companies have to gain in the implementation of CSR activities such as improvement in productivity and employee motivation, company reputation and customer satisfaction and enhancement of its relations with the local community (European Commission, 2009).
Other studies have found a negative relationship between CSR and performance indicators (Lima Crisóstomo et al. 2001; Friedman 1970; Barnea et al. 2010; Groening et al. 2013) since, for example, firms may use valuable limited resources in CSR activities that could have been used to invest in profitable projects, lessening the potential value of the firm (Barnea et al. 2010). There are authors who have found no relationship at all between social and financial performance (Hillman and Kein 2001; Aupperle et al. 1985) and, finally, there are some who have found a mixed relationship between corporate social responsibility and financial performance (Margolis et al. 2001).
13
Another question past researchers have tried to answer is what the impact of each dimension of CSR is (Environmental, Social and Governance) on a company’s performance/value. The existing literature suggests that the most impactful pillars on firm performance are the environmental and the governance ones. Firms with outstanding performance on these two categories generate positive results (Dimson et al. 2013; Klassen et al., 1996) and its valuations will be positively influenced (Bird et al. 2007; Dowell et al., 2000). Nonetheless, there is some disagreement regarding the environmental pillar. There are authors that agree that investment in environmental efficiency can be too costly and hurts productivity (Gray et al., 1993) leading to lower market values.
On the whole, favorable governance practices and positive employee relations are seen as key components that lead to positive returns (Edmans 2008; Bertrand et al. 2003).
The social pillar has been gaining track in the past years. A trend has been emerging as companies have started to become more involved in their local communities, contributing to the improvement of society with their products and services, providing money and time to social causes (Grant, 2014). Socially responsibility is now seen has a necessary element of corporate strategy. Managers know that the goodwill created by these types of activities is extremely beneficial (Brown et al. 2006; Jensen 2002).
One of the reasons that may explain the lack of consensus in the literature could be the many forms researchers have tried to approach this problem. Some papers have tried the accounting-based approach, using CSR scores as proxies for social performance and measures such as ROA, ROE and ROS to account for the firm’s financial performance while others perform an event studies, using company announcements and news reports related to social and environmental issues to evaluate and quantify corporate social performance instead of analyzing CSR scores. Regarding this type of studies, conclusions are drawn that investors react positively to good company environmental behaviors whilst reacting negatively to news and announcements regarding harmful environmental practices in the United States (Flammer 2013).
An important aspect of the past literature is that the results seem to vary when studying different countries and industry sectors. As such, this research will be focused on the European environment, investigating how the European companies perform in all CSR dimensions and how that affects their financial performance and their company value.
14
3. Data & Methodology 3.1. Data
This research is based on a sample of 250 listed companies, from the following 15 European countries: Belgium, Germany, Finland, Italy, the Netherlands, Spain, Austria, France, Greece, Ireland, Denmark, Norway, the United Kingdom, Switzerland and Sweden. This sample includes yearly data between the years of 2002 and 2017 available on Thomson Reuters Datastream.
Although this thesis’s intention is to investigate the effect of CSR on the whole European continent, data from only 15 countries was collected. Several countries were excluded due to a) for several countries, in particular the eastern European countries such as Poland, Ukraine, Russia or Turkey, data for the ESG scores is only available from 2008 onwards and b) some countries such as Portugal, Iceland and Luxembourg, due to their size do not have sufficiently relevant data.
3.2. Variables
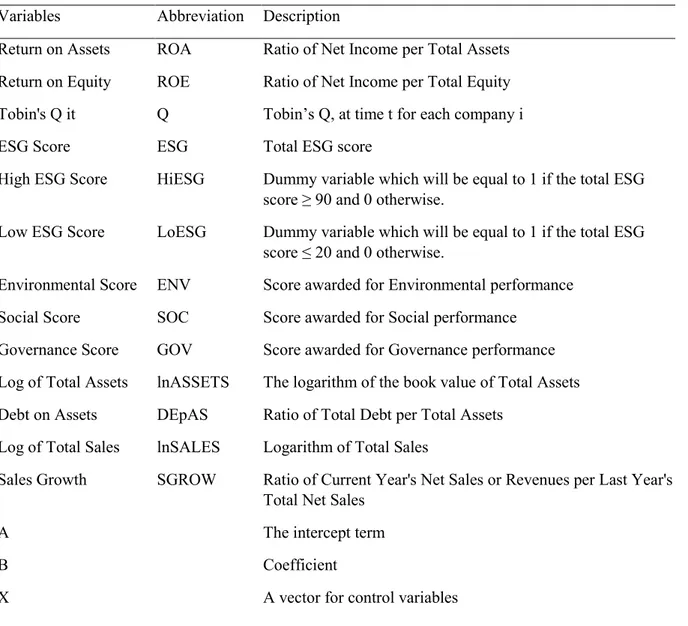
All the variables (dependent, independent and control variables) are retrieved or computed from data obtained from Thomson Reuters Datastream. Datastream is a reliable and trustworthy database widely used in the academic field, as such it is expected that all the data used is reliable and truthful. Table 2 describes all the variables employed in this research.
Dependent Variables
The dependent variables used in the regressions described below, follow the same approach of studies researching the relationship between CSR and corporate financial performance done in the past (Waddock et al., 1997; Derwall, 2007). The dependent variables used are Return on Assets (ROA) and Return on Equity (ROE), in order to assess operational performance, companies’ profitability and overall financial performance.
As a proxy for firm value, Tobins’ Q1 was the chosen variable as is the most commonly used
in previous studies as well (Derwall, 2007; Mackey et al., 2007).
1 Tobin’s Q is computed as follows: Tobin’s Q = Total Market Value of Firm
15 Independent Variables
The independent variables used for this research are the firms’ total ESG scores and the individual scores of the components that constitute the ESG score, which evaluates a firm’s corporate social responsibility in the three pillars of sustainability, environmental, social and governance over a year. ESG Scores are graded between 0 and 100, as 100 being the highest possible score a company can achieve.
The ESG Score is an equally weighted average of the three pillars’ scores. For this research, the pillars’ individual scores will also be used to observe their individual impact. These are to be denominated as Environmental Score, Social Score and Governance Score.
Dummy variables are required as well to assess the financial impact of the top and bottom CSR performers. HighESGscore will take the value 1 for ESG scores above 90 and 0 otherwise, while LowESGscore will take the value 1 when the ESG scores are below 20 and 0 for values equal or above 21. These values were chosen as to take into account only the extremely high and low scores, in order to capture a group sample that is significant enough (Derwall, 2007). These variables are needed to assess the total and individual impact of ESG on financial performance.
Control Variables
As there are other factors that may influence firm performance, such as firm size and risk (Waddock et al. 1997), this study includes control variables in its regressions. Size is an important factor that influences value and performance, as such, the log of Total Assets and the log of Total Sales will be used as a proxy to control for firm size (Derwall, 2007; Waddock et al., 1997).
Risk tolerance is another factor that must be accounted for as not to bias the results. Risk taken by the firm influences vastly its performance, therefore a Debt/Assets ratio will be used as a control variable as well (Waddock et al., 1997).
As for the Tobin’s Q, the variables logarithm of the Book Value of Assets, Sales growth and Return on Assets will be used as control variables (Derwall, 2007; Waddock et al., 1997). Previous studies have found that all these variables have a positive impact on firm value (Q) and should be included as control variables. Sales growth usually represent higher levels of investment from the firms, implying that the firm is growing. The other two control variables are to account for firm size.
16
3.3. Methodology
This study investigates the relationship between the variables over the years in form of a panel data study. All regressions employed on this paper are run using the Ordinary Least Squares (OLS) method.
In order to research the link between Corporate Social Responsibility and Financial Performance/Firm value, a three-step approach will be employed. The first set of three regressions will estimate, individually, Return on Assets (ROA), Return on Equity (ROE) and Tobin’s Q (Q) against the firms Total ESG Score (ESGscore). A set of control variables is used to control for the various factors described in the Variables part of this paper.
Regression 1:
𝑅𝑂𝐴𝑖𝑡 = 𝛼𝑖+ 𝛽0𝐸𝑆𝐺𝑠𝑐𝑜𝑟𝑒𝑖𝑡+ 𝛾𝑖𝑡𝑋𝑖𝑡+ 𝜀𝑖𝑡
𝑅𝑂𝐸𝑖𝑡 = 𝛼𝑖+ 𝛽0𝐸𝑆𝐺𝑠𝑐𝑜𝑟𝑒𝑖𝑡+ 𝛾𝑖𝑡𝑋𝑖𝑡+ 𝜀𝑖𝑡
𝑄𝑖𝑡 = 𝛼𝑖+ 𝛽0𝐸𝑆𝐺𝑠𝑐𝑜𝑟𝑒𝑖𝑡+ 𝛾𝑖𝑡𝑋𝑖𝑡+ 𝜀𝑖𝑡
These first regressions will demonstrate the type of relationship between ESG and financial performance/value and the size of its impact, whether it be positive, negative, mixed or simply if there is no relationship at all.
The second set of regressions will use the dummy variables HighESGscore and LowESGscore to study the relationship between high and low ESG Scores and, again, the financial performance/firm value variables. This will be useful to provide more information about the financial performance of top and the worse CSR performers (Derwall, 2007). Top performers are considered those whose ESG Score is above 80 and the laggards are the companies who couldn’t achieve an ESG Score above 20. Again, the regressions include a set of control variables.
Regression 2:
𝑅𝑂𝐴𝑖𝑡 = 𝛼𝑖+ 𝛽0𝐻𝑖𝑔ℎ𝐸𝑆𝐺𝑠𝑐𝑜𝑟𝑒𝑖𝑡+ 𝛽1𝐿𝑜𝑤𝐸𝑆𝐺𝑠𝑐𝑜𝑟𝑒𝑖𝑡+ 𝛾𝑖𝑡𝑋𝑖𝑡 + 𝜀𝑖𝑡
𝑅𝑂𝐸𝑖𝑡 = 𝛼𝑖+ 𝛽0𝐻𝑖𝑔ℎ𝐸𝑆𝐺𝑠𝑐𝑜𝑟𝑒𝑖𝑡+ 𝛽1𝐿𝑜𝑤𝐸𝑆𝐺𝑠𝑐𝑜𝑟𝑒𝑖𝑡+ 𝛾𝑖𝑡𝑋𝑖𝑡+ 𝜀𝑖𝑡
17
Finally, the last three regressions will run the three pillars of ESG (EnvironmentalScore,
SocialScore and GovernanceScore) against the dependent variables ROA, ROE and Tobin’s Q,
to study their individual impact on the companies’ financial performance. Regression 3: 𝑅𝑂𝐴𝑖𝑡 = 𝛼𝑖 + 𝛽0𝐸𝑛𝑣𝑖𝑟𝑜𝑛𝑚𝑒𝑛𝑡𝑎𝑙𝑆𝑐𝑜𝑟𝑒𝑖𝑡+ 𝛽1𝑆𝑜𝑐𝑖𝑎𝑙𝑆𝑐𝑜𝑟𝑒𝑖𝑡+ 𝛽2𝐺𝑜𝑣𝑒𝑟𝑛𝑎𝑛𝑐𝑒𝑆𝑐𝑜𝑟𝑒𝑖𝑡 + 𝛾𝑖𝑡𝑋𝑖𝑡+ 𝜀𝑖𝑡 𝑅𝑂𝐸𝑖𝑡 = 𝛼𝑖+ 𝛽0𝐸𝑛𝑣𝑖𝑟𝑜𝑛𝑚𝑒𝑛𝑡𝑎𝑙𝑆𝑐𝑜𝑟𝑒𝑖𝑡 + 𝛽1𝑆𝑜𝑐𝑖𝑎𝑙𝑆𝑐𝑜𝑟𝑒𝑖𝑡+ 𝛽2𝐺𝑜𝑣𝑒𝑟𝑛𝑎𝑛𝑐𝑒𝑆𝑐𝑜𝑟𝑒𝑖𝑡 + 𝛾𝑖𝑡𝑋𝑖𝑡+ 𝜀𝑖𝑡 𝑄𝑖𝑡 = 𝛼𝑖 + 𝛽0𝐸𝑛𝑣𝑖𝑟𝑜𝑛𝑚𝑒𝑛𝑡𝑎𝑙𝑆𝑐𝑜𝑟𝑒𝑖𝑡+ 𝛽1𝑆𝑜𝑐𝑖𝑎𝑙𝑆𝑐𝑜𝑟𝑒𝑖𝑡+ 𝛽2𝐺𝑜𝑣𝑒𝑟𝑛𝑎𝑛𝑐𝑒𝑆𝑐𝑜𝑟𝑒𝑖𝑡 + 𝛾𝑖𝑡𝑋𝑖𝑡+ 𝜀𝑖𝑡
From the findings of these three regressions, conclusions can be drawn about which activities from the three categories of ESG are the most advantageous for companies to undertake. This will provide a deeper input of how firms’ financials behave with the performance of each pillar. A fixed effects model is employed on all regressions. Year fixed effects and Country fixed effects are also employed as to control for any variation that is attributed to time and country and not to the independent/control variables.
18
4. Empirical Results 4.1. Descriptive Statistics
The descriptive statistics for all the variables employed in this study are outlined in Table 3. The descriptive statistics summarize the data obtained on a total of 250 companies, among 15 European countries throughout 15 years, from 2002 to 2017. In order to achieve the results displayed in Table 3, the extreme 1% values were winsorized from the original sample.
Regarding the dependent variables, that is, Return on Assets (ROA), Return on Equity (ROE) and Tobin’s Q, it can be concluded that, on average, the total 250 listed European firms in this sample, have a Return of Assets of 6.08%, a Return on Equity of 13.52% and a Tobin’s Q of 0.91. Concerning the independent variables, that is, the overall ESG score, and the individual scores for environmental, social and governance performance, it can be inferred that the companies’ ESG Score in this dataset ranges from 16.74 to 96.23, with an average score of 62.44. In regards for the individual pillars, on average, the firms have an Environmental score of 74.87, a Social score of 75.52 and a Corporate Governance Score of 59.86. Finally, regarding the control variables, the corporations in this dataset have on average, a logarithm of Sales of 15.54, a yearly Sales Growth of 16.76%, a logarithm of the Book Value of Assets of 16.13 and a ratio of Debt on Total Assets of 0.27.
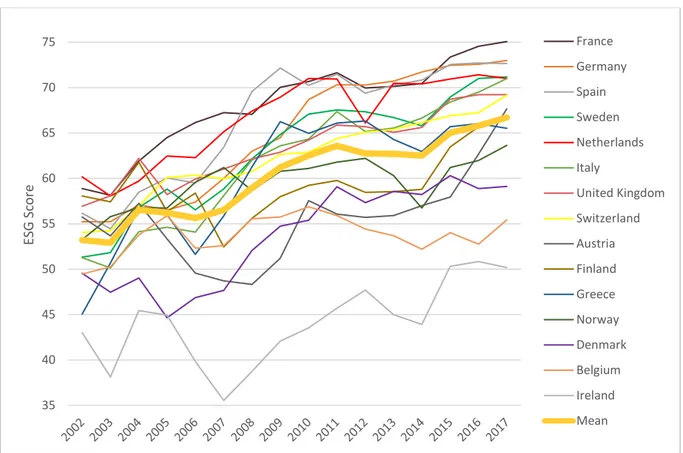
Regarding the overall ESG Score for each country, Figure 3 depicts the evolution throughout the past 16 years. Every single country shows an upward trend, which corroborates the theory that companies are investing more and more of their resources in improving their CSR performance. In 2002, the mean ESG Score for these 15 countries was 53.21 and in 2017 it was 66.71. The country with the highest ESG Score by 2017 is France with a score of 75.05 and Ireland ranks the lowest with an overall score of 50.17.
19 Figure 3 – This figure depicts the evolution of the ESG Scores between 2002 and 2017 for all countries in the sample. The thick line represents the mean of the sample.
On Figure 4, the ESG scores for 2017 are represented per country. This visual representation allows to better understand the CSR environment in Europe. It becomes clear that central Europe outperforms the rest of its peers in terms of CSR performance. France, Germany, Spain and the Netherlands, with the inclusion of Sweden, are the top performers of the group. Figure 4 – Map representing the average ESG Score per country in 2017. This figure is composed from the ESG scores collected from Datastream.
35 40 45 50 55 60 65 70 75 ESG Sco re France Germany Spain Sweden Netherlands Italy United Kingdom Switzerland Austria Finland Greece Norway Denmark Belgium Ireland Mean
20
4.2. Results
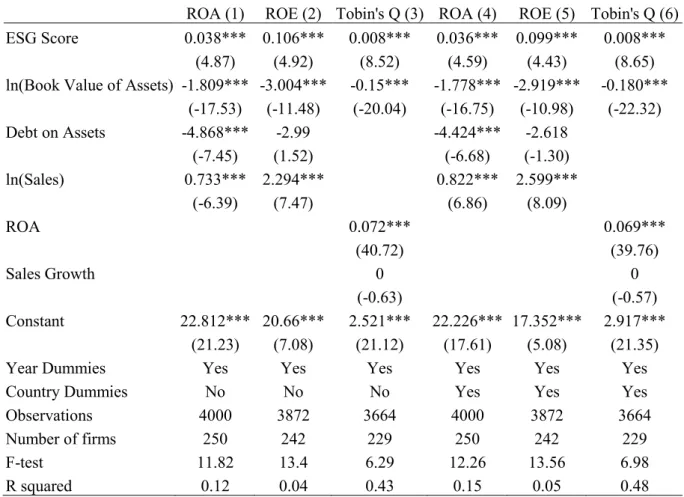
In Table 1, the relationship between the independent variable, the ESG Score, and the dependent variables, the financial performance indicators (ROA, ROE and Tobin’s Q) is tested. Table 4 shows the empirical results of the regressions.
Assessing the t-statistics for the regressions (1) and (4), that is, those with Return on Assets (ROA) as the dependent variable, the independent variable ESG Score and the control variables ln (Book Value of Assets), Debt on Assets and ln (Sales) are all statistically significant at the 1% level, meaning that the null hypothesis is rejected. For the regressions (2) and (5), where Return on Equity (ROE) is used as dependent variable, again, the variables ESG Score and the logarithms of Book Value of Assets and Sales are statistically significant at the 1% level. However, the variable Debt on Assets does not have any statistical significance. Lastly, for equations (3) and (6), that is, when using Tobin’s Q as the dependent variable, the independent variable ESG Score and the control variables ln (Book Value of Assets), Return on Assets (ROA) are all statistically significant at the 1% level. The control variable Sales Growth is the only exception, as it does not have any statistical significance in both regressions.
Subsequently, analyzing the coefficients, in all equations it is demonstrated that the overall ESG Score is positively related with financial performance, represented by ROA and ROE and firm value, characterized by Tobin’s Q. These results support the existing literature, which states that a good CSR performance is associated with higher financial results. Regarding the control variables, most of them display the expected signs. Risk, measured by the Debt per Assets ratio affects the dependent variables negatively and firm size, represented by ln Sales displays a positive relationship with financial performance and Return on Assets have a positive impact on firm value. However, ln Book Value of Assets has a negative relationship with all dependent variables.
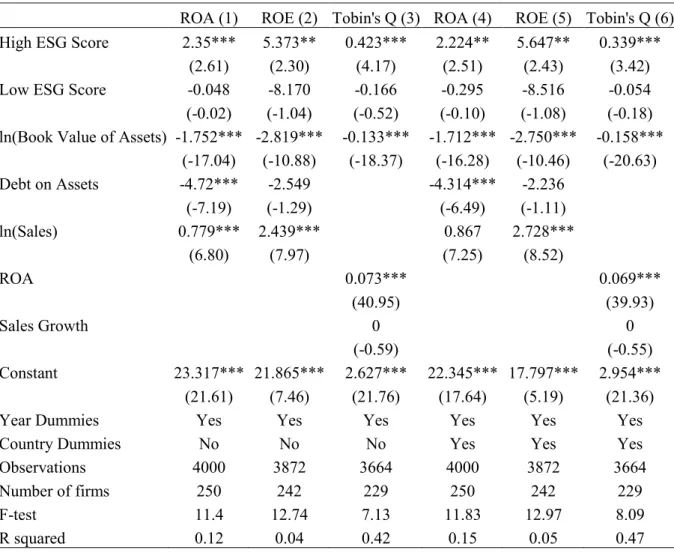
The results concerning the second set of regressions are shown in Table 5. Here, the impact of the dummy variables High ESG Score and Low ESG Score is estimated against the financial indicators, again Return on Assets (ROA), Return on Equity (ROE) and Tobin’s Q.
Starting with the t-statistics, for equations (1) and (4), when ROA is employed as the dependent variable, the independent variable High ESG Score is significant at the 1% level in equation (1) and at the 5% level in equation (4). The other independent variable, the dummy Low ESG Score is not statistically significant. The control variables are all statistically significant at the 1%
21
level, except for the log of Sales used in equation (4), which is not statistically significant. For equations (2) and (5), High ESG Score is significant at the 5% level and, again, Low ESG Score does not add statistical significance to the model. All control variables are significant at the 1% level except for Debt on Assets in both equations. In both equations (3) and (6), the dummy variable High ESG Score is statistically significant at the 1% level and, on the other hand, the dummy Low ESG Score does not show any statistical significance, as such, its impact on firm value cannot be evaluated. The remaining control variables show statistical significance at the 1% level except for the variable Sales Growth.
The outputs obtained show that higher ESG Scores are positively associated with firm performance indicators, Return on Assets and Return on Equity, as well as with firm value. This supports the theory that the firms that are top performers in CSR are able to achieve higher financial results than those that do not put as much effort and resources pursuing CSR activities. On the other hand, the hypothesis that companies with extremely low ESG Scores, that is, firms whose score is lower than 20, are associated with lower financial results and inferior firm values is not confirmed. As for the control variables, the results are the same as before. Once again, ln of the Book Value of Assets and Debt on Assets display a negative sign and all other control variables display a positive relationship with the dependent variables.
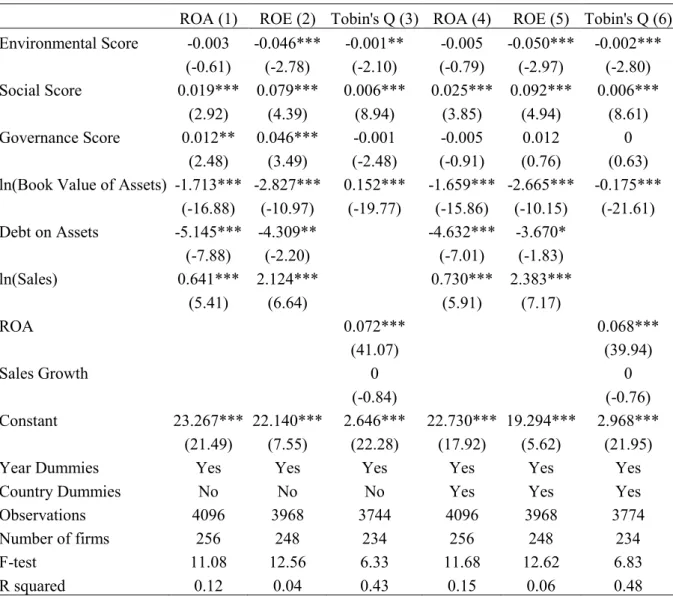
Finally, as this study means to investigate the individual relationship between each ESG pillar (Environmental, Social and Governance) and financial performance, a third regression is run using the individual scores as the independent variables. The results are displayed in Table 6. Evaluating the t-statistics of equations (1) and (4), the variable Environmental Score is not statistically significant in either equation, the variable Social Score is significant at the 1% level and the Governance Score variable is statistically significant at the 5% level in equation (1) and not significant in equation (4). All the control variables in both equations are significant at the 1% level. When using ROE as the dependent variable, the results vary a little, as in equation (2), all the independent and control variables are statistically significant at the 1% level, except for the ratio Debt/Assets. However, in equation (5), the Governance Score does not have any statistical significance at all for the model. Lastly, in equation (3), Environmental and Social Scores are statistically significant at the 5% and 1% level, respectively, and on the other hand, Governance Score is not significantly linked with firm value. The control variables are all statistically significant at the 1% level, only Sales Growth does not hold any significance at all. For equation (6), Environmental Score and Social Score show a 1% significance level and
22
Governance Score shows no model significance. Only the logarithm of Book Value of Total Assets and Return on Assets show any statistical significance at the 1% level.
Regarding the outputs, the individual Environmental Score is negatively related with both Return on Equity and Tobin’s Q. This could support Gray and Shadbegian’s (1993) theory that using the company’s resources towards environmental projects and values could hurt overall productivity. Regarding the individual Social Score, the results show a positive relationship across all equations, meaning that high social values are ultimately beneficial to the organization. Finally, Governance Score demonstrates a positive relation with both ROA and ROE, when not controlling for country fixed-effects, in equations (1) and (2). Of the three pillars, the Social one is the most impactful on both financial performance and firm value. The control variables show the same relationships as the previous two tables.
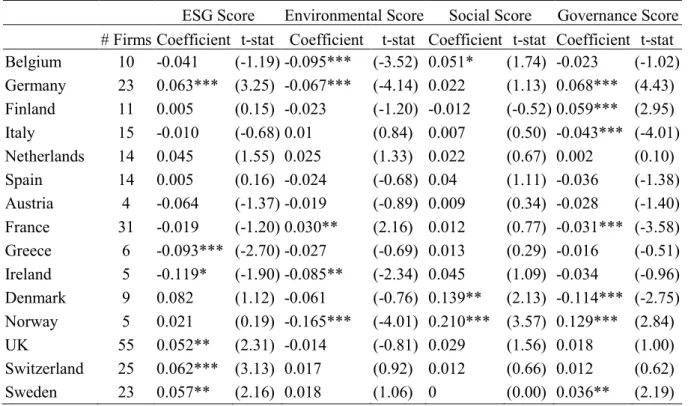
Another purpose of this research is to investigate how Corporate Social Responsibility is perceived in each European country and its local impact.
Tables 7 through 9 use the same regressions as before, only now each country is assessed individually. Assessing Table 7, which uses Return on Assets as the dependent variable, the results for the ESG Score are, overall, corresponding to the ones observed before in Table 4, that is, a positive relationship between ESG Score and Return on Assets. However, of the 15, only 6 countries depict a significant result, those are Germany, Greece and Switzerland, with a 1% significance, the United Kingdom and Sweden, with a level of 5% statistically significance, and Ireland, with a 10% level of significance. Greece and Ireland are the only countries that show a negative relationship between CSR and financial performance (proxied by ROA). It is to note that these two are in bottom five CSR performers in the country sample of this research and below the European average, being Ireland the worst performer of the 15 countries. This could explain the low levels of investment in CSR activities in those countries, as maybe companies perceive that it would only influence negatively their profits and results and prefer to invest their resources in other activities. Nevertheless, the hypothesis that this could be explained by other unobservable variables cannot be excluded. There could exist other factors that make firms perform badly while not investing in CSR as well, as is the case of a bad firm management. It is insightful to mention that those countries at the top of the ESG rank are the one whose result show a positive relationship between CSR and firm performance. The individual pillars are in accordance with the previous results. The Environmental score affects return on assets in a negative way, only in France this is not the case, as for 1-point increase in
23
the Environmental Score, ROA increases 0.03. France is the country whose companies have the highest ESG score of the sample. As it is the country with highest CSR values, this positive relationship could be explained by the high standards of French society regarding environmental values. The costs of improving environmental efficiency could be overcome by the gains in societal approval, among other benefits. Regarding the impact of the Social Score, only Belgium, Denmark and Norway depict statistically significant results. Norway is the country where socially responsible initiatives have the most impact, as a 1-point increase in the Social Score results in a 0.21 point increase in return on assets. Finally, and according with previous studies (Bird et al., 2007; Dimson et al., 2013; Edmans, 2008), Governance aspects are the most relevant in respect to ROA. This score has a 1% statistical significance in Germany, Finland, Italy, France, Denmark and Norway. Sweden shows significance at the 5% level. This pillar shows the most mixed results, as it has a positive impact in countries such as Germany, Finland, Norway and Sweden, but shows a negative relationship with ROA in Italy, France and Denmark. At the extremes lies Norway with a positive coefficient of 0.129 and Denmark with a negative coefficient of -0.114.
Table 8 shows the impact of the four scores on Return on Equity for each of the 15 European countries. Once again, the results do not differ much. Finland and Greece deviate from the norm regarding the coefficients for the ESG Score as the impact on ROE in those countries is negative. Once again, the countries at the top of the table regarding ESG scores, that is, Germany, Italy, the United Kingdom and Switzerland, demonstrate positive relationships. As for the three pillars, again, the environmental factor is associated with lower Return on Equity for most of the countries, with the exception of Finland. The Social Score and the Governance are positively associated with ROE for the majority of the countries.
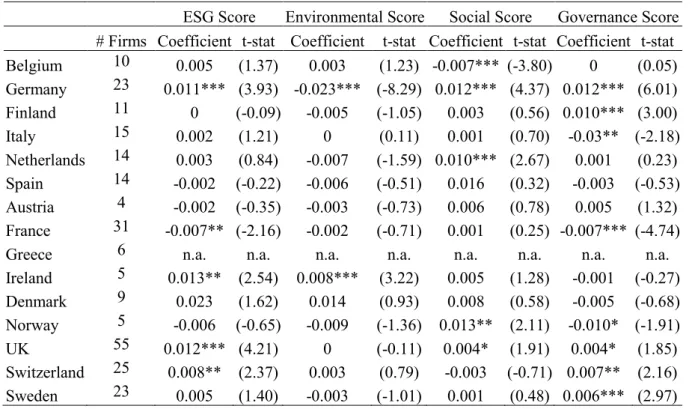
Lastly, regarding the relationship between firm value (Tobin’s Q) and CSR for each of the 15 countries, the results can be observed in Table 9. Germany, Ireland, the United Kingdom and Switzerland, once again, show a positive relationship between the overall ESG Score and firm value. Only the coefficient of the ESG Score for French companies correlates negatively with Tobin’s Q. Regarding the other three scores, and the environmental one in particular, only Germany and Ireland depict a significant relationship between the Environmental Score and Tobin’s Q, both at the 1% level. In the case of the German firms, the relationship is negative, as for the Irish, companies that perform better in environmental aspects can increase their value. Companies that partake in social initiatives in Germany, the Netherlands, Norway and in the United Kingdom can use these activities to influence and increase their firm value as opposed
24
to Belgium companies, whose firm value will decrease by 0.07 points, when their Social Score increases by 1. Once again, the Governance Score’s impact is not homogeneous across the countries. On one hand, there is a positive relationship among German, Finnish, British, Swiss and Swedish firms, and on the other, companies in Italy, France and Norway seem to decrease value as the Governance Score increases.
The reason behind the limited amount of countries with significant results could be explained by the size of the sample. Due to inexistence of data available, most of the countries do not have a sufficient number of firms to show significant results and, unfortunately cannot be studied individually.
25
5. Further analysis on policy shifts
For further exploration of the results achieved, we will look in more depth at a particular period in the sample. We focus on what happened after 2011, which was the year that both the European Council and the European Parliament joined forces with the European Commission to further develop its CSR policy. By the end of 2011, in the Single Market Act, a new communication on CSR was adopted. In its renewed EU 2011-14 strategy, the Commission carried out several voluntary “policy measures and binding rules with its directives on non-financial reporting and public procurement”. With this strategy, the European Commission aspires to boost the visibility of CSR, the sharing of best practices and to improve the companies’ ability to regulate themselves.
For this purpose, the regressions for the whole sample will be estimated with a new set of independent variables. A dummy variable AFTER is introduced which corresponds to 1 for the years after 2011. The new dependent variables correspond to the previous ones used multiplied by the dummy AFTER.
Analyzing the results in Table 10, the variable AFTER*ESG is not significant for the regressions estimating ROA without country dummies and Tobin’s Q. Therefore, these results seem to suggest that nothing changed after 2011. However, concerning the regressions estimating ROE, the variable AFTER*ESG is significant at the 1% level. This could mean that something has indeed changed after 2011.
In Table 11, the variables AFTER*HighESGscore, except for the results of the regressions estimating Tobin’s Q, and AFTER*LowESGscore do not show significant outputs, suggesting, again that nothing changed after 2011. But for the regressions with Tobin’s Q as the dependent variable, the results are again different.
Finally, in Table 12, the dummy variables created, AFTER*Env.Score, AFTER*SocialScore and AFTER*Gov.Score, are statistically significant for the majority of the regressions. The relationship between the pillars and the dependent variables shifted after 2011. Only the relationship between Social Score and Tobin’s Q and the link between Governance Score and ROA remain unchanged.
Analyzing these results, the successfulness of the changes made by the European Commission in 2011 is not very clear. The results suggest that the overall relationship between CSR and firm performance did not suffer many changes. However, this new policy, according to these results,
26
succeeded in changing the link between the environmental and social pillars and company performance. The most successful outcome is that, from 2011 onwards, Environmental performance depicts a positive relationship with financial performance and firm value.
27
6. Limitations
Despite the findings and conclusions reached, this dissertation has still space to improve due to the presence of some limitations in the research.
The first major limitation is that, although a conditional correlation between variables is found, the causality of the relationship is left to be established. A conclusion cannot be reached if, indeed, corporate social responsibility performance leads to better financial results and increased firm value, or if causality goes the other way, and bigger firms with more resources are those that can invest more in CSR and obtain better results in their ESG scores.
Another drawback in this study, is that CSR is a much wider concept that includes many other topics. Therefore, there are other variables that can be included to better determine how the firms perform in CSR aspects. Future studies could also further investigate the 400 measures collected by Thomson Reuters, to see which particular activities show the most significant and impactful relationships. Following the same logic, there are other ways as well to assess firm performance and firm value that are not included in this dissertation. As for the control variables, there are many others that could be included such as the percentage of investment in R&D, which is an important variable to take into account for these types of studies (McWilliams et al., 2000). However, due to the low number of observations, the variable was ultimately excluded from the sample.
One final limitation worth mentioning is the size of the sample. As the ESG Scores measure is fairly new, there is not still much data available for a deeper study.
28
7. Conclusions
This paper contributes to the existing literature concerning the relationship between corporate social responsibility and a firm’s financial performance and value. The main purpose of this research is to add new valuable findings to the field, specifically, on the European context. In order to do so, data from companies from 15 European countries is analyzed. An important differentiation factor regarding this paper is the employment of Thomson’s Reuters ESG Scores and the study of the three pillars of CSR individually.
Regarding the results, it can be inferred that there is a positive relationship between CSR and financial performance in European countries, from an accounting perspective. Companies with high socially responsible values achieve higher Return on Assets and Return on Equity ratios. As is the case with profitability ratios, Corporate Social Responsibility performance and firm value are positively correlated, however the relationship between the ESG Score and firm value is not as economically meaningful as it is on ROA and ROE.
Another main conclusion of this research is that as the ESG Score increases so do the financial performance indicators. Companies with higher scores are associated with higher financial results, that is, those with an ESG Score above 80 outperform their peers with lower ESG scores in terms of financial results. The contrary cannot be said, extreme low ESG scores don’t seem to have a relevant influence on corporate financial performance.
Regarding the study of three individual pillars of ESG, the results show that not all three have the same relationship with financial performance and firm value. The Environmental Score, contrary to what would be expected, is negatively associated with ROE and Tobin’s Q. The Social Score is the only score that is positively connected with all financial performance and firm value variables. Finally, the Corporate Governance Score has a positive relationship with both ROA and ROE, however, it does not have a relevant relationship with Tobin’s Q. However, most of these results, for the exception of the relationships between Social Score and Tobin’s Q and between Governance Score and ROA, did not pass the robustness test conducted. Nonetheless, this is relevant information for managers as they need to understand which CSR activities will be the most impactful and advantageous to undertake, in order to design the best strategy possible for their companies. Recalling that managers must focus on the CSR activities that create the most synergy between the social objectives of society and the companies’ economic objectives (Carroll et al., 2010), according to results obtained, these activities are the ones that fall into the Social and Governance pillars. Companies that take into consideration
29
and improve the community around them, respect human rights, that offer opportunities to minorities, that produce ethically and do not employ slave labor, among many other activities are those that are, generally, positively associated with higher returns.
At a country level, countries in central Europe are the top performers of the sample and are those that demonstrate better positive links between CSR performance and firm financial performance/value.
In conclusion, managers are encouraged to implement CSR activities into their company’s strategy. The world is expecting more and more out of companies and they need to behave accordingly. The CSR mindset is here to stay and will continue to shape the business environment, thus, as soon as companies start to get involved, the sooner they can reap its rewards and benefit from its perks.
30
8. Tables
Table 1 – Weights attributed to each CSR category.
Category Weight Resource Use 0.11 Emissions 0.12 Innovation 0.11 Workforce 0.16 Human Rights 0.045 Community 0.08 Product Responsibility 0.07 Management 0.19 Shareholders 0.07 CSR Strategy 0.045
Table 2- List of Variables. This Table introduces and defines all the dependent, independent and control variables used in the research.
Variables Abbreviation Description
Return on Assets ROA Ratio of Net Income per Total Assets Return on Equity ROE Ratio of Net Income per Total Equity Tobin's Q it Q Tobin’s Q, at time t for each company i
ESG Score ESG Total ESG score
High ESG Score HiESG Dummy variable which will be equal to 1 if the total ESG score ≥ 90 and 0 otherwise.
Low ESG Score LoESG Dummy variable which will be equal to 1 if the total ESG score ≤ 20 and 0 otherwise.
Environmental Score ENV Score awarded for Environmental performance Social Score SOC Score awarded for Social performance
Governance Score GOV Score awarded for Governance performance Log of Total Assets lnASSETS The logarithm of the book value of Total Assets Debt on Assets DEpAS Ratio of Total Debt per Total Assets
Log of Total Sales lnSALES Logarithm of Total Sales
Sales Growth SGROW Ratio of Current Year's Net Sales or Revenues per Last Year's Total Net Sales
Α The intercept term
Β Coefficient
31
Γ A vector of coefficients
ε The error term
Table 3 - Summary Statistics. The sample consists of firm-year observations from 2002 to 2017. All data is retrieved from Thomson Reuters Datastream. The variables are winsorized at 1% tails. The sample includes all firms with non-missing observations for the years and variable below.
Variable N Mean Median SD Kurtosis Skewness Min Max P25 P75 ESG Score 4000 62.44 63.94 15.00 2.66 -0.37 16.74 96.23 52.66 73.33 ENV Score 4000 74.87 87.77 25.13 3.21 -1.24 8.39 97.42 63.51 93.26 SOC Score 4000 75.52 85.67 23.71 3.62 -1.28 3.84 99.37 63.89 93.4 GOV Score 4000 59.86 65.18 25.90 2.21 -0.52 1.49 97.96 40.4 82.49 ROA 4000 6.08 5.42 18.55 10.66 -0.13 -53.22 34.38 2.32 9.07 ROE 3696 13.52 13.58 18.55 14.34 -1.52 -108.9 69.34 6.90 20.97 Tobin's Q 3936 0.91 0.65 0.93 13.75 2.75 0.01 6.70 0.35 1.13 ln(Sales) 4000 15.54 15.51 1.58 2.57 -0.07 10.00 19.70 14.39 16.74 Sales Growth 3696 16.76 4.41 624.37 3683.7 60.64 -83.19 37938 -1.64 11.86 ln(BV Assets) 4000 16.13 15.89 1.75 2.97 0.56 12.03 21.56 14.81 17.24 Debt on Assets 4000 0.27 0.25 0.16 3.56 0.61 0 1.14 0.15 0.37
Table 4 - The table reports the OLS coefficients and the corresponding t-statistic in parentheses from the regressions of ROA, ROE and Tobin’s Q on the overall ESG Score. All regressions include Year Dummies and, where indicated, Country Dummies as well. The significance of 1, 5 and 10 per cent of the coefficients are represented by ***, ** and *, respectively.
ROA (1) ROE (2) Tobin's Q (3) ROA (4) ROE (5) Tobin's Q (6) ESG Score 0.038*** 0.106*** 0.008*** 0.036*** 0.099*** 0.008***
(4.87) (4.92) (8.52) (4.59) (4.43) (8.65) ln(Book Value of Assets) -1.809*** -3.004*** -0.15*** -1.778*** -2.919*** -0.180***
(-17.53) (-11.48) (-20.04) (-16.75) (-10.98) (-22.32) Debt on Assets -4.868*** -2.99 -4.424*** -2.618 (-7.45) (1.52) (-6.68) (-1.30) ln(Sales) 0.733*** 2.294*** 0.822*** 2.599*** (-6.39) (7.47) (6.86) (8.09) ROA 0.072*** 0.069*** (40.72) (39.76) Sales Growth 0 0 (-0.63) (-0.57) Constant 22.812*** 20.66*** 2.521*** 22.226*** 17.352*** 2.917*** (21.23) (7.08) (21.12) (17.61) (5.08) (21.35)
Year Dummies Yes Yes Yes Yes Yes Yes
Country Dummies No No No Yes Yes Yes
Observations 4000 3872 3664 4000 3872 3664
Number of firms 250 242 229 250 242 229
F-test 11.82 13.4 6.29 12.26 13.56 6.98
32 Table 5 - The table reports the OLS coefficients and the corresponding t-statistic in parentheses from the regressions of ROA, ROE and Tobin’s Q on the dummies High ESG Score and Low ESG Score. All regressions include Year Dummies and, where indicated, Country Dummies as well. The significance of 1, 5 and 10 per cent of the coefficients are represented by ***, ** and *, respectively.
ROA (1) ROE (2) Tobin's Q (3) ROA (4) ROE (5) Tobin's Q (6) High ESG Score 2.35*** 5.373** 0.423*** 2.224** 5.647** 0.339***
(2.61) (2.30) (4.17) (2.51) (2.43) (3.42) Low ESG Score -0.048 -8.170 -0.166 -0.295 -8.516 -0.054 (-0.02) (-1.04) (-0.52) (-0.10) (-1.08) (-0.18) ln(Book Value of Assets) -1.752*** -2.819*** -0.133*** -1.712*** -2.750*** -0.158***
(-17.04) (-10.88) (-18.37) (-16.28) (-10.46) (-20.63) Debt on Assets -4.72*** -2.549 -4.314*** -2.236 (-7.19) (-1.29) (-6.49) (-1.11) ln(Sales) 0.779*** 2.439*** 0.867 2.728*** (6.80) (7.97) (7.25) (8.52) ROA 0.073*** 0.069*** (40.95) (39.93) Sales Growth 0 0 (-0.59) (-0.55) Constant 23.317*** 21.865*** 2.627*** 22.345*** 17.797*** 2.954*** (21.61) (7.46) (21.76) (17.64) (5.19) (21.36)
Year Dummies Yes Yes Yes Yes Yes Yes
Country Dummies No No No Yes Yes Yes
Observations 4000 3872 3664 4000 3872 3664
Number of firms 250 242 229 250 242 229
F-test 11.4 12.74 7.13 11.83 12.97 8.09
33 Table 6 - The table reports the OLS coefficients and the corresponding t-statistic in parentheses from the regressions of ROA, ROE and Tobin’s Q on the three individual pillars of ESG. All regressions include Year Dummies and, where indicated, Country Dummies as well. The significance of 1, 5 and 10 per cent of the coefficients are represented by ***, ** and *, respectively.
ROA (1) ROE (2) Tobin's Q (3) ROA (4) ROE (5) Tobin's Q (6) Environmental Score -0.003 -0.046*** -0.001** -0.005 -0.050*** -0.002*** (-0.61) (-2.78) (-2.10) (-0.79) (-2.97) (-2.80) Social Score 0.019*** 0.079*** 0.006*** 0.025*** 0.092*** 0.006*** (2.92) (4.39) (8.94) (3.85) (4.94) (8.61) Governance Score 0.012** 0.046*** -0.001 -0.005 0.012 0 (2.48) (3.49) (-2.48) (-0.91) (0.76) (0.63) ln(Book Value of Assets) -1.713*** -2.827*** 0.152*** -1.659*** -2.665*** -0.175***
(-16.88) (-10.97) (-19.77) (-15.86) (-10.15) (-21.61) Debt on Assets -5.145*** -4.309** -4.632*** -3.670* (-7.88) (-2.20) (-7.01) (-1.83) ln(Sales) 0.641*** 2.124*** 0.730*** 2.383*** (5.41) (6.64) (5.91) (7.17) ROA 0.072*** 0.068*** (41.07) (39.94) Sales Growth 0 0 (-0.84) (-0.76) Constant 23.267*** 22.140*** 2.646*** 22.730*** 19.294*** 2.968*** (21.49) (7.55) (22.28) (17.92) (5.62) (21.95)
Year Dummies Yes Yes Yes Yes Yes Yes
Country Dummies No No No Yes Yes Yes
Observations 4096 3968 3744 4096 3968 3774
Number of firms 256 248 234 256 248 234
F-test 11.08 12.56 6.33 11.68 12.62 6.83
34 Table 7 - The table reports the OLS coefficients and the corresponding t-statistic in parentheses from the regression of ROA on the overall ESG Score and the three individual pillars. The results are shown by country. All regressions include Year Dummies. The significance of 1, 5 and 10 per cent of the coefficients are represented by ***, ** and *, respectively.
ESG Score Environmental Score Social Score Governance Score # Firms Coefficient t-stat Coefficient t-stat Coefficient t-stat Coefficient t-stat Belgium 10 -0.041 (-1.19) -0.095*** (-3.52) 0.051* (1.74) -0.023 (-1.02) Germany 23 0.063*** (3.25) -0.067*** (-4.14) 0.022 (1.13) 0.068*** (4.43) Finland 11 0.005 (0.15) -0.023 (-1.20) -0.012 (-0.52) 0.059*** (2.95) Italy 15 -0.010 (-0.68) 0.01 (0.84) 0.007 (0.50) -0.043*** (-4.01) Netherlands 14 0.045 (1.55) 0.025 (1.33) 0.022 (0.67) 0.002 (0.10) Spain 14 0.005 (0.16) -0.024 (-0.68) 0.04 (1.11) -0.036 (-1.38) Austria 4 -0.064 (-1.37) -0.019 (-0.89) 0.009 (0.34) -0.028 (-1.40) France 31 -0.019 (-1.20) 0.030** (2.16) 0.012 (0.77) -0.031*** (-3.58) Greece 6 -0.093*** (-2.70) -0.027 (-0.69) 0.013 (0.29) -0.016 (-0.51) Ireland 5 -0.119* (-1.90) -0.085** (-2.34) 0.045 (1.09) -0.034 (-0.96) Denmark 9 0.082 (1.12) -0.061 (-0.76) 0.139** (2.13) -0.114*** (-2.75) Norway 5 0.021 (0.19) -0.165*** (-4.01) 0.210*** (3.57) 0.129*** (2.84) UK 55 0.052** (2.31) -0.014 (-0.81) 0.029 (1.56) 0.018 (1.00) Switzerland 25 0.062*** (3.13) 0.017 (0.92) 0.012 (0.66) 0.012 (0.62) Sweden 23 0.057** (2.16) 0.018 (1.06) 0 (0.00) 0.036** (2.19)
Table 8 - The table reports the OLS coefficients and the corresponding t-statistic in parentheses from the regression of ROE on the overall ESG Score and the three individual pillars. The results are shown by country. All regressions include Year Dummies. The significance of 1, 5 and 10 per cent of the coefficients are represented by ***, ** and *, respectively.
ESG Score Environmental Score Social Score Governance Score # Firms Coefficient t-stat Coefficient t-stat Coefficient t-stat Coefficient t-stat Belgium 10 0.072 (0.64) -0.330*** (-3.60) 0.282*** (2.83) 0.043 (0.57) Germany 23 0.144** (2.25) -0.134** (-2.17) 0.005 (0.08) 0.153*** (2.86) Finland 11 -0.163* (-1.94) 0.121** (-2.13) -0.003 (-0.05) 0.115** (2.21) Italy 15 0.107* (1.85) 0.016 (0.36) 0.046 (0.81) -0.106*** (-2.58) Netherlands 14 -0.041 (-0.48) 0.022 (0.40) -0.166* (-1.68) 0.07 (1.00) Spain 14 -0.107 (-1.06) -0.085 (-0.76) 0.014 (0.13) 0.002 (0.02) Austria 4 -0.173 (-0.99) -0.205*** (-2.81) 0.125 (1.30) -0.028 (-0.40) France 31 -0.054 (-0.96) -0.090* (-1.80) 0.194*** (3.97) -0.050 (-1.56) Greece 6 -0.319* (-1.92) -0.166 (-0.86) 0.243 (1.12) -0.187 (-1.15) Ireland 5 -0.058 (-0.64) -0.149** (-2.11) 0.055 (0.74) 0.067 (0.81) Denmark 9 0.244 (1.59) -0.108 (-0.68) 0.243* (1.81) -0.104 (-1.28) Norway 5 -0.192 (-0.80) -0.468*** (-4.03) 0.350** (2.35) 0.359*** (2.77) UK 55 0.120* (1.87) 0.012 (0.26) 0.114** (2.10) 0.044 (0.91) Switzerland 25 0.179*** (3.67) 0.064 (1.40) 0.026 (0.59) 0.032 (0.76) Sweden 23 0.026 (0.44) 0.023 (-0.56) -0.019 (-0.41) 0.032 (0.82)
35 Table 9 - The table reports the OLS coefficients and the corresponding t-statistic in parentheses from the regression of Tobins’ Q on the overall ESG Score and the three individual pillars. The results are shown by country. All regressions include Year Dummies. The significance of 1, 5 and 10 per cent of the coefficients are represented by ***, ** and *, respectively.
ESG Score Environmental Score Social Score Governance Score # Firms Coefficient t-stat Coefficient t-stat Coefficient t-stat Coefficient t-stat Belgium 10 0.005 (1.37) 0.003 (1.23) -0.007*** (-3.80) 0 (0.05) Germany 23 0.011*** (3.93) -0.023*** (-8.29) 0.012*** (4.37) 0.012*** (6.01) Finland 11 0 (-0.09) -0.005 (-1.05) 0.003 (0.56) 0.010*** (3.00) Italy 15 0.002 (1.21) 0 (0.11) 0.001 (0.70) -0.03** (-2.18) Netherlands 14 0.003 (0.84) -0.007 (-1.59) 0.010*** (2.67) 0.001 (0.23) Spain 14 -0.002 (-0.22) -0.006 (-0.51) 0.016 (0.32) -0.003 (-0.53) Austria 4 -0.002 (-0.35) -0.003 (-0.73) 0.006 (0.78) 0.005 (1.32) France 31 -0.007** (-2.16) -0.002 (-0.71) 0.001 (0.25) -0.007*** (-4.74)
Greece 6 n.a. n.a. n.a. n.a. n.a. n.a. n.a. n.a.
Ireland 5 0.013** (2.54) 0.008*** (3.22) 0.005 (1.28) -0.001 (-0.27) Denmark 9 0.023 (1.62) 0.014 (0.93) 0.008 (0.58) -0.005 (-0.68) Norway 5 -0.006 (-0.65) -0.009 (-1.36) 0.013** (2.11) -0.010* (-1.91) UK 55 0.012*** (4.21) 0 (-0.11) 0.004* (1.91) 0.004* (1.85) Switzerland 25 0.008** (2.37) 0.003 (0.79) -0.003 (-0.71) 0.007** (2.16) Sweden 23 0.005 (1.40) -0.003 (-1.01) 0.001 (0.48) 0.006*** (2.97)
36 Table 10 – Robustness Test. The table reports the OLS coefficients and the corresponding t-statistic in parentheses from the regressions of ROA, ROE and Tobin’s Q on the dummy AFTER*ESG and the overall ESG Score. The significance of 1, 5 and 10 per cent of the coefficients are represented by ***, ** and *, respectively.
ROA (1) ROE (2) Tobin's Q (3) ROA (4) ROE (5) Tobin's Q (6)
AFTER*ESG 0.016 0.068*** 0.00 0.018* 0.081*** -0.001
(1.58) (2.61) (-0.02) (1.79) (2.95) (-0.68) ESG Score 0.032*** 0.079*** 0.008*** 0.029*** 0.066*** 0.008***
(5.05) (3.63) (11.82) (4.35) (2.95) (12.92) ln(Book Value of Assets) -1.810*** -3.004*** -0.155*** -1.780*** -2.919*** -0.180***
(-15.93) (-8.47) (-19.93) (-12.70) (-787) (-18.66) Debt on Assets -4.878*** -2.991* -4.431*** -2.603 (-6.64) (-1.88) (-6.13) (-1.41) ln(Sales) 0.731 2.282*** 0.822*** 2.595*** (4.25) (6.31) (3.81) (5.53) ROA 0.072*** 0.069*** (13.75) (12.63) Sales Growth 0.00*** 0.00*** (-6.82) (-6.44) Constant 22.793*** 20.563*** 2.521*** 22.216*** 17.223*** 2.917*** (16.43) (6.31) (22.07) (13.84) (4.58) (18.41)
Year Dummies Yes Yes Yes Yes Yes Yes
Country Dummies No No No Yes Yes Yes
Observations 4000 3872 3664 4000 3872 3664
Number of firms 250 242 229 250 242 229
F-test 269.57 52.65 161.63 - - -
37 Table 11 - Robustness Test. The table reports the OLS coefficients and the corresponding t-statistic in parentheses from the regressions of ROA, ROE and Tobin’s Q on the dummies AFTER*HighESGscore, AFTER*LowESGscore, and the dummies High ESG score and Low ESG score. The significance of 1, 5 and 10 per cent of the coefficients are represented by ***, ** and *, respectively.
ROA (1) ROE (2) Tobin's Q (3) ROA (4) ROE (5) Tobin's Q (6) AFTER*High ESG Score 1.353 -2.366 0.288** 2.441* 0.815 0.552***
(1.18) (-0.76) (2.16) (1.83) (-0.24) (4.49) AFTER*Low ESG Score 1.852 -15.903 -0.027 0.555 -19.331 -0.004 (1.14) (-1.03) (-0.19) (0.33) (-1.24) (-0.01) High ESG Score 1.335* 7.156*** 0.218*** 0.386 6.254*** -0.069 (1.90) (3.90) (2.61) (0.46) (3.15) (-0.90) Low ESG Score -0.788 -1.811* -0.155** -0.521 -0.730 -0.054 (-1.08) (-1.65) (-2.32) (0.67) (-0.49) (0.17) ln(Book Value of Assets) -1.745*** -2.806*** -0.133*** -1.715*** -2.737*** -0.158***
(-15.44) (-8.24) (-21.94) (-12.22) (-7.51) (-19.79) Debt on Assets -4.721*** -2.558 -4.311*** -2.257 (-6.36) (-1.55) (-5.90) (-1.18) ln(Sales) 0.781*** 2.430*** 0.872*** 2.718*** (4.69) (5.96) (4.14) (5.83) ROA 0.073*** 0.069*** (13.98) (12.94) Sales Growth 0.00*** 0.00*** (-6.08) (-5.84) Constant 23.321*** 21.808*** 2.627*** 22.326*** 17.819*** 2.953*** (16.13) (6.60) (25.54) (13.47) (4.57) (20.73)
Year Dummies Yes Yes Yes Yes Yes Yes
Country Dummies No No No Yes Yes Yes
Observations 4000 3872 3664 4000 3872 3664
Number of firms 250 242 229 250 242 229
F-test 174.93 18.51 211.32 - - -
38 Table 12 - Robustness Test. The table reports the OLS coefficients and the corresponding t-statistic in parentheses from the regressions of ROA, ROE and Tobin’s Q on the dummies AFTER*Env. Score, AFTER*Social Score, AFTER*Gov. Score, and the independent variables Environmental score, Social score and Governance score. The significance of 1, 5 and 10 per cent of the coefficients are represented by ***, ** and *, respectively.
ROA (1) ROE (2) Tobin's Q (3) ROA (4) ROE (5) Tobin's Q (6) AFTER*Env. Score 0.056*** 0.160*** 0.005*** 0.052*** 0.150*** 0.005*** (3.93) (3.68) (3.54) (3.62) (3.39) (3.36) AFTER*Social Score -0.034*** -0.106*** 0.001 -0.032*** -0.101*** 0.000 (-2.72) (-3.01) (0.45) (-2.62) (-3.02) (-0.32) AFTER*Gov. Score 0.005 0.059*** -0.004*** 0.011 0.070*** -0.003*** (0.41) (3.43) (-4.75) (1.00) (4.00) (-3.94) Environmental Score -0.019*** -0.087*** -0.003*** -0.018*** -0.088*** -0.003*** (-2.81) (-7.42) (3.35) (-2.68) (-7.49) (-3.57) Social Score 0.029*** 0.113*** 0.006*** 0.035*** 0.124*** 0.006*** (3.11) (4.99) (8.36) (3.69) (5.24) (8.34) Governance Score 0.010 0.020 0.000 -0.009 -0.018 0.002** (1.47) (1.54) (0.56) (-1.41) (-1.39) (2.22) ln(Book Value of Assets) -1.723*** -2.845*** 0.154*** -1.669*** -2.690*** -0.177***
(-15.58) (-9.13) (-21.78) (-12.40) (-8.18) (-18.44) Debt on Assets -5.068*** -4.225*** -4.599*** -3.685** (-7.38) (-2.83) (-6.85) (-2.17) ln(Sales) 0.636*** 2.083*** 0.724*** 2.355*** (3.59) (5.16) (3.19) (4.84) ROA 0.071*** 0.068*** (13.69) (12.81) Sales Growth 0.00*** 0.00*** (-8.10) (-7.54) Constant 23.078*** 21.417*** 2.643*** 22.508*** 18.393*** 2.970*** (17.47) (6.27) (24.25) (13.82) (4.57) (18.34)
Year Dummies Yes Yes Yes Yes Yes Yes
Country Dummies No No No Yes Yes Yes
Observations 4096 3968 3744 4096 3968 3744
Number of firms 256 248 234 256 248 234
F-test 314.77 88.63 118.48 - - -