Página | 28
https://periodicos.utfpr.edu.br/rbfta
Load Cells Calibration With a Low Cost Data
Acquisition System
Abstract
Pedro Leineker Ochoski Machado [email protected]
orcid.org/0000-0003-0141-8081 Universidade Tecnológica Federal do Paraná (UPR), Ponta Grossa, Paraná, Brasil.
Luis Vitorio Gulineli Fachini [email protected]
https://orcid.org/0000-0001-9814-2805 Universidade Tecnológica Federal do Paraná (UPR), Ponta Grossa, Paraná, Brasil.
Vitor Otávio Ochoski Machado [email protected]
orcid.org/0000-0003-2232-6629 Universidade Tecnológica Federal do Paraná (UPR), Ponta Grossa, Paraná, Brasil.
Romeu Miqueias Szmoski
https://orcid.org/0000-0002-0968-7158 Universidade Tecnológica Federal do Paraná (UPR), Ponta Grossa, Paraná, Brasil.
Thiago Antonini Alves
https://orcid.org/0000-0003-2950-7377 Universidade Tecnológica Federal do Paraná (UPR), Ponta Grossa, Paraná, Brasil.
In the present work, an experimental analysis was performed to obtain the calibration curve of three load cells connected in series. The control of the load applied on a given component is an important factor in some engineering applications, for example, in cases where it is desired to increase the heat exchange between two surfaces. One of the ways to control the applied load is the use of load cells, which has as its principle of use a strain gauge that has its resistance varied when it undergoes a deformation, thus causing a voltage variation due to the application of load. This study used an ArduinoTM microcontroller as a data acquisition system and blocks with known mass for load application. In this way it was possible to obtain the calibration curve of the load cells by means of linear regression between the mass of the blocks and the data obtained by the ArduinoTM microcontroller and verify their applicability according to their measurement uncertainties.
Página | 29
INTRODUCTION
Certain engineering applications require the control of the load / pressure exerted on a particular component, for example, in a case wich is desired to increase the efficiency of the heat exchange between two surfaces, since the effective area of contact between the surfaces is dependent on the load applied to them, thus altering the thermal contact resistance therein (GARCIA; CARAJILESCOV, 1989).
One of the ways to measure the application of loads is the use of load cells, which consist of electromechanical transducers that can be used to measure fluid pressure, torque, loads, and others (BECK, 1983). Its principle of operation is based on the use of a strain gauge that, when having a load applied on itself, undergoes a deformation that entails in the variation of its resistance, causing the load to be captured as a voltage variation by data acquisition systems (JÚNIOR; DE MELO PERTENCE, 2010).
Data acquisition systems consist of scientific instrumentation devices capable of capturing physical conditions and converting them into electrical signals, which are subsequently transformed into numerical values that can be stored and processed computationally (EMILIO, 2013).
In order to reduce the costs of the data acquisition process, new ways of performing such control were developed, notably ArduinoTM. This platform uses
the open source philosophy, allowing its capacity to be exploited to the fullest, and various information about its use and operation are available, making even people with little programming knowledge able to enjoy its features. In addition, such a platform has several modules that can be connected to its hardware and programmed in the C ++ language via its software, expanding its functionalities according to the most different needs of data acquisition and also perform data acquisition automatically, and can even plot the data obtained in real time (D’AUSILIO, 2012).
In view of the presented facts, the present work aims to perform the calibration of load cells with an ArduinoTM microcontroller. In a future application,
the load cells will be used to control the load applied on a thermoelectric generator and to verify the influence of the clamping force on that component in its efficiency.
METHODOLOGY
This topic will present the methodology used for the development of this work.
EXPERIMENTAL APPARATUS
The experimental tests were performed in the Laboratory of Porous Media and Energy Efficiency (LabMPEE) linked to the Postgraduate Program in Mechanical Engineering (PPGEM) of the Academic Mechanics Department (DAMEC) of the Federal Technological University of Paraná (UTFPR). Ponta Grossa Campus.
Página | 30
The experimental workbench consisted of a computer, an ArduinoTM Uno, an
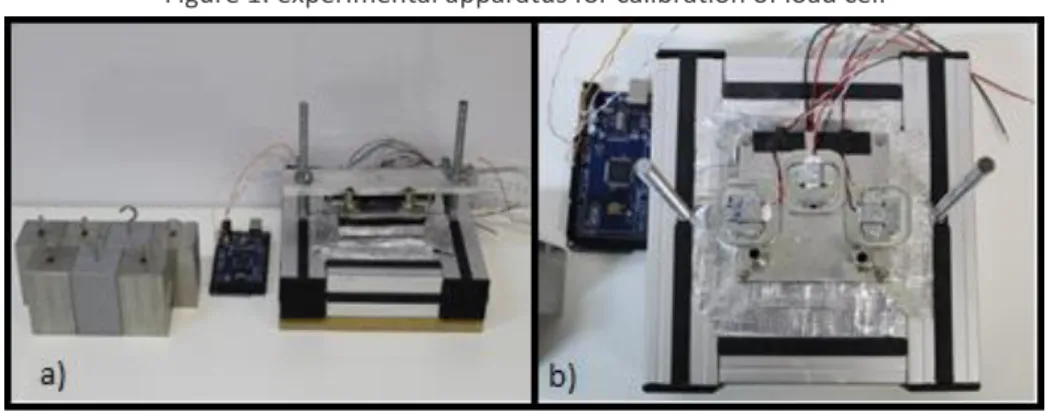
HX711 module, five 1020 steel blocks, 2 aluminum blocks and three load cells up to 50 kg, which have a resistive Wheatstone bridge strain gauge. The load cells are adapted to the experimental bench of the thermoelectric generator, as shown in
Figure 1 (a).
As for the thermoelectric generator, it is positioned on top of an aluminum block contained inside the base of the experimental bench. On its upper surface is a heat exchanger, making it necessary to exert a charge under such an exchanger to increase the effective contact between those three components.
To exert an equally distributed load between the three load cells, a metal sheet was inserted into two threaded bars, the tightening being done with two butterfly nuts. In order to have control of such a load, the three load cells were coupled between the surfaces of the heat exchanger and the metal plate using double-sided tape, as can be seen in Figure 1 (b).
Figure 1: experimental apparatus for calibration of load cell
Source: authors.
EXPERIMENTAL PROCEDURE
For the execution of the experimental tests, the load cells were connected in series so that, with 3 different points of reading, it is guaranteed that the reading represents the load on the entire surface of the heat exchanger, since 3 points are needed to form a plan. Figure 2 shows a diagram of the connections made between the load cells and the ArduinoTM microcontroller.
The readings performed by the load cells pass through the module HX711 so that they have their signal amplified, allowing the reading by the micro controller. The ArduinoTM in turn has been programmed to convert the voltage data supplied
by the module to mass values, which corresponds to the load applied to the thermoelectric generator. Both the HX711 module and the load cells are powered with a 5V voltage supplied by the ArduinoTM microcontroller.
To apply the load, five steel blocks and two aluminum blocks were used, all with mass previous measured by means of an analytical balance. The blocks were stacked on the metal sheet one at a time and the mass values obtained by the load cells were recorded until all the blocks were used, as can be seen in Figures 3 (a) and (b), where (a) shows the positioning of the blocks and (b) shows the total load applied and the way the blocks were used together.
Página | 31
Figure 2: diagram of connections
Source: authors
With the values of the real mass of the blocks and mass obtained by the load cells, a linear adjustment was made in order to obtain the calibration curve of the load cells.
Figure 3: experimental procedure for calibration of load cell
Source: authors.
After implementing the calibration curve in the programming of the ArduinoTM, five measurements of the masses of the blocks were carried out in
order to guarantee the reliability of the obtained mass values, as well as to verify the experimental uncertainty found by the values presented in the load cells.
Página | 32
RESULTS AND DISCUSSIONS
The masses of the blocks were obtained using an analytical balance and can be observed in Table 1.
Table 1: block mass Block Mass [Kg] A 0.79460 B 0.79417 C 0.79502 D 0.79533 E 0.79305 F 0.27523 G 0.27476 Source: authors.
The blocks were arranged during the calibration in order to obtain the largest number of reading points. Each block combination was placed one at a time on the load cells and the reading value was recorded. The values of the actual mass and mass read by the load cells can be seen in Table 2.
Table 2: load cell mass
Actual Mass [kg] Load Cell Mass [kg]
0.00000 -0.2 0.27523 0.8 0.54999 1.8 0.79460 2.6 1.06983 3.5 1.34459 4.4 1.58877 5.3 1.86400 6.2 2.13876 7.0 2.38379 7.9 2.65902 8.7 2.93378 9.5 3.17912 10.3 3.45435 11.1 3.72911 11.8 3.97217 12.6 4.24740 13.3 4.52216 13.9 Source: authors.
The data in Table 2 were plotted and a linear regression was performed in order to obtain the calibration curve of the load cells, which can be observed in Figure 4.
Página | 33
Table 2 and Figure 4 show the need to calibrate the load cells, since when
converting the strain variation in mass units, no values corresponding to the actual mass of the blocks are obtained.
Figure 4: calibration curve of the load cells
Source: authors.
In spite of this, it is verified that there is a linearity in the obtained data, since each increment of mass added by blocks causes a proportional increase in the mass read, what justifies a curve adjustment with coefficient of termination R² near 1.
Equation (1) provides the calibration curve for the load cells:
𝑀 = 0.3173𝑚 − 0,0393
(1)in wich (M) corresponds to the mass read after the calibration and (m) to the mass obtained by the variation of the stress related to the strain caused by the load cell strain gauge. Equation (1) has been inserted into the computational routine used to control the load cells in order to correct the readings performed by them, as can be seen in detail in Figure 5.
In order to verify the uncertainties presented by the load cell measurements, five measurements of the mass of the blocks were made, determining the mean and standard deviation of these measurements, as can be seen in Tables 3 and 4. The percent relative difference refers to the module of the difference between the mass of the blocks and the mean of the measurements, taking all the values to one decimal place, which corresponds to the smaller precision presented by the instruments used for measurement.
Página | 34
Figure 5: computational routine for control of load cells
Página | 35
Table 3: measures taken after calibration Actual mass [kg] Load cell mass [kg]
# 1 # 2 # 3 # 4 # 5 0.00000 -0.1 -0.1 -0.1 -0.1 -0.1 0.27523 0.2 0.2 0.2 0.2 0.2 0.54999 0.5 0.4 0.5 0.5 0.5 0.7946 0.7 0.7 0.8 0.8 0.8 1.06983 1.1 1.0 1.1 1.1 1.1 1.34459 1.3 1.2 1.3 1.4 1.4 1.58877 1.6 1.5 1.6 1.6 1.7 1.86400 1.9 1.7 1.9 1.9 1.9 2.13876 1.9 2.0 2.1 2.2 2.2 2.38379 2.3 2.2 2.4 2.4 2.5 2.65902 2.6 2.5 2.7 2.7 2.8 2.93378 2.9 2.7 2.9 3.0 3.0 3.17912 3.1 3.0 3.2 3.2 3.3 3.45435 3.4 3.2 3.4 3.5 3.6 3.72911 3.6 3.4 3.7 3.7 3.8 3.97217 3.9 3.7 3.9 4.0 4.1 4.24740 4.1 3.9 4.1 4.2 4.3 4.52216 4.4 4.1 4.4 4.4 4.6 Source: authors.
Analyzing Table 3, it can be seen that for a given mass value, the measurement obtained by the load cells can be varied, either by a vibration present at the time of measurement or else the mass is not equally distributed between the three load cells.
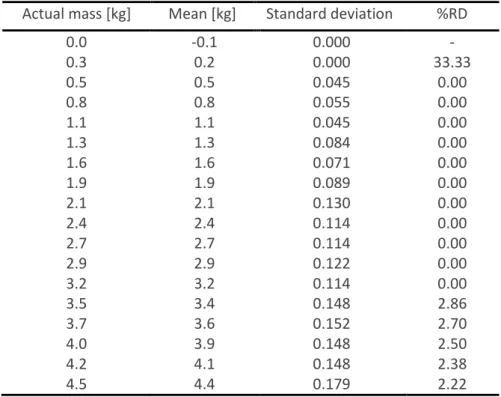
Table 4: mean and standard deviation of measurements after calibration
Source: authors.
Actual mass [kg] Mean [kg] Standard deviation %RD
0.0 -0.1 0.000 - 0.3 0.2 0.000 33.33 0.5 0.5 0.045 0.00 0.8 0.8 0.055 0.00 1.1 1.1 0.045 0.00 1.3 1.3 0.084 0.00 1.6 1.6 0.071 0.00 1.9 1.9 0.089 0.00 2.1 2.1 0.130 0.00 2.4 2.4 0.114 0.00 2.7 2.7 0.114 0.00 2.9 2.9 0.122 0.00 3.2 3.2 0.114 0.00 3.5 3.4 0.148 2.86 3.7 3.6 0.152 2.70 4.0 3.9 0.148 2.50 4.2 4.1 0.148 2.38 4.5 4.4 0.179 2.22
Página | 36
Thus, a reading range can be estimated for the load cells, this range being the average of the five readings and more or less a standard deviation, as can be observed in Figure 6.
Figure 6: reading ranges after calibration
Source: authors.
Then, by means of Figure 6, the intervals corresponding to the possible values obtained by the cells for each mass value are verified, so that, when using a mass of 1.9 kg, for example, one can obtain a value between 1.8 kg and 2 kg, since the value supplied has an accuracy of only one decimal place.
In general, it is verified that, after calibration, the values obtained by the load cells were very close to the values of mass used for calibration, since, by performing a linear regression of the readings after calibration, a curve next to "Y = x" is obtained. Furthermore, by bringing all values to the same precision of the instrument with less precision, the percentage of relative difference remained below 5% in practically all cases, except for 0.3 kg, which is justified by the fact of the absolute value is small, so that any small change in the value obtained after calibration represents a large relative difference. Thus, the use of load cells is recommended for applications where extreme accuracy is not required for the load on a given component.
As a suggestion for future work, in order to reduce the calibration uncertainty and approximate the mean value of the actual value of the masses, a way can be developed to ensure that the analyzed mass is equally distributed between the load cells, in addition to using a larger number of masses during the calibration, in order to perform a linear regression with as many points as possible.
Página | 37
CONCLUSION
In this work, an experimental analysis was performed to obtain the calibration curve of three load cells connected in series using ArduinoTM. For this, a
programming was done in ArduinoTM aiming to collect the data provided by the
load cells when applying controlled loads by blocks of known mass. Thus, it became possible to obtain the calibration curve of the load cells by performing a linear regression between the masses of the blocks and the values presented in each measurement. After calibration, five measurements of the masses of the blocks were taken, making it possible, from the mean of the measurements and also the standard deviation, to verify the measurement uncertainties for the load cells, proving to be satisfactory for applications that require low accuracy in the applied load data.
ACKNOWLEDGMENTS
Acknowledgments are provided to the CAPES, the CNPq, the PROPPG/UTFPR, the DIRPPG/UTFPR, the PPGEM/UTFPR/Ponta Grossa, and the DAMEC/UTFPR/ Ponta Grossa.
Página | 38
Calibração de células de carga utilizando
sistema de aquisição de dados de baixo
custo
RESUMO
No presente trabalho, uma análise experimental foi realizada para obter a curva de calibração de três células de carga conectadas em série. O controle da carga aplicada em um determinado componente é um fator importante em algumas aplicações de engenharia, por exemplo, nos casos em que se deseja aumentar a troca de calor entre duas superfícies. Uma das maneiras de controlar a carga aplicada é o uso de células de carga, que tem como princípio de uso um extensômetro que tem sua resistência variada quando sofre uma deformação, causando assim uma variação de tensão devido à aplicação de carga. Este estudo utilizou o ArduinoTM como um sistema de aquisição de dados e blocos com massa conhecida para aplicação de carga. Desta forma foi possível obter a curva de calibração das células de carga por meio de regressão linear entre a massa dos blocos e os dados obtidos pelo ArduinoTM e verificar sua aplicabilidade de acordo com suas incertezas de medição. Palavras chave: Células de carga; ArduinoTM; Calibração de células de carga.
Página | 39
Calibración de celdas de carga con un
sistema de adquisición de datos de bajo
costo
RESUMEN
En el presente trabajo, se realizó un análisis experimental para obtener la curva de calibración de tres celdas de carga conectadas en serie. El control de la carga aplicada a un componente dado es un factor importante en algunas aplicaciones de ingeniería, por ejemplo, en los casos en que se desea aumentar el intercambio de calor entre dos superficies. Una de las formas de controlar la carga aplicada es el uso de celdas de carga, que tiene como principio de uso un medidor de tensión cuya resistencia varía cuando sufre una deformación, lo que provoca una variación de voltaje debido a la aplicación de la carga. Este estudio utilizó ArduinoTM como un sistema de adquisición de datos y bloques con masa conocida para la aplicación de carga. De esta manera, fue posible obtener la curva de calibración de las celdas de carga mediante regresión lineal entre la masa de los bloques y los datos obtenidos por ArduinoTM y verificar su aplicabilidad según sus incertidumbres de medición.
Página | 40
REFERENCES
BECK, J. C. P. Projeto, construção e analise de células de carga de placa e de anel. 174f. Dissertação de Mestrado – UFRGS, Porto Alegre, 1983;
D’AUSILIO, A. Arduino: A low-cost multi purpose lab equipment. Behavior research methods, v. 44, n. 2, p. 305-313, 2012.
EMILIO, M. D. P. Data Acquisition Systems: From Fundamentals to Applied Design. 1.ed. USA: Springer, 2013;
GARCIA, E. C.; CARAJILESCOV, P. Medidas de Condutividade Térmica de Sólidos e Resistência Térmica de Contato sob Vácuo. Revista Brasileira de Aplicações de Vácuo, v. 8, n. 1-2, p. 141-145, 1989.
JÚNIOR, A. P.; DE MELO PERTENCE, A. E. Extensômetros em Engenharia Civil: teoria e aplicações. Construindo, Belo Horizonte, v. 2, n. 1, p. 24-26, jan./jun. 2010;
Recebido: 22 de maio de 2019. Aprovado: 27 de junho de 2019. DOI:
Como citar: MACHADO, P. L. O. et al. Load Cells Calibration With a Low Cost Data Acquisition System, Revista Brasileira de Física Tecnológica Aplicada, Ponta Grossa, v. 6, n.1, p. 28-40, junho. 2019.
Contato: Fulano de Tal: [email protected]
Direito autoral: Este artigo está licenciado sob os termos da Licença Creative Commons-Atribuição 4.0 Internacional.