Hydrolysis of ovine, caprine and bovine whey proteins
by trypsin and pepsin
Manuela E. Pintado, F. Xavier Malcata
Abstract Direct hydrolysis of whey leads to peptides that possess higher digestibility and better functional proper-ties, so they may to advantage be incorporated in food formulae to improve their performance. Incubation of pure bovine a-La and b-Lg, as well as of caprine, bovine and ovine wheys with trypsin and pepsin led to production of various hydrolysates, which absorb at 280 nm and are characterized by molecular weights ranging from ca. 8000 Da to less than 500 Da. Bovine a-La was slowly hy-drolyzed by trypsin but rapidly by pepsin, in either pure form or in whole whey. Bovine b-Lg was more rapidly broken down by trypsin, and less rapidly by pepsin than a-La, and a similar performance was observed when b-Lg was tested on whole whey. In most whey digests, a peak corresponding to a molecular weight comprised between 3000 and 4000 Da was observed by gel permeation chro-matography; it was detected mainly in ovine and caprine wheys, and grew slowly with incubation time in bovine whey but fast in wheys from the small ruminants. Incu-bation of the fraction corresponding to the unknown peak with pepsin did not produce any effect detectable by chromatography, yet incubation with trypsin led to a de-crease of the area of such peak and concomitant rise of the areas accounted for by low molecular weight peptides.
1
Introduction
Whey proteins are widely employed as food ingredients, e.g. as additives to improve textural and functional quality. Wheys from bovine, caprine and ovine origins exhibit similar pro®les, in terms of their major proteins, when analyzed by size exclusion chromatography. However, a peak of absorbance at 280 nm appears at higher retention times (thus corresponding to a low molecular weight compound) in ovine whey and, to a lesser extent, in cap-rine whey, but not in bovine whey [1±3]; however, its exact chemical nature remains unknown.
Enzymatic hydrolysis of bovine whey proteins has proven important in improving their functional proper-ties, as well as in reducing allergenic effects of a-La and b-Lg and in enhancing taste [4±6]. Conversely, studies encompassing hydrolysis of proteins from ovine and caprine wheys are scarce; it may be claimed that similar alterations can be imparted, thus making them more suitable for incorporation in infant formulae or specialty dairy products [7, 8], so a detailed knowledge pertaining to such hydrolyzate fractions is warranted.
In order to obtain whey hydrolyzates from distinct species and duly analyze their composition, one has decided to focus the research efforts upon tryptic and peptic hydrolyses of ovine, caprine and bovine wheys, as well as of pure bovine b-Lg and a-La (because these proteins are commercially available in pure form). Hydrolysis of the unknown peak referred to above was also performed to help shed light into its chemical nature.
2
Materials and methods 2.1
Reagents
Puri®ed bovine proteins (a-La and b-Lg), trypsin, pepsin, insulin chain B, insulin chain A, NAD, ribo¯avin, biotin, pantotenic acid, folic acid, thiamin, vitamin B12, nicotinic
acid, vitamin B6, tryptophan, tyrosine, histidine,
phenyl-alanine, orotic acid, uracyl, cytosine, guanidine and ade-nine were all purchased from Sigma (St. Louis MO, USA). Uric acid was purchased from Biotrol (France). Trichloro-acetic acid (TCA), NaCl, Na2HPO4, NaH2PO4, HCl,
ace-tone, TRIS and NaN3were obtained from Merck
(Darmstad, Germany). Ovine whey was obtained from a typical, homogeneous ¯ock of Bordaleira ewes, caprine whey from a typical, homogeneous ¯ock of Alpina goats
F. Xavier Malcata (&), M. E. Pintado Escola Superior de Biotecnologia, Universidade CatoÂlica Portuguesa, Rua Dr. AntoÂnio Bernardino de Almeida, P-4200-072 Porto, Portugal
Funding for author M. E. P. was provided by a Ph.D. fellowship issued within the framework of the CIENCIA Program (BD-2526/ 93) administered by Junta Nacional de InvestigacËaÄo Cientõ®ca e TecnoloÂgica (Portugal). Partial funding for this project was obtained from a research grant, issued within the framework of PRAXIS, entitled RecuperacËaÄo de proteõÂnas e producËaÄo de goma alimentar a partir de soro laÂcteo (PBICT/C/BIO991/95), administered by FundacËaÄo para a CieÃncia e a Tecnologia, Portugal, and from a grant by FundacËaÄo Luso-Americana para o Desenvolvimento, Portugal (project Characterization of the protein pro®le in ewe's whey) coupled with a grant by PAMAF, Portugal (project PROTOLACTIS: PROducËaÄo, por Tecnologias Optimizadas, de LACticõÂnios TradicionaIS), all under the coordination of author F. X. M. The authors are grateful to Prof. J. Warthesen for scienti®c criticisms.
and bovine whey from a typical, homogeneous herd of Frisian cows.
2.2 Equipment
Dialysis tubes (MW cutoff of 2000 Da) were purchased from Sigma. Filters and membranes of 0.22 lm were ob-tained from Nucleopore (Cambridge MA, USA). Recovery of precipitates was achieved in a RC5centrifuge from Sorval (Wilmington DL, USA). Size exclusion chromato-graphy was performed using the FPLC system of Phar-macia (Uppsala, Sweden) in a con®guration consisting of two P-500 positive displacement pumps, an electrically-powered MV-7 motorized valve, a gel ®ltration column prepacked with Superose 12 HR 10/30, an UV1 single path spectrophotometer monitor, a REC-102 double channel recorder and an LCC-500 controller.
2.3
Preparation of whey feedstocks
In order to obtain wheys from the three ruminant breeds as equivalent as possible to one another, each sample of milk was acidi®ed to pH 4.6 at 4 °C using 1 M HCl, and then heated to 46 °C for 10 min. After cooling, the su-pernatant was separated from the precipitate and the up-per layer of milk fat was removed by centrifugation at 8000g and 4 °C for 15min. The skimmed whey was then dialyzed for 24 h against distilled water so as to mimic some sort of whey protein concentrate (WPC) possessing higher content of protein and a low content of lactose and minerals. The dialyzate was then lyophilized until further use.
2.4
Separation of unknown whey fraction
Aliquots of ovine and caprine wheys (following prepara-tion as described above) were heated at 95 °C for 60 min. The supernatant was separated from the precipitate by centrifugation at 1500g for 30 min, and then subject to further precipitation with 12% (w/v) TCA; the new pre-cipitate was then separated from the supernatant by cen-trifugation at 1500g for 30 min, and further treated as described elsewhere [9] in order to obtain the proteose peptone fraction. The supernatant remaining after pre-cipitation brought about by TCA was dialyzed for 24 h against distilled water and lyophilized until further use. A concentrated fraction containing the unknown peak was obtained in a preparative fashion by pooling together the fractions from several injections of the solution of lyoph-ilizate into the FPLC system. Such fractions were then dialyzed against distilled water for 24 h at 4 °C in order to obtain the unknown peak free of salts for later enzymatic incubation. (Although mass spectrometry or chemical se-quencing could have been used in the characterization of said peak, that was not pursued owing to analytical limi-tations in our laboratory facilities).
2.5
Preparation of enzymatic hydrolyzates
Enzymatic digestion was performed using either trypsin, from a stock solution containing 2 mgenzyme/ml in 50 mM
aqueous phosphate buffer (pH 7.0) with 0.2 g/l of NaN3, or
pepsin, from a stock solution containing 1 mgenzyme/ml in
20 mM aqueous KCl/HCl buffer (pH 2); incubation was at 37 °C in a shaking water bath.
Enzymatic digestions of a-La (at 2.5mg/ml), b-Lg (at 2.5mg/ml), and caprine, ovine and bovine whey after preliminary dialysis (at 10, 10 and 20 mg/ml, respectively) were performed under the following conditions: 500 ll of sample were incubated with 300 ll (or 200 ll for the case of a-La and b-Lg) of a buffer (pH 7.0) for 24 h, with 300 ll (or 200 ll for the case of a-La and b-Lg) of stock solution of trypsin for 2.5and 24 h, with 300 ll (or 200 ll for the case of a-La and b-Lg) of a buffer (pH 2.0) for 2.5and 24 h, and 300 ll (or 200 ll for the case of a-La and b-Lg) of stock solution of pepsin for 2.5and 24 h. After having collected independently for ten times, the unknown frac-tion from both caprine and ovine wheys, these were duly dialyzed, the retentate was divided into two portions and both of them were lyophilized. The ®rst portion was dis-solved in 1.7 ml of phosphate buffer (pH 7.0), and 500 ll of this solution was incubated with 300 ll of buffer for 48 h and 300 ll of trypsin also for 48 h. The second por-tion was dissolved in 1.7 ml of KCl/HCl buffer (pH 2.0), and 500 ll of this solution was incubated with 300 ll of buffer for 48 h and 300 ll of pepsin also for 48 h. Fol-lowing hydrolysis, the samples were immediately frozen to quench the reaction.
2.6
Separation by size exclusion
Owing to ®xation and staining constraints associated with small peptides [10, 11] when employing electrophoresis, gel permeation chromatography was elected as analytical tool to monitor hydrolysis via assessment of the size of the peptide(s) formed.
Samples of native ovine, caprine and bovine wheys, of their hydrolyzed counterparts, of the fraction containing the unknown compound (before and after hydrolysis), and of standards of vitamins, dinucleotides, pepsin, trypsin, amino acids, uric acid and orotic acid were all analyzed by FPLC, according to the following protocol: the separation was performed as described by Pintado and Malcata [3]; the void volume of the column was determined using blue dextran (2 mg/ml); the exclusion volume of the column was deter-mined with acetone in water at 1:250 (v/v); the qualitative calibration in molecular weight (MW) was performed using an aqueous solution containing 5.5 mg/ml aldolase (MW 158,000 Da), 10 mg/ml bovine albumin (MW 67,000 Da), 3.5mg/ml ovalbumin (MW 43,000 Da), 3 mg/ml chymotr-ypsinogen A (MW 25,000 Da), 6.5 mg/ml ribonuclease (MW 13,700 Da), 2.5mg/ml of insulin chain B (MW 5750 Da), 2.5 mg/ml of insulin chain A (MW 2531 Da) and 2.0 mg/ml of NAD (MW 669 Da). The stock solutions of vitamin and amino acid standards were prepared as 1 mg/ ml thiamin, 0.4 mg/ml B12vitamin, 0.5mg/ml B6vitamin,
0.5mg/ml pantotenic acid, 0.5mg/ml folic acid, 0.5mg/ml biotin, 0.5mg/ml ribo¯avin, 0.5mg/ml nicotinic acid, 1 mg/ml of each dinucleotide and 0.25mg/ml tryptophan; and the stock solution of free amino acid standards was prepared as 0.12 mg/ml tryptophan, 0.08 mg/ml phenyl-alanine and 0.06 mg/ml tyrosine.
3
Results and discussion 3.1
Analysis of native whey proteins
Peak integration in gel permeation chromatograms was adequately performed; in order to simplify interpretation, the peaks detected in each chromatogram were lumped into arbitrary ranges of molecular weights fractions.
When caprine, ovine and bovine wheys were injected into the FPLC (see Fig. 1), four major peaks were obtained which account for the four main proteins present in whey (IgG, BSA, a-La and b-Lg). It is important to note the absence of orotic and uric acids, which usually show up after 50 min [3]; this means that dialysis was ef®cient in eliminating low molecular weight compounds, i.e. non protein nitrogenous compounds, salts and lactose, which are all small in size. However, an extra peak with a MW between 3000 and 4000 Da was clearly detected in ovine and caprine wheys, but not in bovine whey. A similar peak was reported by Hill and Kakuda [1] and by Law and Brown [2], who referred to it as fractions with molecular weight of ca. 3000 Da, mainly composed by non-protein
material that absorbs maximally at 260 nm and minimally at 230 nm. In order to investigate the non-protein com-position of said peak, standards for the major non-protein compounds present in native whey, e.g. water-soluble vi-tamins, major organic acids, dinucleotides and free amino acids, were injected as such; however, their retention times were in all cases far above that of the peak under scrutiny (results not shown). However, as they also absorbed strongly at 280 nm, and since hydrolysis revealed the presence of free amino acids, one has decided to pursue investigation on it via assessing its behavior when subject to enzyme-mediated hydrolysis.
3.2
Hydrolysis of a-La
When bovine a-La was incubated with trypsin for 2.5h (see Table 1), the peak corresponding to a-La disap-peared, while several new peaks appeared: the major peaks presented MWs of 3000±4000 and 2000±3000 Da. One of these peaks might be associated with the longer peptide produced by Brew et al. [12] via tryptic digestion of a-La, and which was tentatively called T6 peptide. Such peptide has ca. 29 amino acid residues, which
Fig. 1a±c. Typical size exclusion chromatograms of a ovine whey, b caprine whey and c bovine whey at 280 nm. 1: IgG, 2: BSA, 3: a-La and 4: b-Lg
should correspond roughly to a MW in the range 3000± 3500 Da. Smaller peptides were then eluted; they pre-sented MW of 1000±500, and especially <500 Da. After 24 h, the enzymatic digestion of whey could in principle be considered complete, and the pro®le of peptides was accordingly rather different from the pro®le of its native counterpart (see Fig. 2a). The peptide peak with MW 4000±6000 disappeared quantitatively, thus leading to the increase mainly of peptides with MW of 3000±4000 and 500±1000 Da. All remaining peaks, which were already present by 2.5h of hydrolysis, remained virtually un-changed. The chromatogram of a-La at pH 2.0 showed a (not well resolved) peak with a MW of 4000±6000 Da; this peak could be attributed to the likely unstabilization of the structure of a-La at such low pH, leading to a certain degree of unfolding, because a-La is said to un-dergo an acid denaturation-type at pH below 4.0 associ-ated with the removal of the (stabilizing) calcium cations from the molecular structure [13]. Degradation of a-La with pepsin for 2.5h (see Table 1) led to appearance of a major peak with MW of 2000±3000 Da, and a small peak with MW between 3000 and 4000 Da, hence denoting a stronger enzymatic activity of such enzyme compared with that of trypsin; however, this effect could also have lumped the effect of low pH because it may lead to un-stabilization of the substrate molecule and facilitation of attack by the enzyme. It is important to point out that the smallest peptides (<500 Da) are all released in the ®rst 2.5h of hydrolysis brought about by trypsin, while none was formed with pepsin in the same time frame of hydrolysis. In this respect, our results agree with those reported by Schmidt and Poll [5], viz. a-La is slowly and partially hydrolyzed by trypsin, but is rapidly and totally hydrolyzed by pepsin; Kinekawa and Kitabatake [14] noticed, well that a-La is eventually depleted by 1 h at that pH. Antila [15] also claimed that a-La is the milk protein most resistant to trypsin hydrolysis.
By 24 h, the peak with higher MW (4000±6000 Da) disappeared completely (see Fig. 2b) with concomitant increase of the fraction with MW of 3000±4000 Da;
dis-appearance of the fraction with MW of 2000±3000 Da originated an important amount of smaller peptides (withMW comprised between 500 and 2000 Da).
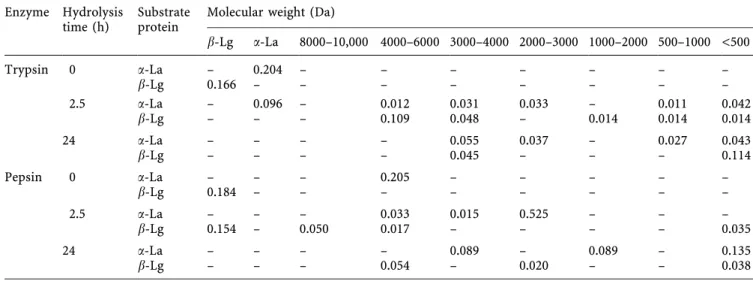
Table 1. Digestion of a-La and b-Lg by trypsin and pepsin. The data are expressed as peak area (absorbance ´ min) Enzyme Hydrolysis
time (h) Substrateprotein Molecular weight (Da)
b-Lg a-La 8000±10,000 4000±6000 3000±4000 2000±3000 1000±2000 500±1000 <500 Trypsin 0 a-La ± 0.204 ± ± ± ± ± ± ± b-Lg 0.166 ± ± ± ± ± ± ± ± 2.5 a-La ± 0.096 ± 0.012 0.031 0.033 ± 0.011 0.042 b-Lg ± ± ± 0.109 0.048 ± 0.014 0.014 0.014 24 a-La ± ± ± ± 0.055 0.037 ± 0.027 0.043 b-Lg ± ± ± ± 0.045± ± ± 0.114 Pepsin 0 a-La ± ± ± 0.205 ± ± ± ± ± b-Lg 0.184 ± ± ± ± ± ± ± ± 2.5 a-La ± ± ± 0.033 0.0150.525± ± ± b-Lg 0.154 ± 0.050 0.017 ± ± ± ± 0.035 24 a-La ± ± ± ± 0.089 ± 0.089 ± 0.135 b-Lg ± ± ± 0.054 ± 0.020 ± ± 0.038
Fig. 2a, b. Typical size exclusion chromatograms of bovine a-La hydrolyzed for 24 h with a trypsin and b pepsin
The ®nal hydrolyzates of a-La with pepsin and trypsin displayed important differences from each other: while the hydrolysis with trypsin produced a hydrolyzate richer in medium size peptides (2000±4000), pepsin originated mostly smaller peptides (mainly <500 Da) coupled with release of more free amino acids.
3.3
Hydrolysis of b-Lg
After having brought about trypsin-catalyzed hydrolysis for 2.5h, all b-Lg disappeared as such but several new peaks came into play (see Table 1), the most important of which has MW of 4000±6000 Da. All peaks generated were also observed in the chromatogram associated with hy-drolysis of a-La, except for the peak 1000±2000 Da that is only present for b-Lg, and the peak 2000±3000 Da that appears only for a-La. By 24 h of incubation (see Fig. 3a), only one peak with intermediate MW (i.e. 3000±4000 Da) still remains, whereas the smaller fractions (<500 Da) in-crease in quantity. Together with the slower rate of
hydrolysis observed for a-La, this fact con®rms the higher activity of trypsin upon b-Lg.
The good stability of b-Lg at pH 2.0 was made apparent by lack of change of retention time and resolution brought about by pepsin. This is consistent with the conforma-tional stability of b-Lg at low pH (say pH < 2) [16]; since b-Lg may function as a retinol-carrier to provide vitamin A via speci®c receptors in the small intestine of the neo-nate, it must remain stable at the low pH prevailing in the stomach. When this enzyme was allowed to act for 2.5h, only a small amount of b-Lg was converted into peptides, one with high MW (i.e. 8000±10,000 Da), one of medium size (i.e. 4000±6000 Da), and a few small peptides and free amino acids (with MW <500 Da). However, by 24 h of hydrolysis with pepsin, all b-Lg disappeared and several new peaks have meanwhile arisen (see Fig. 3b), which are analogous to their trypsin counterparts.
When the ®nal hydrolyzates of b-Lg brought about by both enzymes are compared with one another, it is noto-rious that the peptides with higher MW predominate in the peptic hydrolyzate, whereas very low MW peptides and free amino acids are the major components of the tryptic hydrolyzate. Inspection of Table 1 also indicates that b-Lg is more rapidly degraded by trypsin and less rapidly by pepsin than a-La. These results are in disagreement with Shmidt and Poll [5], who reported that b-Lg is not hy-drolyzed at all by either trypsin or pepsin, and with Reddy et al. [17], Asselin et al. [18], and Kinekawa and Kitaba-take [14], who observed that the native proteins are vir-tually resistant to peptic action; such differences could be probably attributed to use of different ratios of enzyme to substrate, to differences of pH and to distinct hydrolysis times, because van Willige and Fitzerald [19] and Briand et al. [20] conversely reported good hydrolysis of b-Lg with trypsin, and Kuehler and Stine [21] with pepsin. 3.4
Hydrolysis of whey
Comparing the FPLC pro®les of the three types of whey (at pH 7.0), one ®nds IgG, BSA, a-La and b-Lg in all of them, but only ovine and caprine wheys display the unknown peak at ca. 43 min (see Table 2). When caprine whey was dissolved at pH 2.0 (see Table 2), the pro®le of native whey was, however, quite different: IgG and BSA appeared as minor signals, and the typical peak for a-La degenerated into shorter peptide fractions, of MW in the ranges 8000± 10,000 and 3000±4000 Da. Native bovine whey underwent also modi®cations at this pH, with an initial decrease of the peak accounted for by a-La to originate a peak with MW of 1000±2000 Da. At pH 2, ovine whey was very stable with respect to hydrolysis (see Table 2), with no new peaks forming and with the major peaks remaining constant; however, the peaks associated with IgG and BSA could not be detected by 24 h at pH 2, as happened with the other two species. Incubation of ovine whey with trypsin origi-nated fractions that are similar to those obtained via in-cubation of a-La and b-Lg with trypsin (4000±6000, 3000± 4000 and <500±1000 Da). A new peak with high MW (i.e. 8000±10,000 Da) was formed only when whey was hydro-lyzed with trypsin. The peaks accounted for by IgG, a-La and b-Lg disappeared totally; however, the peak
corres-Fig. 3a, b. Typical size exclusion chromatograms of bovine b-Lg hydrolyzed for 24 h with a trypsin and b pepsin
ponding to BSA increased, probably owing to formation of aggregates of proteins/peptides. The results for caprine whey were similar to those for ovine whey, yet the peak associated with BSA vanished by 2.5h of tryptic digestion. Bovine whey showed peaks for BSA and a-La by 2.5h of incubation with trypsin, hence suggesting (as already ob-served with the a-La standard) a slower attack by trypsin than by pepsin. This means that a-La in bovine whey is the a-La of the three species least susceptible to tryptic action, although the concentration of enzyme toward bovine whey was twice as much that toward ovine and caprine wheys (so as to be able to follow hydrolysis of the unknown peak); a-La was totally hydrolyzed in ovine and caprine wheys, but only ca. 29% of a-La was degraded in bovine whey. The type of peaks formed in bovine whey are similar to those formed in whey from the other species, except for the fraction with MW of 8000±10,000, which is not actually formed in bovine whey.
By 24 h of incubation, the peaks for ovine (see Fig. 4a) and caprine wheys (see Fig. 5a) are still very similar to one another. In bovine whey the peak with MW of 4000±6000 does not disappear as happens in the wheys of the other species. It is important to point out that the peak with MW of 3000±4000 Da (similar to the unknown peak) did un-dergo important increases in caprine and ovine wheys, whereas for bovine it started to decrease after 2.5h of enzyme action.
The presence of pepsin gave rise to a slower activity upon bovine whey than ovine or caprine wheys by 2.5h of incubation; in fact, ca. 70% of b-Lg was hydrolyzed in
ovine and caprine wheys, whereas only ca. 27% was found intact in bovine whey. By 2.5h, ovine whey showed a notable increase of the peak with MW between 3000 and 4000 Da, whereas for caprine whey it remained virtually unchanged. Bovine whey displayed peaks that were not well resolved between 1000±4000 Da, but were signi®cant by 24 h of digestion.
By 24 h, the degradation of ovine whey (see Fig. 4b) and caprine whey (see Fig. 5b) yields speci®c fractions that coincide with that (500±1000 Da) which accounts for the peak observed upon digestion of either b-Lg or a-La, two similar to those (3000±4000 and 1000±2000 Da) observed upon digestion of a-La and another two similar to those (4000±6000 and 2000±3000 Da) arising from digestion of b-Lg.
Bovine whey led also to the peaks mentioned before, except for the one with MW between 3000 and 4000 Da, which disappeared after digestion took place. Incubation at pH 2 for 24 h probably altered the structure of a-La of this species, thus facilitating the catalytic action of the enzyme.
Comparing the ®nal hydrolyzates, one concludes that ovine and caprine whey proteins originate similar pep-tide pro®les when acted upon by either enzyme, except for the fact that caprine whey is poorer in fraction <500 Da under the action of pepsin (which is equivalent to a de®ciency in free amino acids). Bovine whey differs mainly with regard absence of peptides with MW of 3000±4000 Da when attacked by pepsin, and to peptides with MW of 4000 and 6000 when attacked by trypsin.
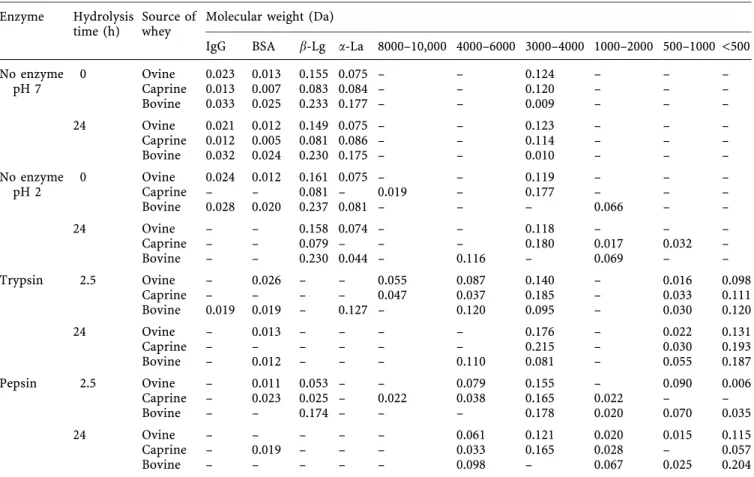
Table 2. Digestion of caprine, ovine and bovine wheys by trypsin and pepsin. The data are expressed as peak area (absorbance ´ min) Enzyme Hydrolysis
time (h) Source ofwhey Molecular weight (Da)
IgG BSA b-Lg a-La 8000±10,000 4000±6000 3000±4000 1000±2000 500±1000 <500
No enzyme 0 Ovine 0.023 0.013 0.1550.075± ± 0.124 ± ± ± pH 7 Caprine 0.013 0.007 0.083 0.084 ± ± 0.120 ± ± ± Bovine 0.033 0.0250.233 0.177 ± ± 0.009 ± ± ± 24 Ovine 0.021 0.012 0.149 0.075± ± 0.123 ± ± ± Caprine 0.012 0.0050.081 0.086 ± ± 0.114 ± ± ± Bovine 0.032 0.024 0.230 0.175± ± 0.010 ± ± ± No enzyme 0 Ovine 0.024 0.012 0.161 0.075± ± 0.119 ± ± ± pH 2 Caprine ± ± 0.081 ± 0.019 ± 0.177 ± ± ± Bovine 0.028 0.020 0.237 0.081 ± ± ± 0.066 ± ± 24 Ovine ± ± 0.158 0.074 ± ± 0.118 ± ± ± Caprine ± ± 0.079 ± ± ± 0.180 0.017 0.032 ± Bovine ± ± 0.230 0.044 ± 0.116 ± 0.069 ± ± Trypsin 2.5Ovine ± 0.026 ± ± 0.055 0.087 0.140 ± 0.016 0.098 Caprine ± ± ± ± 0.047 0.037 0.185± 0.033 0.111 Bovine 0.019 0.019 ± 0.127 ± 0.120 0.095± 0.030 0.120 24 Ovine ± 0.013 ± ± ± ± 0.176 ± 0.022 0.131 Caprine ± ± ± ± ± ± 0.215± 0.030 0.193 Bovine ± 0.012 ± ± ± 0.110 0.081 ± 0.055 0.187 Pepsin 2.5 Ovine ± 0.011 0.053 ± ± 0.079 0.155 ± 0.090 0.006 Caprine ± 0.023 0.025± 0.022 0.038 0.165 0.022 ± ± Bovine ± ± 0.174 ± ± ± 0.178 0.020 0.070 0.035 24 Ovine ± ± ± ± ± 0.061 0.121 0.020 0.0150.115 Caprine ± 0.019 ± ± ± 0.033 0.1650.028 ± 0.057 Bovine ± ± ± ± ± 0.098 ± 0.067 0.0250.204
Therefore, the three hydrolyzates possess peptides in both quality and quantity that will permit their incor-poration as additives in food formulae, or in culture media with improved nutritional properties.
3.5
Hydrolysis of unknown fraction
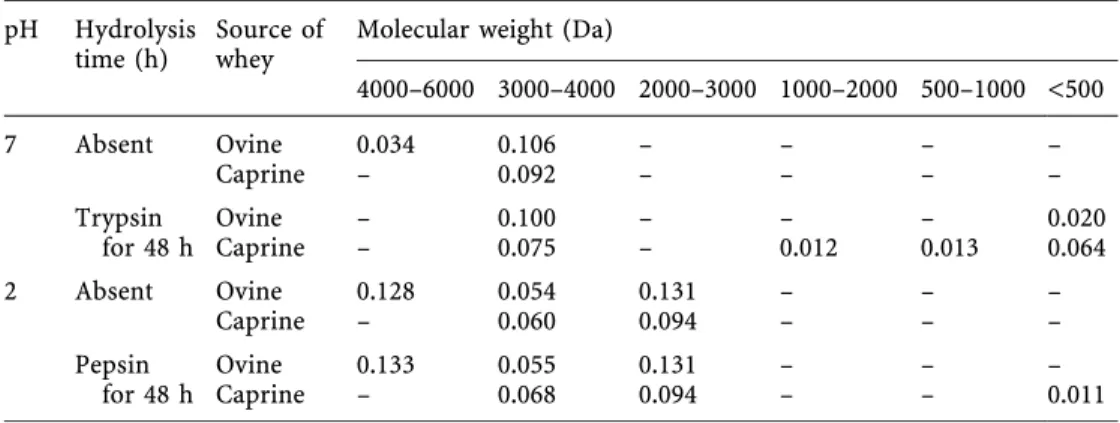
When the fraction corresponding to the unknown peak in caprine whey was incubated with trypsin for 48 h (see Table 3), one observed a small decrease of said peak area with concomitant formation of peaks with MW of 1000± 2000, 1000±5000 and <500 Da. When dissolved at pH 2.0, that peak degenerated into two unresolved peaks, with MW of 2000±4000 Da. After incubation with pepsin, no signi®cant change was detected. The fraction isolated from ovine whey showed two neighbor peaks at pH 7.0; after incubation with trypsin took place for 48 h, peaks with MW of <500 Da were formed, with concomitant disap-pearance of one of the peaks with MW of 4000±6000 Da. When the peak studied was dissolved at pH 2.0, degener-ation onto two unresolved peaks was again noticed, but
incubation with pepsin for 24 h did not produce any sig-ni®cant extra peaks. The results pertaining to degradation of the compound(s) responsible for the unknown peak under scrutiny (in ovine and caprine wheys when in the presence of proteases) suggest that such fraction is prob-ably a mixture of compounds: the major component does probably encompass nonprotein materials (as con®rmed by its UV spectrum), but it also contains small peptides with bonds susceptible to cleavage by trypsin but not by pepsin (which agrees with presence of free amino acids after acid hydrolysis of that fraction). However, the nature of the aforementioned non protein fraction still merits further investigation using more sophisticated analytical techniques.
4
Conclusions
Bovine a-La, pure or in whole whey, undergoes slow hydrolysis brought about by trypsin, but fast hydrolysis brought about by pepsin, unlike bovine b-Lg or whole caprine, bovine or ovine wheys for that matter: b-Lg is
Fig. 4a, b. Typical size exclusion chromatograms of ovine whey
hydrolyzed for 24 h with a trypsin and b pepsin Fig. 5a, b. Typical size exclusion chromatograms of caprine whey hydrolyzed for 24 h with a trypsin and b pepsin
more rapidly attacked by trypsin and less rapidly by pepsin, hence denoting different af®nity for these cata-lytic proteins. Similar results were observed for the three wheys by 24 h, but bovine whey underwent slower hy-drolysis than the wheys from the other two species, especially when effected by trypsin. The three types of whey led to hydrolyzates rich in peptides with MW of 500±4000 Da for tryptic hydrolysis of ovine and caprine wheys, and not above 6000 Da for the remaining ones. The great diversity of peptides exhibited by these hy-drolyzates and the presence of free amino acids make them a good choice for infant formulae or culture me-dium additives, in both cases to improve their nutri-tional characteristics, and in the former case to also improve their functional properties. Hydrolysis of the unknown peak (which is characterized by MW of 3000± 4000 Da) leads to only a slight disappearance of said peak (with formation of a few minor peaks in the case of trypsin), thus suggesting that this peak is probably accounted for by non-protein material.
References
1. Hill, A.R.; Kakuda, Y.: Size exclusion chromatography of caprine whey proteins. Milchwissenchaft 45(1990) 207±210
2. Law, A.J.R.; Brown, J.R.: Compositional changes in caprine whey proteins. Milchwissenchaft 49 (1994) 674±677 3. Pintado, M.E.; Malcata, F.X.: Effect of thermal treatment on
the protein pro®le of whey from ovine and caprine milk throughout lactation. Int. Dairy J. 6 (1996) 497±518
4. Asselin, J.; Amiot, J.; Gauthier, S.F.; Mourad, W.; Herbert, J.: Immunogenicity and allergenicity of whey protein hydroly-sates. J. Food Sci. 53 (1988) 1208±1210
5. Schmidt, D.G.; Poll, J.K.: Enzymatic hydrolysis of whey pro-teins. Hydrolysis of a-lactalbumin and b-lactoglobulin in buffer solutions by proteolytic enzymes. Neth. Milk Dairy J. 45(1991) 225±240
6. Boza, J.J.; Martinez-Augustin, O.; Gil, A.: Nutritional and antigenic characterization of an enzymatic protein hydrolyz-ate. J. Agric. Food Chem. 43 (1995) 872±875
7. Jasinski, E.; Kilara, A.: Flavour binding by whey proteins. Milchwissenchaft 40 (1985) 596±599
8. de Wit, J.N.: The use of whey protein products. A review. NIZO Res. Rep. V281 (1989)
9. Andrews, A.T.: The composition, structure and origin of proteose peptone component 5of bovine milk. Eur. J. Bio-chem. 90 (1978) 59±65
10. Georgi, G.; Sawatzki, G.: Molecular weight determination of protein hydrolysates (FPLC). In: Barth, C.A., Schlimme, E. (Eds.) Milk Proteins: Nutritional, Clinical, Functional and Technological Aspects, Steinkopff, Darmstadt, Germany (1989)
11. Visser, S.; Slangen, C.J.; Robben, A.J.P.M.: Determination of molecular mass distribution of whey protein hydrolysates by high-performance size exclusion chromatography. J. Chro-mat. 599 (1992) 205±209
12. Brew, K.; Castellino, F.J.; Vanaman, T.C.; Hill, R.L.: The complete amino acid composition of bovine a-lactalbumin. J. Biol. Chem. 245 (1970) 4570±4582
13. Kronman, M.J.; Singh, S.K.; Brew, K.: Binding of calcium and other metal ions to a-lactalbumin. J. Biol. Chem. 256 (1981) 8582
14. Kinekawa, Y.; Kitabatake, N.: Puri®cation of b-lactoglobulin from whey protein concentrate by pepsin treatment. J. Dairy Sci. 79 (1996) 350±356
15. Antila, P.: In vitro digestion of bovine milk proteins by trypsin hydrolysis and pH-stat analysis. In: Barth, C.A., Schlimme, E. (Eds.) Milk Proteins: Nutritional, Clinical, Functional and Technological Aspects pp. 223±224. Stein-kopff, Darmstadt, Germany (1989)
16. Kinsella, J.E.: Protein modi®cations: effects on functional properties and digestibility. In: Barth, C.A.; Schlimme, E. (Eds.) Milk Proteins: Nutritional, Clinical, Functional and Technological Aspects, pp. 179±191. Steinkopff, Darmstadt, Germany (1989)
17. Reddy, I.M.; Kella, K.D.; Kinsella, J.E.: Structural and con-formational basis of the resistance of b-Lg to peptic and chymotryptic digestion. J. Agric. Food Chem. 36 (1988) 737±741
18. Asselin, J.; Herbert, J.; Amiot, J.: Effect of in vitro proteolysis on the allergenicity of major whey proteins. J. Food Sci. 54 (1989) 1037±1039
19. van Willige, R.W.G.; Fitzerald, R.J.: Tryptic and chymotryptic hydrolysis of b-lactoglobulin A, B and AB at ambient and high pressure. Milchwissenschaft 50 (1995) 183±185
20. Briand, L.; Chobert, J.M.; Haertle, T.: Tryptic hydrolysis of esteri®ed b-casein and b-lactoglobulin. Milchwissenchaft 49 (1994) 367±371
21. Kuehler, C.A.; Stine, C.M.: Effect of enzymatic hydrolysis on some functional properties of whey protein. J. Food Sci. 39 (1974) 379±382
Table 3. Digestion of un-known peak from caprine and ovine whey by trypsin and pepsin, for 48 h. The data are expressed as peak area (absorbance ´ min)
pH Hydrolysis
time (h) Source ofwhey Molecular weight (Da)
4000±6000 3000±4000 2000±3000 1000±2000 500±1000 <500 7 Absent Ovine 0.034 0.106 ± ± ± ± Caprine ± 0.092 ± ± ± ± Trypsin Ovine ± 0.100 ± ± ± 0.020 for 48 h Caprine ± 0.075± 0.012 0.013 0.064 2 Absent Ovine 0.128 0.054 0.131 ± ± ± Caprine ± 0.060 0.094 ± ± ± Pepsin Ovine 0.133 0.055 0.131 ± ± ± for 48 h Caprine ± 0.068 0.094 ± ± 0.011