Engineering ISSN: 1809-4430 (on-line)
_________________________
2 São Paulo State University (Unesp), School of Agricultural and Veterinarian Sciences/ Jaboticabal - SP, Brazil. 3 Federal University of São Carlos /Lagoa do Sino, Brazil.
MONITORING OF SOYBEAN MECHANICAL HARVESTING AS A FUNCTION OF PLOT SHAPES
Doi:http://dx.doi.org/10.1590/1809-4430-Eng.Agric.v37n4p689-698/2017
CARLA S. S. PAIXÃO1*, ALINE S. ALCÂNTARA2, MURILO A. VOLTARELLI 3,
ROUVERSON P. DA SILVA2, TIAGO DE O. TAVARES2
1* Corresponding author. São Paulo State University (Unesp), School of Agricultural and Veterinarian Sciences/
Jaboticabal - SP, Brazil. E-mail: [email protected]
ABSTRACT: Information on harvester performance is important in the management and
optimization of mechanized agricultural systems. In this sense, the aim of this study was to monitor the operation quality of soybean mechanical harvesting in different plot shapes by means of statistical process control. The harvest was carried out in an agricultural area of a farm located in Uberaba, MG, Brazil, with an experimental design based on the assumptions of statistical quality control and 18, 28, and 24 replications for irregular, rectangular, and trapezoidal plots, respectively. The variables and/or quality indicators of harvester performance were forward speed, engine speed, cylinder speed, and concave opening. The lowest variation occurred in the irregular plot for the quality indicators forward speed and engine speed of harvester. Engine speed and the concave opening of harvester were unstable for all plot shapes. Only the cylinder speed of the soybean harvester presented process stability during operation for the three plot shapes.
KEYWORDS: grain harvester, harvester machine performance, statistical quality control, Glycine
max (L.) Merrill.
INTRODUCTION
Mechanical harvesting is considered the most complex stage of a crop production cycle and the synchrony of internal mechanisms, adjustments, and working speed are factors that directly influence the quantity and quality of the harvested product (Bottega et al., 2014).
The correct planning by means of an adequate dimensioning of area and harvester could avoid their underutilization. However, in order to carry out this dimensioning adequately, information on harvester performance and size and shape of plots are necessary, leading to a minimum possible maneuvering time and maximizing the efficiency level of operation. In this case, the machines would remain most of the time harvesting the area.
In this context, soybean mechanical harvesting becomes important since the lower the losses resulting from this operation are, possibly the higher the productivity per area (Compagnon et al., 2012). However, studies on the monitoring of soybean harvesters regarding their performance demonstrate the need in improving this operation quality, especially the regulation variability over harvesting time.
However, such variability can occur at high levels depending on crop (maturity and variety), harvester (machine working speed, concave opening, and cylinder speed), and workforce conditions (operator experience in driving the machine), among other factors related to the environment such as soil water content, weeds, and plot shape (Arazuri et al., 2007).
These variation factors are related to the 6 M’s (machine, material, Mother Nature, method, measurement, and man) advocated by quality programs and must be investigated and eliminated from the production process (Tavares et al., 2015).
of how the process is occurring through monitoring over time, indicating eventual failure for possible process improvements in order to increase the operation quality.
Some authors have used statistical process control by means of the assessed variables as quality indicators to identify non-random causes or special causes due to process instability or variability (Naves et al., 2015; Zerbato et al., 2014; Compagnon et al., 2013; Toledo et al., 2013; Cassia et al., 2013; Chioderoli et al., 2012).
Considering these facts and assuming that the operation performance of soybean mechanical harvesting can be influenced by plot shape in which the crop was cultivated, this study aimed to assess the operation quality of soybean mechanical harvesting in different plot shapes using as quality indicators the operational performance parameters of harvester by means of statistical process control tools.
MATERIAL AND METHODS
The experiment was carried out in March 2014 in the region of Uberaba, MG, Brazil, in an
area of the São Sebastião farm, located near the geodesic coordinates 19°44′54″ S and 47°55′55″ W,
with an average altitude of 801 m. The regional climate is classified as tropical with summer rains (Aw) according to Köeppen-Geiger classification. The soil of the experimental area is classified as a medium-textured Ultisol.
The experimental area had been cultivated with sugarcane for 10 years under a conventional soil tillage system. After this period, sugarcane ratoon was eliminated, with subsequent use of the conventional tillage system (medium and light harrowing).
After this stage, soybean sowing was carried out in November 2013, with a spacing of 0.50 m between rows and 21 to 22 seeds per linear meter, with a density of approximately 420,000 seeds
ha−1. A nine-row Tatu Marchesan seed drill with a working width of 4500 mm and regulated to
deposit seeds at a depth of 60 mm in the soil was used. The cultivar sown was BMX Turbo RR (BRASMAX).
For soybean mechanical harvesting, a Massey Ferguson MF 5650 Advanced harvester (model year 2010) with approximately 700 h of work was used. The harvester has an AGCO Sisu Power six-cylinder engine with a nominal power of 130 kW (175 hp), cutting table width of 5.00 m, tangential threshing system, separation by straw walkers, and grain tank with a capacity of 5500 L.
In the same area, three plots with different shapes were assessed: plot 1 with an irregular shape, plot 2 with a rectangular shape, and plot 3 resembling a trapezoid (Table 1).
TABLE 1. Average dimensional characteristics of plots assessed during soybean mechanical harvesting.
Characteristic Irregular Rectangular Trapezoidal
Area (ha) 4.41 8.36 7.19
Length (m)* 448 1,159 1,136
Width (m)* 85 84 90
*The average values of length and width (m) were determined by means of four random measurements on the sample area map using the software Computer-Aided Design (CAD).
Samples were collected according to the statistical quality control method, being determined in a fixed time interval (15 minutes) for the assessments with 18, 28, and 24 replications for the irregular, rectangular, and trapezoidal plots, respectively. Treatments were established from the plot shapes, without the need to change the harvester operator during harvesting, thus providing better control conditions of the experiment.
The assessments of soybean harvester performance were carried out considering the following parameters: forward speed, engine speed, cylinder speed, and concave opening. All quality
Theses sensors sent electromagnetic pulses to the onboard computer in real time. Data acquisition was only performed by an evaluator aiming at a greater control of the experimental conditions.
The analyses used to assess the operational performance parameters of harvester were the randomness patterns and control charts of individual values. To verify the randomness or non-randomness of the process, we used the run chart, which allows us objectively to understand whether the changes made to a process or system over time brings improvements with a minimal mathematical complexity. This method of analysis and communication of data is better for agricultural processes due to their high variability when compared to the traditional statistics, which ignores the order of time (Voltarelli et al., 2015a).
The verification of possible data randomness was performed using the 5% probability test and, since the p-value for the patterns was less than 0.05, the null hypothesis of non-randomness was rejected in favor of the alternative to the tested pattern. The occurrence of these patterns may indicate that the process is close to extrapolating the control limits, i.e. it becomes unstable, or even that the process is already “unstable”, not meeting the quality patterns when the control charts are stable. However, this type of analysis must be complemented by checking the control charts, thus obtaining a better behavior precision of quality indicators (Voltarelli et al., 2015a).
On the other hand, the control charts of individual values are basically constituted by the central line, which characterizes the general mean and the mean moving range, as well as the upper and lower control limits, defined as UCL and LCL, respectively. The calculations used for establishing the control limits for charts of individual values were based on the general mean and standard deviation of crop losses or quality indicators (for UCL, mean plus three times the standard deviation, and for LCL, mean minus three times the standard deviation), as described by Montgomery (2009). When the sample values exceed the limits of control, the process is considered unstable.
Regardless of the assumption of normality, these control chart models can be used to analyze and detect the intrinsic and extrinsic variability to the mechanized agricultural processes since the full knowledge of the process is essential for managing the operation (Voltarelli et al., 2015b).
RESULTS AND DISCUSSION
Pattern detection analysis (clustering, mixture, trend, and oscillation) of non-random order or that still occur in a systematic way during the process has some difficulty of being recognized and interpreted by evaluators when control charts of individual values are analyzed alone. This verification requires the evaluator’s experience, full knowledge of the process as a whole, and knowledge on statistical parameters that govern these patterns (Voltarelli et al., 2015a).
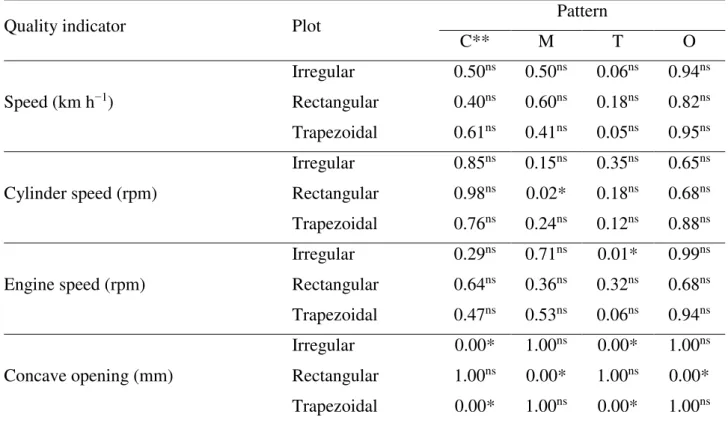
TABLE 2. Probability pattern values of sequential charts for quality indicators of soybean harvester performance.
Quality indicator Plot Pattern
C** M T O
Speed (km h−1)
Irregular 0.50ns 0.50ns 0.06ns 0.94ns
Rectangular 0.40ns 0.60ns 0.18ns 0.82ns
Trapezoidal 0.61ns 0.41ns 0.05ns 0.95ns
Cylinder speed (rpm)
Irregular 0.85ns 0.15ns 0.35ns 0.65ns
Rectangular 0.98ns 0.02* 0.18ns 0.68ns
Trapezoidal 0.76ns 0.24ns 0.12ns 0.88ns
Engine speed (rpm)
Irregular 0.29ns 0.71ns 0.01* 0.99ns
Rectangular 0.64ns 0.36ns 0.32ns 0.68ns
Trapezoidal 0.47ns 0.53ns 0.06ns 0.94ns
Concave opening (mm)
Irregular 0.00* 1.00ns 0.00* 1.00ns
Rectangular 1.00ns 0.00* 1.00ns 0.00*
Trapezoidal 0.00* 1.00ns 0.00* 1.00ns
** C – Clustering; M – Mixture; T – Trend; O – Oscillation; * Pattern values of non-randomness detected by the probability test at p<0.05; ns pattern values of randomness detected by the probability test at p>0.05
The non-random trend pattern for engine speed of quality indicator can be explained by the increase or decrease of its angular velocities, resulting in a sequence of points that determine this behavior. However, the mixture pattern for cylinder speed shows an extreme variation in its angular velocity, which can be explained by the need of threshing the grains, being associated with their water content, opening and closing the concave in relation to the threshing cylinder.
On the other hand, the quality indicator concave opening presented clustering and trend patterns for irregular and trapezoidal plots, respectively, and mixture and oscillation for the rectangular plot. This result may be acceptable for this parameter since for a certain time the machine worked in the same opening, which characterized this clustering of points. In addition, at certain moments, low variations and/or increases or decreases in its opening due to the dynamics regulation during harvest led to non-random patterns of oscillation and trend, respectively.
The randomness or natural causes of pattern values show that these quality indicators do not cause or generate process instability, which results in a greater security in interpreting the results and, subsequently, in the quality performance of the operation (Voltarelli et al., 2013). Furthermore, no diagnosis of non-randomness patterns was observed for harvester working speed for all assessed plots, possibly indicating that this quality indicator is not influenced by potential special causes external to the harvesting process.
analysis of control charts. Finally, in order to complement this analysis, control charts of individual values need to be used to verify whether extrinsic factors to the process are affecting it, mostly
related to the 6 M’s (machine, man, material, method, measurement, and Mother Nature). This tool
can inform us if a given process is predictable or not predictable.
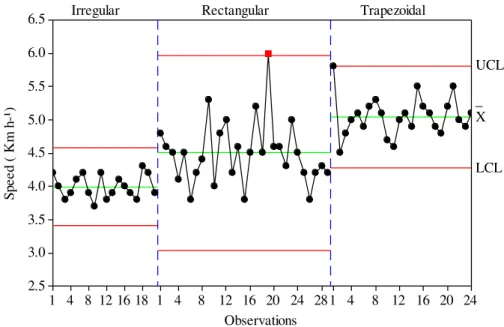
The forward speed of soybean harvester showed a stable behavior during the operation for the three assessed plot shapes, with all points within the lower and upper control limits (Figure 1). The trapezoidal plot provided a higher average speed since its harvesting was performed after the maintenance/adjustment of harvester table due to the cutting height oscillation.
24 20 16 12 8 4 1 28 24 20 16 12 8 4 1 18 16 12 8 4 1 6.5
6.0
5.5
5.0
4.5
4.0
3.5
3.0
2.5
Observations
S
p
e
e
d
(
K
m
h
-¹
) _
X
LCL Irregular Rectangular Trapezoidal
UCL
FIGURE 1. Control charts for the forward speed of harvester during soybean mechanical harvesting
in different plot shapes. UCL: Upper control limit; LCL: Lower control limit; :
Average of sample values.
In addition, when associating the pattern values of non-randomness (Table 2) together with this type of control chart, the only occurrence of natural causes could be observed in both analyses, which can contribute to a better analysis of the process, as well as assist in a better decision-making in the course of the process.
When comparing harvesters in several Brazilian states, Mesquita et al. (2002) found differences for grain losses as a function of the forward speed, which indicates that quantitative losses have a behavior directly proportional to the increase of the forward speed of harvesters, being these results similar to those presented in our study.
On the other hand, the lowest variation of this quality indicator occurred in the irregular plot, with most of the sampling points concentrating around a single value, which reflected in control limits close to the average, contrary situation to that observed in the rectangular plot.
Santana et al. (2015) described that the high variability of mechanized agricultural operations are common throughout these processes, which indicates that the continuous operation monitoring is carried out assiduously over time. This corroborates the behavior observed in the rectangular plot in our study, leading to a decrease in the quality level of soybean harvest.
24 20 16 12 8 4 1 28 24 20 16 12 8 4 1 18 16 12 8 4 1 1200
1150
1100
1050
1000
950
900
Observations
R
o
ta
ti
o
n
o
f
th
e
c
ili
n
d
e
r
(r
p
m
)
_ X UCL
LCL Irregular Rectangular Trapezoidal
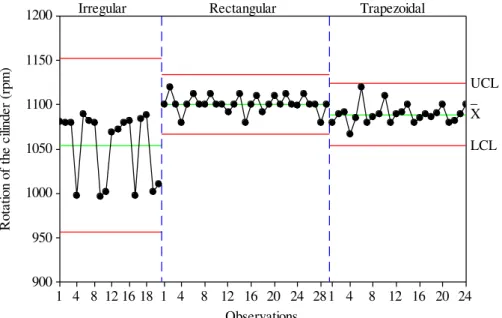
FIGURE 2. Control charts for the cylinder speed of harvester during soybean mechanical harvesting
in different plot shapes. UCL: Upper control limit; LCL: Lower control limit; :
Average of sample values.
According to these authors, both immediate and latent mechanical damage are originated at the time of threshing, i.e. at the moment when considerable forces are applied to the seeds in order to separate them from the pods. This occurs mainly because of the impacts from the threshing cylinder at the moment the harvested mass passes through the concave.
The quality indicator cylinder speed of soybean harvester presented a behavior similar to that observed for forwarding speed, being verified the process stability during the operation for the three plot shapes, with all points within the lower and upper control limits.
In addition, the highest variation occurred in the plot with irregular shape whereas, for the rectangular and trapezoidal plots, most of the sampling points were concentrated around a single value, which reflected in control limits close to the average. This is mainly due to grain water content since during the harvesting of the irregular plot, grains were drier and hence cylinder speed was lower whereas, in the other plots, grains were more humid due to the rains that occurred in the period prior to harvest.
However, although the patterns of randomness of mixture and trend for the rectangular and irregular plots (Table 2), respectively, during the process, it was considered stable when analyzing the control charts. This situation indicates that the use of these two quality tools is complementary for the correct analysis and interpretation of the process for a subsequent decision-making in order to result in an increase of quality through an improvement plan.
24 20 16 12 8 4 1 28 24 20 16 12 8 4 1 18 16 12 8 4 1 2600
2580
2560
2540
2520
Observations
R
o
ta
ti
o
n
o
f
th
e
m
o
to
r
(r
p
m
)
_ X UCL
LCL Irregular Rectangular Trapezoidal
FIGURE 3. Control charts for the engine speed of harvester during soybean mechanical harvesting
in different plot shapes. UCL: Upper control limit; LCL: Lower control limit; :
Average of sample values.
Harvester engine speed worked in very close ranges although operating in a speed range around 100 rpm of difference, reflecting the greater demand for speed in the threshing cylinder, occurring around the nominal engine speeds (Chioderoli et al., 2012).
On the other hand, the rectangular plot showed a higher variation of engine speed values when compared to the irregular plot. Although non-randomness patterns intrinsic to the process was not observed, this was unstable for all plot shapes. When assessing a mechanized agricultural operation, Ferezin et al. (2015) reported that the instability of quality indicators most often occurs due to variations in plant material flow inside the machine, causing an alternation in engine speed as a function of the power demand required at this time.
This situation is similar to that found in our study since a potential decrease in plant material flow was observed inside the machine, resulting in a lower harvester power demand and hence a lower value of engine speed.
As reported by Chioderoli et al. (2012), grain losses in soybean mechanical harvesting presented process instability for the quality indicator engine speed, a situation similar to that evidenced in the three plot shapes of our study. In addition, despite the processes being out of control, this did not hinder the harvester performance during the operation.
According to Compagnon et al. (2012), among the factors that may influence losses in soybean mechanical harvesting are the cutting height of harvester table, reel speed, threshing cylinder speed, opening between the cylinder and concave, and forward speed. These factors may be the reason for the process instability presented by the control charts in our study. This instability should be monitored, detected, and eliminated from the process.
24 20 16 12 8 4 1 28 24 20 16 12 8 4 1 18 16 12 8 4 1 40 38 36 34 32 30 28 Observations O p e n n in g o f th e c o n c a v e ( m m ) _ X UCL LCL Irregular Rectangular Trapezoidal
FIGURE 4. Control charts for the concave opening of harvester during soybean mechanical harvesting in different plot shapes. UCL: Upper control limit; LCL: Lower control limit; : Average of sample values.
Concave opening regulation is directly related to grain water content, being established a range between 29 to 39 mm so that the lower the grain water content is, the greater the concave opening and vice versa. Thus, although the variable is out of control, potentially the process cannot be considered as inefficient or detrimental to harvest quality since the variation was not expressive.
In addition, the grains were drier at the beginning of harvest in the irregular and trapezoidal plots. Because of this, the highest values for the concave opening were found in these plots; as the water content increased, this opening decreased in order to better thresh the grains.
When studying the soybean mechanical harvesting with two concave openings (29 and 30
mm) and three forward speeds (3.0, 3.7, and 6.0 km h−1), Ferreira et al. (2007) observed that the
smaller opening between the cylinder and concave associated with a slower speed provided higher total losses. On the contrary, the results found in our study showed that the concave opening did not directly influence the total losses considering the same working speeds.
Chioderoli et al. (2012) reported that the cylinder opening is maintained within the same value for a longer time, leading to the need to look for the best adjustment for harvest conditions. This situation may be similar to that observed in our study since the concave opening variation was close to 10 mm.
CONCLUSIONS
The forward speed of soybean harvester presented a stable behavior during the operation for the three assessed plot shapes; the lowest variation of this quality indicator occurred in the plot with the irregular shape.
The quality indicator cylinder speed of soybean harvester presented process stability during the operation for the three plot shapes. However, the highest variation occurred in the plot with the irregular shape whereas the lowest variation was observed in the rectangular.
REFERENCES
Arazuri S, Jarém C, Arana JI, Pérez de Ciriza JJ (2007) Influence of mechanical harvest on the
physical properties of processing tomato (Lycopersicon esculentum Mill.). Journal Food
Engineering 80(1):190-198.
Bottega EL, Souza CMA, Rafull LZL, Queiroz DM (2014) Avaliação de uma colhedora e da qualidade de sementes de forragem colhidas por varredura. Revista Ciências Exatas e da Terra e Ciências Agrárias 9(1):10-20.
Cassia MT, Silva RP, Chioderoli CA, Noronha RRF, Santos ED (2013) Quality of mechanized coffee harvesting in circular planting system. Ciência Rural 43(1):28-34.
Chioderoli CA, Silva RP, Noronha RHF, Cassia MT, Santos EP (2012) Perdas de grãos e distribuição de palha na colheita mecanizada de soja. Revista Bragantia 71(1):112-121.
Compagnon AM, Cassia MT, Ferreira MC, Noronha RHF, Guimarães JER (2013) Quality of pre-emergence herbicide applicaticoston with adjuvant in sugarcane crop. Pesquisa Aplicada & Agrotecnologia 6(1):77-84.
Compagnon AM, Silva RP, Cassia MT, Graat D, Voltarelli MA (2012) Comparação entre métodos de perdas na colheita mecanizada de soja. Revista Scientia Agropecuaria 3(3):215-223.
Costa NP, Mesquita CM, Henning AA (1979) Avaliação das perdas e qualidade de sementes na colheita de soja. Revista Brasileira de Sementes 1(3):59-70.
Ferezin E, Voltarelli MA, Silva RP, Zerbato C, Cassia MT (2015) Power take-off rotation and operation quality of peanut mechanized digging. African Journal of Agricultural 10(25):2486-2493.
Ferreira IC, Silva RP, Lopes A, Furlani CEA (2007) Perdas quantitativas na colheita de soja em função da velocidade de deslocamento e regulagens no sistema de trilha. Revista Engenharia na Agricultura 15:141-150.
Holtz V, Reis EF (2013) Perdas na colheita mecanizada de soja: uma análise quantitativa e qualitativa. Revista Ceres 60(3):347-353.
Mesquita CM, Costa NP, Pereira JE, Maurina AC, Andrade JGM (2002) Perfil da colheita mecânica da soja no Brasil: safra 1998/1999. Engenharia Agrícola 22(3):398- 406.
Montgomery DC (2009) Control charts for variables. In: Montgomery DC. Introduction to statistical quality control. Arizona, Wiley, 6:226-268.
Naves GR, Voltarelli MA, Silva RP, Toledo A, Lopes A (2015) Qualidade do corte basal na colheita mecanizada de cana-de-açúcar em dois tipos de manejo do solo. Comunicata Scientiae, Imperatriz 6(2):143-153.
Santana ATO, Voltarelli MA, Paixao CSS, Gírio LAS, Zerbato C, Silva RP (2015) Características agronômicas da soja em semeadura convencional e cruzada. Revista Agroambiente 9(4):414-422.
Tavares TO, Santinato F, Silva RP, Voltarelli MA, Paixão CSS, Santinato R (2015) Qualidade do recolhimento mecanizado de café. Coffe Science 10(4):455-463.
Toledo A, Silva RP, Furlani CEA (2013) Quality of cut and basecutter blade configuration for the mechanized harvest of green sugarcane. Scientia Agricola 70(6):384-389.
Voltarelli MA, Silva RP, Rosalen DL, Zerbato C, Cassia MT (2013) Quality of performance of the operation of sugarcane mechanized planting in day and night shifts. American Journal Crop Science 7(9):1396-1406.
Voltarelli MA, Silva RP, Zerbato C, Paixão CSS, Tavares TO (2015b) Monitoring of mechanical sugarcane harvesting through control charts. Engenharia Agrícola 35(6):1079-1092.