VILAS-BOAS JP, FERNANDES R, BARBOSA TM, KESKINEN KL (2007). Swimming bioenergetics: integrating biomechanical and physiological data into a coherent biophysical model for performance and training. In: R. Arellano Colomina, J. Andrés Sanchez, F. Navarro Valdivielso, Esther Morales Ortiz, and Gracia Lopez Contreras (eds.), Swimming Science I, pp. 7-18. University of Granada, Granada.
SWIMMING BIOENERGETICS: INTEGRATING BIOMECHANICAL AND PHYSIOLOGICAL DATA INTO A COHERENT BIOPHYSICAL MODEL FOR PERFORMANCE AND TRAINING
J. Paulo Vilas-Boas(1), Ricardo Fernandes(1), Tiago Barbosa(2), Kari L. Keskinen(3)
(1)
Faculty of Sport, Porto University, Porto, Portugal
(2)
Polytechnic Institute of Bragança, Dep. of Sport Sciences, Bragança, Portugal
(3)
Finish Society of Sport Sciences, Helsinki, Finland
ABSTRACT
The purpose of the present paper is to synthesise a number of scientific contributions of our research group, into a coherent corpus of knowledge related to swimming biophysics, specially centred on the availability and use of energy in swimming. After an introductory part that intends to underline the relevance of this approach base on the conceptualization of the swimmer, and swimming action itself, as a thermodynamic system and its mechanical output, we will survey a number of studies and respective contributions for a more advanced understanding of swimming performance, that can be transferred into training and enhancement of swimmers’ working capacity.
Most of the studies referred were conducted over samples of swimmers of both genders and of different types, from university/participative swimmers to Portuguese elite swimmers, crossing the large population of trained national level swimmers. Those swimmers were studied in the four different competitive swimming strokes, accomplishing progressive protocols based over distances of 200 m. Physiologic parameters like VO2 (and associated
ventilatory and respiratory parameters), post exercise capillary blood [La-] peaks, and heart
rate, were directly measured. Kinematical parameters were also measured in the different studies, ranging from simple semi-quantitative parameters, like stroke length (SL), and stroke
frequency (SF), to more elaborated biomechanical data, like intracyclic speed fluctuations
and propulsive segments kinematics.
The focus of interest ranged from swimming economy of different strokes and genders (and of different technical alternatives of the same stroke), to the effects over energy cost of intracyclic speed fluctuations. Energetic input determinant factors, like swimming VO2
kinetics, including VO2 slow component, and VO2 time limit, and its determinants, will also be
analysed.
Key words: Swimming bioenergetics, energy cost, VO2 time limit, VO2 slow component.
1. INTRODUCTION
Swimming, as most of the cyclic modes of human motion, can be interpreted as a simple thermodynamical process, where an energy input (E) is processed in each instant of time (t)
until a mechanical work (W) is performed with of a given energetic efficiency (e):
E→W; e = W * E
-1
* 100 (1)
Swimming performance capacity is measurable by the maximum velocity (v) that a swimmer
a determinant for the understanding of the difference between efficiency (e), and energy cost
(EC). In fact a swimmer can perform two tasks with a same e value, and the same energy
input (E), but ending up to rather different mean maximum velocity for a given competitive
distance. In this case the swimmer will produce the same mechanical power output (P) but,
for instance, in one case, if submitted to larger drag forces (D) – due to poor technique,
morphology, or fatigue -, he will swim slowly, once P can be described as:
P = D * v (2)
Equation (2) do not describe the total mechanical work performed per unit of time (power) by a swimmer. We take it as a simple example, considering only the work done to overcome D,
and excluding the work performed to accelerate water mass (WH2O), the work done to
accelerate the swimmers mass plus the added mass of water (Wma), and the internal work
(Wi).
From equations (1) and (2) it is now possible to extract a very old biophysical expression that models the factors determining swimming performance (di Prampero et al., 1974):
V = E * e * D
-1 (3)
where e is the efficiency of the biomechanical system (the swimmer) that produce propulsive
force (p) to overcome D.
Rearranging equation (3) offers some insight over the concept of “energy cost” (Schmidt-Nielsen, 1972) - EC -, also an old concept, but still determinant for the understanding of the
relevance of the particular biomechanical structure of locomotion movements:
EC = E * V -1
= D * e
-1 (4)
Vilas-Boas & Santos (1994) and Vilas-Boas (1996) showed empirically for the first time that energy cost of swimming grows with intracyclic speed fluctuations in breaststroke. As a consequence, this paper also reports about the recent attempts of our group to address this issue, but taking the other swimming competitive strokes as object of study.
Once obtained r values were not as high as possibly expected, suggesting a relevant
influence of other factors in EC, the analysis of more and increasingly detailed biomechanical
influencing factors was also conducted and reported here.
Finally, once it is obviously critical to swimming performance to understand the energy input to the system, this paper will address also to the recent contributions of our group in what
VO2 kinetics is concerned, specially trying to figure out the influencing factors and their
relevant characteristics for training (VO2 time limit, and VO2 slow component).
2. METHODS
visual feedback system (GBK-Pacer from GBK Electronics, Portugal). Prior to exercise, resting values for the physiologic variables were obtained.
A second test session occurred 48 hours after the first one. All subjects swam at their previously determined vVO2max to assess the time limit at vVO2max (TLim-vVO2max). This
protocol consisted of two different phases, all paced: (i) a 10 min warm-up at an intensity correspondent to 60% vVO2max, followed by a short rest (20 s) for ear-lobe blood collection,
and (ii) the maintenance of that swimming vVO2max until volitional exhaustion, or until the
moment that the swimmers were unable to swim at the selected pace. TLim-vVO2max was
considered to be the total swimming duration at the pre-determined velocity.
In some particular situations, swimmers were asked to perform sets of 3x25 m repetitions, at specified velocities, particularly in Butterfly stroke, for biomechanical analysis. Those sets included complete resting periods between repetitions.
Physiologic measurements: Heart rate was continuously monitored using Polar Vantage
monitors, recording at 5 s intervals. Oxygen consumption (VO2) was directly measured
through a K4b2 (Breath by Breath) Pulmonary Gas Exchange System, from
Cosmed (Italy). A
low hydrodynamic resistance respiratory valve was used to collect expired air samples (Toussaint et al., 1987) and connected to a breath-by-breath gas analyser (Keskinen et al., 2003; Rodriguez et al., 2003). VO2max was considered to be reached according to primary
and secondary traditional physiological criteria (Howley et al., 1995). The swimming velocity corresponding to VO2max (vVO2max) was considered to be the swimming velocity that elicits VO2max. If a plateau, less than 2.1 mlO2.min-1.kg-1 could not be observed, the vVO2max was
calculated as proposed by Kuipers et al. (1985):
vVO2max = v +
∆
v . (n.N-1), (5)where v is the velocity corresponding to the last stage accomplished,
∆
v is the velocityincrement, n indicates the number of seconds that the subjects were able to swim during the
last stage and N the pre-set protocol time (in seconds) for this step.
Blood samples (25 µl) were collected from the ear-lob before the evaluation, in each rest period and at the end of the protocol, immediately after, and at 1, 3, 5 and 7 minutes of recovery, if the lactate concentrations didn’t decrease between collections. For the analysis of the blood lactate concentrations an automatic analyser YSI 1500L
(
Yellow Springs, Ohio, USA), was used.The energetic input (E) was calculated using the VO2net (VO2net = VO2exercise – VO2rest) and
the net blood lactate ([La-]net = [La-]exercise – [La-]rest), transformed into VO2 equivalents
using a 2.7 mlO2.Kg-1.mmol-1 constant (di Prampero et al., 1978). The energy cost (EC) was computed dividing E by v.
Biomechanical measurements: Stroke parameters (SL, SF, stroke index - SI -, and v) were
measured in each of the 25 m laps swam during the progressive protocol. Mean value was calculated for each 200 m swim. The v value was obtained from the distance covered and
the split time - t. SF was measured through a base-3 chronofrequencymeter. SL was
calculated by the ratio between v and SF (Craig & Pendergast, 1979), and SI was obtained
from the product of SL times v (Costill et al., 1985).
Two pairs of video cameras (JVC GR-SX1 SVHS and JVC GR-SXM 25 SVHS) were used for
dual media videotape recording in non-coplanar planes. Both pairs of cameras were synchronised on real time and edited on a mixing table (Panasonic Digital Mixer WJ-AVE55 VHS and Panasonic Digital AV Mixer WJ-AVE5) creating one single “dual media” image, as it
was previously described by Vilas-Boas et al. (1997). One of the two supports was set in one forehead wall, 8.10 m away from the trajectory of the swimmer. The second structure was set in one of the lateral walls at 9.30 m from the forehead wall where the first structure was installed and at 10.20 m from the trajectory of the swimmer. Another camera (Panasonic DP
200 SVHS) was set in an underwater window in the forehead wall, at 0.90 m deep. One last
last cameras, the optical axis was oriented in the direction of the displacement of the swimmers. Each camera, or pair of cameras, recorded images of the swimmer in non-coplanar planes. Synchronisation of the images was obtained using LED’s placed on the recording field of every camera or pair of cameras, which were turned-on regularly and simultaneously to initiate the synchronisation every time the swimmer entered the performance volume. This was assumed to be delimited by the calibration volume, which was defined by a 27 m3 cube volume. The calibration cube was marked with 32 calibration points. The study comprised the 3D kinematical analysis of the different stroke cycles using the “Ariel Performance Analysis System” from Ariel Dynamics Inc. and a VCR (Panasonic
AG 7355) at a frequency of 50 Hz. Zatsiorsky’s model was used as adapted by de Leva
(1996) with 22 anatomical points of reference. The 3D reconstruction of the digitised images was performed using DLT. Coefficients of variation (CV) for the horizontal velocity of the
centre of mass along the stroke cycle were calculated – intra-cyclic velocity variation (dv).
Statistical procedures: Common descriptive statistics was used. Differences between mean values were studied using ANOVA. Individual regression equations (linear and polynomial) describing the relation between the bioenergetic and biomechanical variables were computed, as well as, its coefficients of determination and correlation. Partial correlations were also used when necessary. Statistical confidence was set to p≤0.05.
3. RESULTS & DISCUSSION
3.1. Swimming economy profiles of different swimming techniques
Figure 1 presents the economy profiles obtained for the four swimming strokes (Barbosa et al., 2006a).
Figure 1. Total energy expenditure (E-tot) at standardized swimming velocities for the four
competitive swimming strokes (some data were inter or extrapolated from E(v) individual
curves) (Barbosa et al., 2006a).
Comparing the results presented in figure 1 with the previously available, specially those from Holmér (1974), it is possible to understand that butterfly stroke significantly improved its economy over time, especially compared with breaststroke and backstroke. This allows to partially bridge the energy cost gap between continuous and discontinuous swimming techniques, reducing the spectrum of performance variability among competitive swimming techniques. It is also interesting to note that the tendency of the economy lines of breaststroke and butterfly to cross at lower swimming speeds was confirmed in a posterior approach (Barbosa et al., 2006b) – Figure 4B – where also a perceived tendency for butterfly stroke to cross the backstroke line at very high velocities was observed. This may be expected if a dramatic reduction in speed fluctuation is observed in v of the butterfly stroke.
10 20 30 40 50 60 70 80 90 100 110
E
-t
o
t
(m
lO
2
/K
g
/m
in
)
1.0 m/s 1.2 m/s 1.4 m/s 1.6 m/s
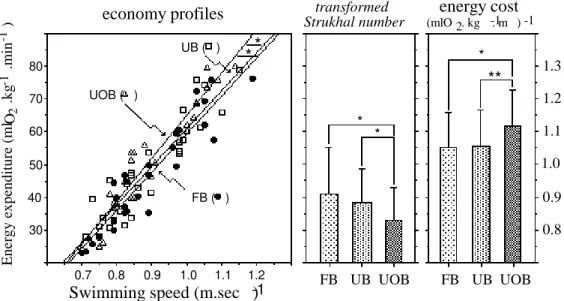
In figure 2 economy profiles of different variants of the breaststroke are presented.
Figure 2 shows that along with increased speed fluctuations (the inverse of the Strukhal number), also energy cost increased, supporting the significance of correlations obtained in the referred study.
This relationship was used to investigate also the other three swimming strokes. In figure 3, this relationship is reported for butterfly stroke (Barbosa et al., 2005a) based on a sample of 5 elite butterfliers, swimming 3 x 200 m (75, 85, 100%), with a 30 min rest.
Figure 2. Swimming economy profiles for flat (FB), undulated (UB) and undulated over-water arm recovery breaststrokers (UOB) (Vilas-Boas & Santos, 1994).
Figure 3. Relationship between energy cost (EC) and intracyclic speed fluctuations (dv) in butterfly (Barbosa et al., 2005b).
In another study, we tried to explore this relationship in the four competitive swimming strokes (figure 4) in elite swimmers. Significant positive correlation coefficients (p<0.05) were observed for freestyle, butterfly and backstroke, but a negative relationship was found for the breaststroke.
*
0.7 0.8 0.9 1.0 1.1 1.2 30 40 50 60 70 80
FB ( ) UB ( )
UOB ( )
*
Swimming speed (m.sec )
-1E n er g y e x p en d it u re ( m l .k g .m in ) -1 -1
O2 *
*
FB UB UOB
1.3 1.2 1.1 1.0 0.9 0.8
energy cost
(mlO . kg . m )2 -1 -1 transformed
Strukhal number
economy profiles
FB UB UOB
**
The finding in figure 4B can possibly be explained by the fact that higher dv values were
observed at lower mean speeds for breaststroke, associated with the possibility that v (and D) plays a more determinant role on EC than dv. When v was partialled out, the r value for
the breaststroke between energy cost and dv was 0.60 (p<0.05), which was of the same
magnitude as the one observed for the other swimming techniques (0.55 for backstroke and butterfly stroke, and 0.62 for freestyle).
A B
Figure 4. A - Relationship between energy cost (EC) and intracyclic speed fluctuations (dv), and B – relationship between energy expenditure (Etot) and swimming velocity (v) for the four
competitive swimming strokes (Barbosa et al., 2006b).
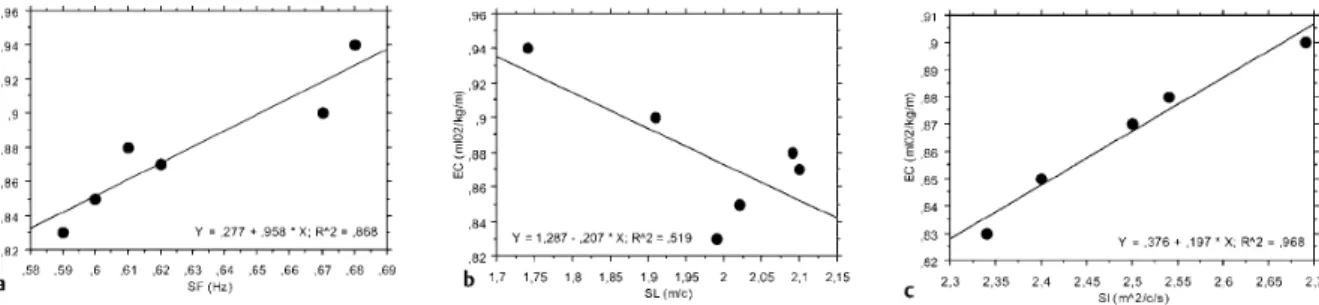
A similar effect was observed in the relationship between EC, and SI (figure 5 c) for butterfly stroke, showing a high influence of v if it is taken into consideration that the relationship
between EC and SL was negative, when individual analysis is performed (figure 5 b).
Figure 5. Relationship between energy cost (EC) and stroke frequency (SF) stroke length
(SL), and stroke index (SI), measured as the product between v and SL on individual basis (Barbosa et al. 2005a).
3.2. VO2 kinetics and time-limit at vVO2max
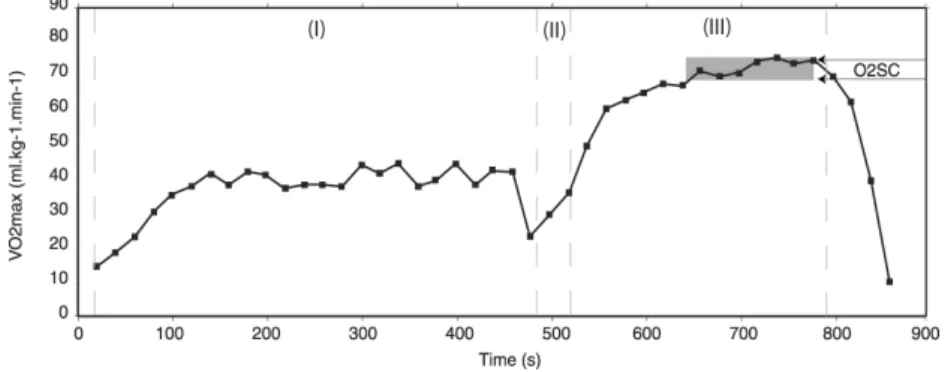
A typical VO2 kinetics profile of a rectangular maximal test after warm-up can be observed in
figure 6. This was obtained from a university or a regular level swimmer. It is possible to observe that during easy warm-up period, VO2 values grow until more than 50% VO2max.
It is very interesting to note in figure 6 that, approximately, only 90 s are needed to reach
VO2max, and that around 5 min is the maximal time that the swimmer can sustain vVO2max,
half of it with a clear slow component kinetics. This TLim-vVO2max was significantly correlated
with O2SC (r = 0.74, p<0.05), and was slightly higher than the previously reported by other
research groups, both in swimming and other sports (Billat et al, 1996; Faina et al., 1997; Demarie et al., 2001). The general characteristics of the O2 kinetics presented in the previous
example were that the higher the competitive level of the swimmer, and its VO2max, (i) the
lower the TLim-vVO2max, and (ii) the lower the time to reach VO2max. These findings are
relevant for training purposes: repetitions per set for aerobic power training don’t need to exes distances longer than 100 / 150 m, nor longer than 400 m.
Figure 6. Typical VO2 kinetics profile of a rectangular maximal test of a university to regular
level swimmer. (I) 500 m easy warm-up period; (II) 50 m progressive to vVO2max after a 30 s
rest for blood collection; (III) maximal test to exhaustion at vVO2max (TLim-vVO2maxtest). The VO2 slow component region (O2SC) is shown (Fernandes et al., 2003).
Figure 7 demonstrates that the TLim-vVO2max is inversely related to vVO2max, and with the
velocity corresponding to the anaerobic threshold (vAnT).
Figure 7. Relationships between TLim-vVO2max, vVO2max, and the velocity correspondent to
the anaerobic threshold (vAnT) (Fernandes et al., 2006b). y = -294,87x + 657,59
R2 = 0,392 (p < 0.01) N = 23
100 150 200 250 300 350 400 450 500
0,9 1 1,1 1,2 1,3 1,4 1,5 1,6
vVO2max (m.s-1)
T
L
im
-v
V
O
2
m
ax
(
s)
y = -242,92x + 565,36 R2 = 0,266 (p = 0.01) N = 23
100 150 200 250 300 350 400 450 500
0,8 0,9 1 1,1 1,2 1,3 1,4 1,5 1,6
vAnT (m.s-1)
T
L
im
-v
V
O
2
m
ax
(
These findings, even though surprising, show that top performers have high vVO2max, and vAnT, with a short TLim-vVO2max, as compared to their inferior counterparts. This is probably
because vVO2max of elite swimmers is more anaerobic (more participation of glycolytic
energy pathways) than that of lower competitive level swimmers, imposing higher ∆[La-]
between the beginning and the end of the TLim test - 6.8 ±2.2 vs. 8.2 ±1.6 mmol.l-1, p<0.05 (Fernandes et al., 2006a). Mean TLim-vVO2max for elite front crawl swimmers was found to
be 237.3 ±54.6 s, significantly different (p<0.05) than the 313.8 ±63.0 s observed for lower level swimmers (Fernandes et al., 2006a), similar with the 310 s of the example of figure 6. It is important to stress out that there are no significant differences in TLim-vVO2max attributable
to the swimming stroke performed (Fernandes et al., 2006b). We did found out mean values for freestyle of about 238.75 ±39.03 s, for backstrokers of 246.08 ± 51.93 s, for butterflyers of 277.63 ± 85.64 s, and for breaststrokers of 331.43 ± 82.73 s.
Interestingly to note, especially to relate the first and second parts of this paper, is that, exploring the relationships between TLim-vVO2max and swimming economy, we correlated it
with energy expenditure at vVO2max, with EC at vVO2max, with EC at 1.2 and 1.3 m.s-1
(velocities commonly used both by low and higher level swimmers, males and females), with
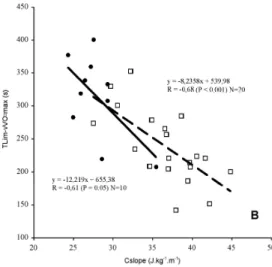
EC of the incremental protocol test, and with the Cslope of the E(v) function. The only
significant correlation that we found was a negative one, obtained between TLim-vVO2max
and Cslope of the E(v) function (Figure 8).
Figure 8. Relationship between TLim-vVO2max and Cslope of the E(v) function, computed for
10 low level, and 20 highly trained swimmers (Fernandes et al., 2006a).
The inverse relationships suggests that, the less economic the swimmer is, the lower the
TLim-vVO2max value, conflicting with the major findings that support the idea that the best
swimmers attain lower TLim-vVO2max. The explanation for this may be found in the
differences between the vVO2max values. Due to the expected cubic relationship between
mechanical power and swimming velocity:
P = D * v = K* v 2
* v = K * v
3 (6)
the much higher vVO2max of the elite swimmers impose also much higher EC, in proportion
Supporting this idea, and contradicting the possible easy lecture that the less economic (higher Cslope) are the most proficient (the lower TLim-vVO2max), we obtained significantly
higher EC values for low level (13.6 ±2.2 j.kg-1.m-1) than highly trained (11.7 ±2.3 j.kg-1.m-1)
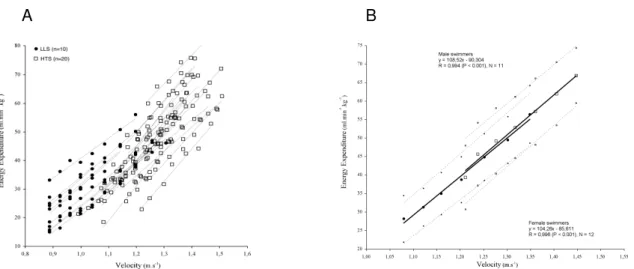
swimmers. In figure 9 a global overview of the economy plots of a large sample of swimmers can be observed, both from the groups of low (LLS), and high level (HTS). It is possible to understand that LLS tend to spend more energy for the same v, or swim slower with the
same E, but is also possible to perceive that there is important overlapping between the two
groups. Moreover, it is rather important to note that from 0.9 to 1.4 m.s-1 (55% increase), energy expenditure rises 5 times, even if extreme values are measured in swimmers of different proficiency.
A B
Figure 9. A - Economy scattergram (E vs. v) of a large sample of swimmers (n = 30), both
from the groups of low (LLS), and high level (HTS); B – Male and female mean (and 95% confidence intervals) economy profiles (Fernandes et al., 2006a).
Similar effect as the one observed for the Cslope was noticed for SL and SI (Fernandes et al.,
2006c) – figure 10.
Figure 10. Relationships between TLim-vVO2max and SL and SI, computed for 23 highly
High SL and SI values correspond to rather different velocities, being the ones of the elite
swimmers (lower TLim-vVO2max) which were much higher and, supposedly, determinant of
less gliding techniques and, consequently, with lower SL and SI values.
4. CONCLUSION
Swimming energetic is needed to understand performance, and the complexity of its determinant factors;
With years of training, relative economy of different swimming techniques seem to be changing, despite continuous swimming techniques (front crawl and backstroke) are still considered most economic even though butterfly stroke seem to be have changed most over the recent years;
Swimming economy is dependent on intra-cyclic speed fluctuations in all four competitive strokes, despite absolute mean velocity can influence more to the energy cost than its fluctuation;
Stroke parameters, such as SL, SF, and SI, are also related to swimming economy; - Swimming economy seem to be similar between genders;
- Aerobic energy expenditure determine the contribution of the swimmers’ overall energy expenditure. To train the maximal aerobic power of a swimmer, it is important to note that 90 s is sufficient to attain VO2max, and that it can be sustained from almost 4 min to more than 5 min. Distances between 100 and 400 m can be used to plan training sets;
- The higher the competitive level of a swimmer, the lower the TLim-vVO2max, probably because vVO2max seem to be more anaerobic;
- The slow component of VO2 kinetics is always perceptible, and seem to play an
important role in swimming energy expenditure, specially in swimmers of lower competitive level.
5. REFERENCES
Barbosa, T. M.; Fernandes, R.; Keskinen, K. L.; Colaço, P.; Cardoso, C.; Silva, J.; Vilas-Boas, J. P. (2006a). Evaluation of the Energy Expenditure in Competitive Swimming Strokes.
Int. J. Sports Med., 27: 894-899.
Barbosa, T.; Keskinen, K.; Fernandes, R.; Colaço, P.; Carmo, C.; Vilas-Boas, J. P.(2005a). Relationship between energetic, stroke determinants, and velocity in butterfly stroke. Int. J.
Sports Med., 26: 841-846.
Barbosa, T.; Keskinen, K.; Fernandes, R.; Colaço, P.; Lima, A.; Vilas-Boas, J. P. (2005b) Energy cost and intracyclic variation of the velocity of the centre of mass in butterfly stroke.
Eur. J. Appl. Physiol., 93: 519-523.
Barbosa, T.M.; Lima, F.; Portela, A.; Novais, D.; Machado, L.; Colaço, P.; Gonçalves, P.; Fernandes, R.; Keskinen, K.L.; Vilas-Boas, J.P. (2006b). Relationships between energy cost, swimming velocity and speed fluctuation in competitive swimming strokes. In: Vilas-Boas, J.P., Alves, F. and Marques, A. (Eds.), Biomechanics and Medicine in Swimming X.
Portuguese Journal of Sport Sciences, 6 (Suppl.2): 192-194.
Cardoso, C.; Fernandes, R.; Vilas-Boas, J. P. (2003). Comparison of continuous and intermittent triangular protocols for direct VO2max assessment in swimming. In J-C. Chatard (Edt.), Biomechanics and Medicine in Swimming IX, pp. 313-318. Saint-Étienne: Publications
de l’Université de Saint-Étienne.
Costill, D.; Kovaleski, J.; Porter, D.; Fielding, R.; King, D. (1985). Energy expenditure during front crawl swimming: predicting success in middle-distance events. Int. J. Sports Med., 6:
266-270.
Craig, A.; Pendergast, D. (1979). Relationships of stroke rate, distance per stroke and velocity in competitive swimming. Med. and Sci. in Sport, 11: 278-283.
de Leva, P. (1996). Adjustments to Zatsiorsky-Seluyanov’s segment inertia parameters. J.
Biomechanics, 29(9): 1223-1230.
Demarie, S.; Sardella, F.; Billat, V.; Magini, W.; Faina, M. (2001). The VO2 slow component in swimming. Eur. J. Appl. Physiol., 84: 95-99.
di Prampero, P.; Pendergast, D.; Wilson, D.; Rennie, D. (1978). Blood lactatic acid concentrations in high velocity swimming. In: Eriksson B, Furberg B (eds), Swimming
Medicine IV, pp. 249-261. Baltimore: University Park Press.
di Prampero, P. E.; Pendergast, D.; Wilson, D. W.; Rennie, D. W. (1974). Energetics of swimming in man. J. Appl. Physiol., 37 (1): 1-5.
Faina, M.; Billat, V.; Squadrone, R.; De Angelis, M.; Koralsztein, J. P.; Dal Monte, A. (1997). Anaerobic contribution to the time to exhaustion at the minimal exercise intensity at which maximal oxygen uptake occurs in elite cyclists, kayakists and swimmers. Eur. J. Appl. Physiol., 76 : 13-20.
Fernandes, R.; Billat, V.L.; Cruz, A.C.; Colaço, P.; Cardoso, C.; Vilas-Boas, J.P. (2006a). Does net energy cost of swimming affect time to exhaustion at the individual’s maximal oxygen consumption velocity? J. Sports Med. Fisical Fitness, 46: 373-80.
Fernandes, R.; Cardoso, C.; Silva, J.A.; Vilar, S.; Colaço, P.; Barbosa, T.M.; Keskinen, K.L.; Vilas-Boas, J.P. (2006b). Assessment of the time limit at lowest speed corresponding to maximal oxygen consumption in the four competitive swimming strokes. In: Vilas-Boas, J.P., Alves, F. and Marques, A. (Eds.), Biomechanics and Medicine in Swimming X. Portuguese
Journal of Sport Sciences, 6 (Suppl.2): 128-130.
Fernandes, R.; Marinho, D.; Barbosa, T.; Vilas-Boas, J. P. (2006c). Is time limit at the minimum swimming velocity of VO2max influenced by stroking parameters? Perceptual and Motor Skills, 103: 67-75.
Fernandes, R.J.; Cardoso, C.S.; Soares, S.M.; Ascensão, A; Colaço, P.J.; Vilas-Boas, J.P. (2003). Time limit and VO2 slow component at intensities corresponding to VO2max in swimmers. Int J Sports Med, 24: 582-587.
Holmér, I. (1974). Physiology of swimming man. Acta Phys. Scand., Suppl. 407: 1-55.
Howley E. T.; Basseet, T.; Welch, H. G. (1995). Criteria for maximal oxygen uptake: review and commentary. Med. Sci. Sports Exerc., 27: 1292-1301.
Keskinen, K.; Rodríguez, F; Kusch, M; Hoffmann, U. (2002). Validity of breath-by-breath spirometric measurements with two swimming snorkels assessed by a gas exchange simulation system. Book of Abstracts of the IXth World Symposium on Biomechanics and
Medicine in Swimming. Saint-Étienne, p. 95.
Keskinen, K. L.; Rodríguez, F. A.; Keskinen, O. P. (2003). Respiratory snorkel and valve system for breath-by-breath gas analysis in swimming. Scand. J. Med. Sci. Sports, 13:
Kuipers, H.; Verstappen, F. T.; Keize, H. A.; Guerten, P.; Van Kranenburg, G. (1985). Variability of aerobic performance in the laboratory and its physiologic correlates. Int. J.
Sports Med., 6: 197-201.
Rodríguez F, Keskinen K, Keskinen O, Malvela M (2003). Oxygen uptake kinetics during free swimming: a pilot study. In: Chatard J.-C. (ed). Biomechanics and Medicine in Swimming IX,
pp. 279-384. Saint-Étienne: Publications de l’Université de Saint-étienne.
Schmidt-Nielsen, K. (1972). Locomotion: energy cost of swimming, flying, and running.
Science, 177: 222-228.
Toussiant H, Meulemans A, De Groot G, Hollander AP, Schreurs A, Vervoon K (1987). Respiratory valve for oxygen uptake measurement during swimming. Eur. J. Appl. Physiol.,
56: 363-366.
Vilas-Boas, J.P. (1996). Speed fluctuations and energy cost of different breaststroke techniques. In J. P. Troup; A. P. Hollander; D. Strasse; S. W. Trappe; J. M. Cappaert; T. A. Trappe (Eds.), Biomechanics and Medicine in Swimming VII: Proceedings of the Seventh
International Symposium on Biomechanics and Medicine in Swimming, pp. 167-171. London:
E & F Spon.
Vilas-Boas, J.P.; Santos, P. (1994). Comparison of swimming economy in three breaststroke techniques. In: M. Miyashita; Y. Mutoh; A. B. Richardson (Eds.), Medicine and Science in
Aquatic Sports, pp. 48-54. Med. Sport Sci., 39. Basel: Karger.