BJRS
RADIATION SCIENCES
07 (2019) 01-16ISSN: 2319-0612 Accepted 2018-10-10
Analysis of the setup deviations generated in the 6D
ExacTrac X-ray system for patients in hypofractionated
intracranial radiosurgery treatments
M. M. Vasques
a, V. A. B. Ribeiro
b, C. P. Sales
b, A. P. V. Cunha
b, C. Z. S. Emiliozzi
ba
Faculdade de Medicina da Universidade de Sao Paulo, Sao Paulo, SP, BR
b
Departamento de Radiologia e Oncologia Serviço de Radioterapia do Instituto de Radiologia, Hospital das Clinicas HCFMUSP Faculdade de Medicina, Universidade de Sao Paulo, Sao Paulo, SP, BR
ABSTRACT
The purpose of this study was to evaluate the use of the pre-treatment daily imaging system with the Brainlab ExacTrac X-Ray 6D for patients in hypofractionated intracranial treatments and radiosurgery procedures in order to quantify setups errors and review margins used by the institution in the current planning protocol. The deviations generated in the translational and rotational coordinates were given in terms of the mean values and their respective standard deviations. The random and systematic errors were determined through the Stroom and Wang relation and 36 patients treated with intracranial hypofractionated radiosurgery from August 2015 to October 2016 were evaluated. The prescribed dose was 25-30 Gy in 5 fractions for 30 patients and 12-18 Gy in a single fraction for 6 patients. A 1.3 mm margin was found for the planning target volume (PTV) from the deviations analyzed, wich is consistent with that adopted by the institution. Correlation between the displacement vector, volume of the PTV and its respective loss of coverage was evaluated. Smaller volumes of PTV tend to suffer greater coverage losses when the isocenters were shifted. From the results, we suggest that for margins greater than 1 mm are recquired with PTV volume smaller than 2.6 cm3, in order to guarantee the expected coverage of the target.
1. INTRODUCTION
The International Commission on Radiation Units and Measurements (ICRU) considers three sources of uncertainties in the delivery of the planned dose to the patient: variations in patient positioning, internal organ movement, and equipment-related failures. Intrafractions variations are known to be unavoidable, even though different measures are taken to ensure high reproducibility of treatment1.
With increasing technology in radiotherapy, the complexity of treatment planning has increased and higher doses have been delivered to the tumor, so it is necessary to accurately assess the intrinsic deviations associated with the treatment in order to ensure better compliance of the tumor
with greater protection of healthy tissues. To achieve this goal, high-accurate positioning plays a
mandatory role, especially for hypofractionated treatments, as well as cranial radiosurgery
evaluated in this study2.
Image-guided radiation therapy (IGRT) has rapidly been adopted to improve the geometric accuracy of patient positioning during radiotherapy, reducing target positioning errors, therefore, enabling higly conformal treatments. IGRT can be defined as follows : increasing the precision by frequently imaging the target and/or healthy tissues just before or during treatment and acting on
these images to adapt the treatment3. The acquired images during treatment can be used for
monitoring patient and target geometry changes, potential adaptive planning or margin reduction4,5.
The ExacTrac X-Ray 6D Brainlab is an IGRT tool that uses infrared (IR) system,] a six degrees of freedom robotic table and two orthogonal X-ray tubes. The infrared system consists of 2 IR cameras, which are used to monitor reflective spheres placed on a stereotatic array to assist in the initial patient setup, which is attached to the treatment couch and can assist in the couch movement with a spatial resolution better than 0.3 mm. The radiographic kV devices consist of 2 oblique X-ray
imagers to obtain high-quality radiographs for patient position verification and adjustment6. The 6D
image fusion method achieve the target localization accuracy within 1 mm for cranial radiosurgery7. Therefore hypofractionated treatments and cranial radiosurgery can also be done considering imaging techniques and non-invasive fixation systems. Thus, the reliability generated by the frame is replaced by image-guided positioning techniques, such as the ExacTrac X-Ray system, and also
by immobilization/positioning system, such as thermoplastic masks8.
To minimize the dose inaccuracy administered to the tumor volume, use of safety margins
around the target volume is suggested1. According to the ICRU, considering volumetric planning,
the dose delivered to the PTV should be the actual dose given to the clinical target volume (CTV, and it is a volume of tissue that contains a demonstrable gross tumor volume, GTV, and/or subclinical malignant disease at a certain probability considered relevant for therapy) and the dose
heterogeneity should be maintained between 95 and 107%. In IMRT (Intensity Modulated
Radia-tion Therapy), the extent of high and low dose regions are specified using Dose-Volume metrics as
D2% (maximum absorbed dose) and D98% (minimum absorbed dose)9,10. In radiosurgery, dose
prescription in SRT (Stereotactic Radiotherapy) has been generally defined as the isodose line that most optimally conforms to the outline of the PTV as a percentage of the maximum dose in addition to an optimally restricted dose to the OAR (Organs at Risk)9.
However, in order to achieve such recommendations, the margins should not be added linearly in all directions, as they would become too large in size and incompatible with the tolerance doses of the healthy tissues. It is necessary to understand the geometric uncertainties inherent in the delivery process, resulting in methods for the engineering of three-dimensional margins that can accommodate these uncertainties. While the use of appropriate margins is critical if target volume coverage objectives were to be satisfied, it has become clear that substantial increases in prescription dose could be safely pursued if these margins could be reduced. Investigations of the
geometric uncertainties in radiation therapy illustrate the many challenges in reducing these
uncertainties11.
Using IGRT the margin reduction of PTV becomes possible, which helps to minimize doses administered to normal tissues. However uncertainties associated with the treatment can be divided into random and systematic errors. A systematic error can be understood as a mean change during
treatment, it means the average shift between treatment anatomy and planning scanned anatomy. A
random error, on the other hand, can be defined as the dispersion of the errors, day by day, over the treatment time. Online daily corrections for geometric errors can be applied to reduce systematic
and random errors, but even so, some final uncertainty is inevitable12.
standard deviation, which in turn should be used for the margin calculation. This approach assumes that systematic and random errors have equal effects on a dose distribution.
The objective of this study is to evaluate the use of the pre-treatment daily imaging system with
the Brainlab ExacTrac X-Ray 6D for patients in hypofractionated intracranial and radiosurgery treatments in order to quantify the setups errors, review margins used by the institution for the current planning protocol and create a model between the volume of the PTV, shift vector and its respective loss of coverage.
2. MATERIALS AND METHODS
2.1. ExacTrac System
The setup of treatments based on the ExacTrac X-Ray 6D system includes two steps: patient pre-setup using IR and X-ray verification images. The IR component has two IR emitters and two cameras installed on the ceiling of the treatment room to read the signal that is reflected by reflective beads distributed on the surface of the patient or in a location box. Using this information, an automatic configuration can be easily determined by moving the table to match the positioning marks determined by the CT image.
The X-ray component consists of two orthogonal X-ray tubes installed in the floor and two Amorphous Silicon panels in the ceiling. Two orthogonal X-ray images are obtained and compared to the reference bone anatomy using automatic fusion with the DRR images generated by the ExacTrac software. The result of the comparison gives the setup uncertainty in six degrees of freedom: three translational and three rotational.
2.2.
Treatment
We evaluated 36 patients treated with intracranial hypofractionated radiosurgery from August 2015 to October 2016 on a Varian 6EX linear accelerator. The prescribed dose was 25-30 Gy in 5 fractions for 30 patients and 12-18 Gy in a single fraction for 6 patients. The patient immobilization was performed with Brainlab thermoplastic masks. This mask is composed of three reinforcing
strips of thermoplastic material arranged on the forehead, nose and chin. The treatment isocenter was pre-positioned using the location box and IR system and the setup was corrected after the X-ray images were taken. The first deviations of the image were not considered in the analysis because such deviations were necessarily corrected. During the treatment, the images were taken at each table angle and the calculated deviations were corrected when values higher than the pre-determined tolerance limits (0.7 mm for translation and 1º for rotation). Corrections have been recorded.
The deviations generated in the translation coordinates (vertical, lateral and longitudinal) and rotation (roll, pitch and yaw) were analyzed and expressed in terms of mean values and their
standard deviations10. The distribution of random (RMS (σi)), systematic (Σ (μi)) and total errors
(Σoverall) were determined as presented by Infusino, Erminia et al13
. Margins were calculated for
the patients with the methodology proposed by Stroom14 and Wang15 in order to evaluate if the
current protocol used by the institution was adequate or not. In this analysis the vector resulting
( ) from the deviations was used to calculate the margin. Using the
same methodology, for the deviations found in each independent translational coordinate (x, y and z) we also calculate the respective margin and evaluate the resulting dosimetric impact in the Eclipse (Varian, 13.6.32) treatment planning system.
3. RESULTS AND DISCUSSION
A total of 656 X-ray images were analyzed. All these measurements were used to calculate the errors presented in Table 1 and showed in Figure 1.
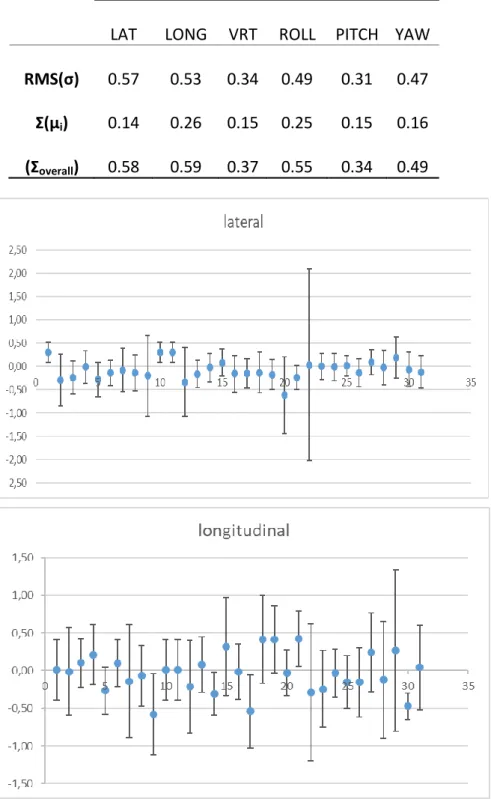
Table 1: Random (RMS(σ)), Systematic (Ʃ(µi)) and Total Error ((Ʃoverall) in Translational and Rota-tional Coordinates
Translational (mm) Rotational (degrees)
LAT LONG VRT ROLL PITCH YAW
RMS(σ) 0.57 0.53 0.34 0.49 0.31 0.47
Ʃ(µi) 0.14 0.26 0.15 0.25 0.15 0.16
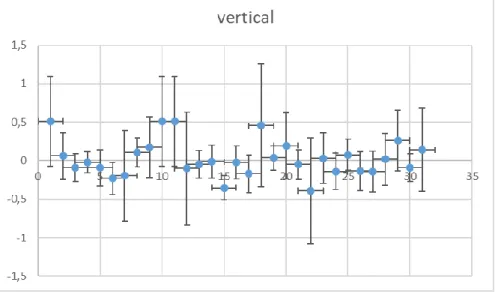
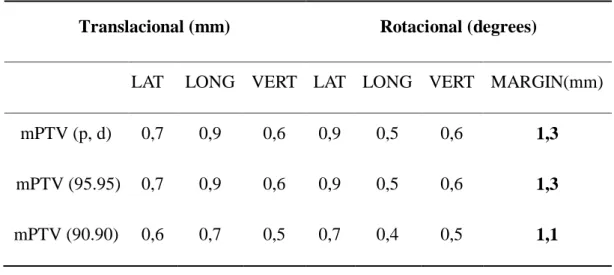
Figure 1: Patient positioning mean (mm). Error bars are standard deviations of the mean.
The systematic errors found in lateral, longitudinal and vertical coordinates were small, caused by variations in the daily positioning due to the immobilization system: 0.14, 0.26 and 0.15 mm, respectively. The random component was slightly larger, ranging from 0.3 to 0.6 mm, probably due to mask fixation power, inaccuracy of ExacTrac fusion algorithm in the inclusion or exclusion of certain characteristics anatomical or even, due to the variation among observers in the interpretation of the daily images. The maximum error was 0.6 mm, that is, the order of magnitude of the
accepta-ble error for patients treat with frame according to TG 4214. The result of systematic errors found by
Infusino et al are higher than those found in this study; they found global systematic errors less than 2.0 mm in each direction. However, the random component were similar, ranging from 0.1 to 0.3 mm at Infusino’s studies.
The rotational correction was relatively small, ranging from 0.1 to 0.6°. The 3D vector could be calculated for the translational components and the value found was 0.9 mm.
The PTV margins were determined with two different methodologies: equation 1 is the Stroom
formula; p is the percentage of patients receiving a determinate percentage of dose13, Σ is the
sys-tematic error and σ is the random error. Equation 2 is the Wang formula with 90 % of patients
re-ceiving 90% of prescription dose and equation 3 is the Wangformula with 95 % of patients
mPTV (p, d) = 2.0 ⋅ Σ + 0.7 ⋅ σ (1)
mPTV (90.90) = 1.64 (p) ⋅ Σ + 0.6 (d) ⋅ σ (2)
mPTV dose (95.95) = 1.96 (p) ⋅ Σ + 0.7 (d) ⋅ σ (3)
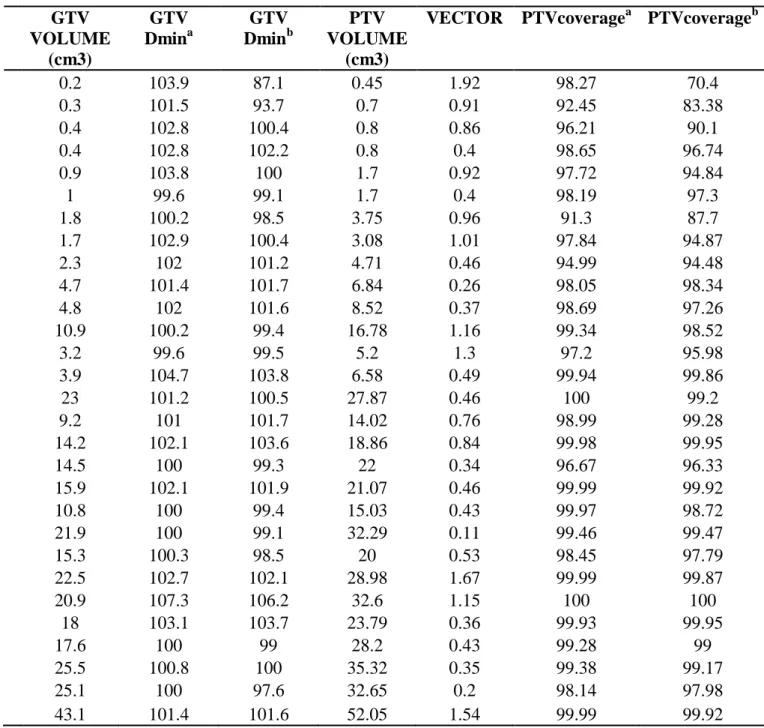
The margin for each coordinate was determined, and with this result, the vector representing the symmetric margin for the PTV could be found. Comparing the margin found at Infusino et al. (2.6 mm - lateral, 3.4 mm - craniocaudal and 3.9 mm - anteroposterior), our margin was smaller. Possible explanations for this are different treatment immobilizers between institutions and different fractionation of dose evaluated.
Table 2: Calculated margin results for hypofractionated patients
Translacional (mm) Rotacional (degrees)
LAT LONG VERT LAT LONG VERT MARGIN(mm) mPTV (p, d) 0,7 0,9 0,6 0,9 0,5 0,6 1,3
mPTV (95.95) 0,7 0,9 0,6 0,9 0,5 0,6 1,3
mPTV (90.90) 0,6 0,7 0,5 0,7 0,4 0,5 1,1
As a second analysis, with the shifs found, a new calculation for the margins to each transla-tional coordinate (x, y and z) were calculated with Stroom formula and applied to the isocenter of the original plane after importing treatment planning in the Eclipse 13.6.32 planning system.
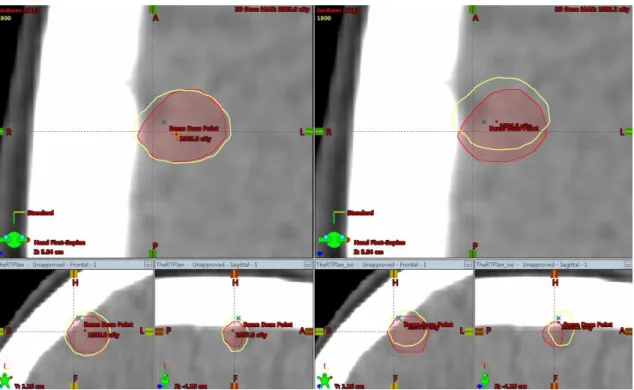
The resulting dosimetric impact could be evaluated. The result is shown in Table 3 in the re-sulting vector form. Those cases were selected to cover different vector-volume sets. The deviation was applied to isocenter coordinates of the original plane in order to measure the dosimetric impact for such errors, as shown in Figures 2 and 3.
Table 3: Vector resulting deviation applied to cases evaluated in Eclipse. GTV Dmina is the
origi-nal minimum dose of the plan. GTV Dminb is the minimum dose of the plan with the shift applied.
PTVcoveragea is the original coverage of the plan. PTVcoverageb is the coverage of the plan with
the shift applied.
GTV VOLUME (cm3) GTV Dmina GTV Dminb PTV VOLUME (cm3)
VECTOR PTVcoveragea PTVcoverageb
0.2 103.9 87.1 0.45 1.92 98.27 70.4 0.3 101.5 93.7 0.7 0.91 92.45 83.38 0.4 102.8 100.4 0.8 0.86 96.21 90.1 0.4 102.8 102.2 0.8 0.4 98.65 96.74 0.9 103.8 100 1.7 0.92 97.72 94.84 1 99.6 99.1 1.7 0.4 98.19 97.3 1.8 100.2 98.5 3.75 0.96 91.3 87.7 1.7 102.9 100.4 3.08 1.01 97.84 94.87 2.3 102 101.2 4.71 0.46 94.99 94.48 4.7 101.4 101.7 6.84 0.26 98.05 98.34 4.8 102 101.6 8.52 0.37 98.69 97.26 10.9 100.2 99.4 16.78 1.16 99.34 98.52 3.2 99.6 99.5 5.2 1.3 97.2 95.98 3.9 104.7 103.8 6.58 0.49 99.94 99.86 23 101.2 100.5 27.87 0.46 100 99.2 9.2 101 101.7 14.02 0.76 98.99 99.28 14.2 102.1 103.6 18.86 0.84 99.98 99.95 14.5 100 99.3 22 0.34 96.67 96.33 15.9 102.1 101.9 21.07 0.46 99.99 99.92 10.8 100 99.4 15.03 0.43 99.97 98.72 21.9 100 99.1 32.29 0.11 99.46 99.47 15.3 100.3 98.5 20 0.53 98.45 97.79 22.5 102.7 102.1 28.98 1.67 99.99 99.87 20.9 107.3 106.2 32.6 1.15 100 100 18 103.1 103.7 23.79 0.36 99.93 99.95 17.6 100 99 28.2 0.43 99.28 99 25.5 100.8 100 35.32 0.35 99.38 99.17 25.1 100 97.6 32.65 0.2 98.14 97.98 43.1 101.4 101.6 52.05 1.54 99.99 99.92
Figure 2: Loss of coverage after translational shifts. The image on left the side contains the
original plan with the prescription isodose completely enveloping the target volume. The image on the right side shows the target volume not being more completely involved by the isodose
af-ter the shift simulation.
The average loss in the PTV coverage was equal to or less than 2% to PTV when the total
vol-ume was bigger than 4cm3. The loss in the GTV coverage for any shift applied was also evaluated.
The result is shown in Table 3.
Those cases selected consist of 3D planning (non-IMRT) and included the lowest and highest volume of lesions found.
A decision tree-based regression methods was applied to the data with the purpose of predicting the average loss for PTV and GTV coverage. This model allowed to find the minimum volume of PTV that would have loss of coverage of up to 5% with deviations of 1mm (tolerated by the institution) and minimum volume of GTV that would have loss of coverage to a minimum dose below of 100%.
Figure 3: Loss of coverage after translational shifts in Dose and Volume histogram. The curve
with triangles describes the coverage for the GTV (gross tumor volume) and PTV (planning target volume) of the original plane without the shifts. The curve with squares describes the
plane with the shifts applied.
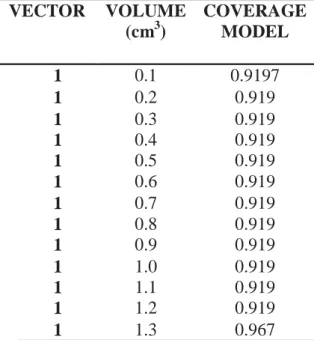
Table 4: PTV Coverage predicted by the model with an established displacement of 1mm VECTOR VOLUME (cm3) COVERAGE MODEL 1 0.1 0.9197 1 0.2 0.919 1 0.3 0.919 1 0.4 0.919 1 0.5 0.919 1 0.6 0.919 1 0.7 0.919 1 0.8 0.919 1 0.9 0.919 1 1.0 0.919 1 1.1 0.919 1 1.2 0.919 1 1.3 0.967
A fourth-degree polynomial mathematical model was applied to the data as shown in equation
4 and we found R2= 0.96. The model was developed in R-Studio which is a free software
environ-ment for statistical computing. This model is valid for vector between 0 and 2mm and maximum
PTV Volume of 52cm3 . The coverage PTV is the rate of PTVcoverageb and PTVcoveragea. This model allowed to find the minimum volume that would have loss of coverage of up to 5% with de-viations of 1mm (tolerated by the institution) as showed in table 4.
As can be evaluated, volumes smaller than 1.3 cm3, for deviations of 1mm, have loss of
coverage higher than the 5% accepted by the institution.
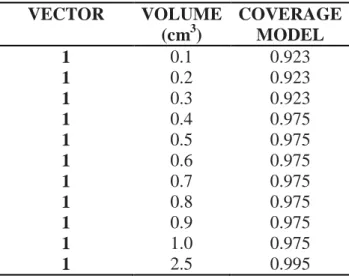
Table 5: GTV Minimum Dose predicted by model with an established displacement of 1mm
VECTOR VOLUME (cm3) COVERAGE MODEL 1 0.1 0.923 1 0.2 0.923 1 0.3 0.923 1 0.4 0.975 1 0.5 0.975 1 0.6 0.975 1 0.7 0.975 1 0.8 0.975 1 0.9 0.975 1 1.0 0.975 1 2.5 0.995
As can be evaluated, volumes smaller than 2.6 cm3, for deviations of 1 mm, have loss of GTV
coverage higher than the accepted by the institution (minimum dose of 100%).
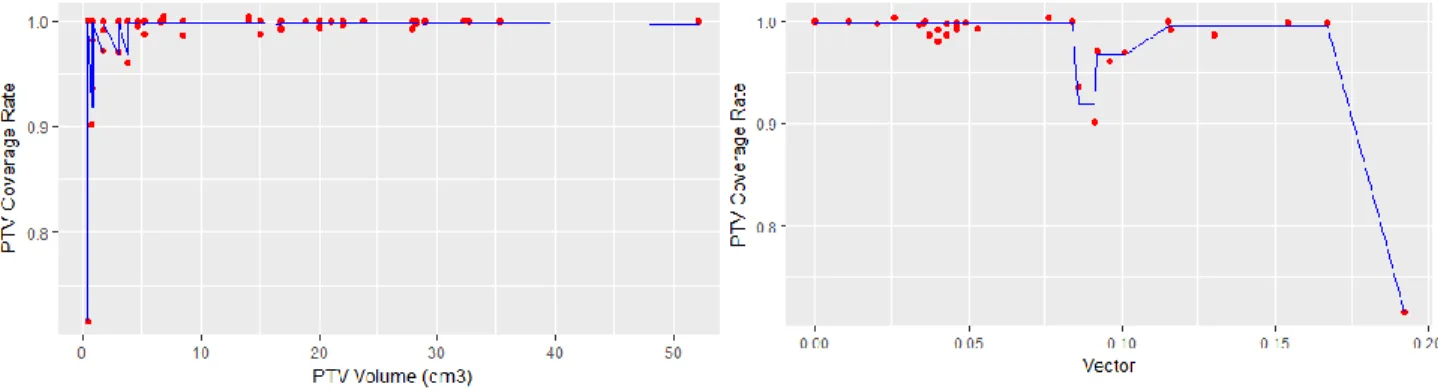
Finally, the coverage loss caused by the deviations raised in each translational coordinate as a function of the PTV volume was evaluated. This relation is described in Figure 4.
Figure 4: PTV coverage loss caused by the deviations raised in each translational coordinate as a
function of the PTV volume and displacement vector versus the predicted by tree-based regression.
The minimum dose of GTV caused by the deviations raised in each translational coordinate as a function of the GTV volume was evaluated. This relation is described in Figure 5.
Figure 5: GTV Minimum Dose caused by the deviations raised in each translational coordinate as
a function of the GTV volume and displacement vector versus the predicted by tree-based regression.
Although the random errors are errors distributed throughout the treatment, in this study we have cases of single dose or few fractions (5 fractions), these deviations were considered and main-tained in the formula in view that the number of images evaluated and considered is very relevant (n=656).
Even if the institution currently uses a 1 mm margin for PTV and the highest margin calculated with the methodology cited by Stroom and Wang was 1.3 mm, the current protocol can be consid-ered satisfactory since the loss assessment of coverage was not significant (Table 3).
When the correlation between the volume of the PTV, vector and its respective loss of coverage is evaluated (Figure 3), a possible tendency can be observed for smaller volumes to suffer greater losses in coverage when the isocenters were displaced with the resulting margins. This can be con-firmed by increasing the number of cases evaluated, which corresponds to our next step to work. In this way, it is suggested to evaluate the possibility that such volumes need bigger margins than the present one, considering their greater susceptibilities to the variations found.
4. CONCLUSION
It was found that set up uncertainties for patients treated with hypofractionated intracranial ra-diosurgery using IGRT with ExacTrac at this institution are in agreement with the rara-diosurgery
pro-tocols as presented in a preliminary research15.
Considering that the setup deviations evaluated do not significantly compromise the coverage of the evaluated GTV as previously showed on Table 3, it can be concluded that the results were consistent with the 1 mm margin adopted by the institution.
As showed on Figure 4 and 5, the deviation of the dose distribution caused by the positioning error has greater impact on smaller PTV volumes. The coverage loss, caused by the deviations, raised in each translational coordinate as a function of the PTV (Figure 4) or GTV (Figure 5) vol-ume and displacement vector.
Thus, we can suggest that for volumes smaller than 2.6 cm3, margins greater than 1 mm are
ACKNOWLEDGMENT
My sincere thanks to the entire Radiotherapy team at HCFMUSP for their collaboration with the work and the constant professional growth opportunity offered daily.
I thank the financial support of SGTES-Ministry of Health and SESu-Ministry of Education.
REFERENCES
[1] ICRU - International Commission on Radiation Units and Measurements. Prescribing,
Recording and Reporting Photon Beam Therapy (Supplement to ICRU Report 51). ICRU Report 62, Bethesda: ICRU, 1999. 47p.
[2] NCS - Netherlands Commission on Radiation Dosimetry. Process Management and Quality
Assurance for Intracranial Stereotactic Treatment. Report 25, Netherlands Commission on
Radiation Dosimetry. October 2015. 141p.
[3] HERK V.M. Different styles of image-guided radiotherapy. Semin Radiat Oncol. 2007;17:258–67.
[4] DING GX, DUGGAN DM, COFFEY CW, et al. A study on adaptive IMRT treatment planning using kV cone-beam CT. Radiother Oncol. 2007;85:116–125.
[5] PAWLOWSKI JM, YANG ES, MALCOLM AW, COFFEY CW, DING GX. Reduction of dose delivered to organs at risk in prostate cancer patients via image-guided radiation therapy. Int J
Radiat Oncol Biol Phys. 2010;76:924–934.
[6] JIN JY, YIN FF, TENN SE, MEDIN PM, SOLBERG TD. Use of the BrainLAB ExacTrac X-Ray 6D system in image-guided radiotherapy. Med Dosim.2008 Summer; 33(2):124-34.
[7] GEVAERT T.; VERELLEN D.; ENGELS B.; DEPUYDT T.; HEUNINCKX K.; TOURNEL K.; DUCHATEAU M.; REYNDERS T.; RIDDER M. IGRT - Clinical Evaluation of a Robotic 6-Degree of Freedom Treatment Couch for Frameless Radiosurgery. Int J Radiat Oncol Biol
Phys. 2012;83(1): 467-74.
[8] VERBAKEL WF, LAGERWAARD FJ, VERDUIN AJ, HEUKELOM S, SLOTMAN BJ, CUIJPERS JP.The accuracy of frameless stereotactic intracranial radiosurgery. Radiotherapy
[9] JIN J., RYU S., ROCK J., FABER K., GATES M., LI S., MOVSAS B. Image-Guided Target Localization for Stereotactic Radiosurgery: Accuracy of 6D versus 3D Image Fusion. Basel
Karger, v. 6, p. 50-59, 2006.
[10] ICRU - International Commission on Radiation Units and Measurements. Prescribing,
Recording, and Reporting Intensity-Modulated Photon-Beam Therapy (IMRT). ICRU Report 83, 2010. Available at: https://doi.org/10.1093/jicru/ndq002, Last accessed: August 2018.
[11] BALTER JM, CHEN GTY, PELIZZARI CA, et al. On-line repositioning during treatment of the prostate: A study of potential limits and gains. Int J Radiat Oncol Biol Phys 1993;27:137–143. [12] HERK V. Errors and margins in radiotherapy. Semin Radiat Oncol., v.14 p.52-64, 2004. [13]INFUSINO E, TRODELLA L, RAMELLA S, D'ANGELILLO R, GRECO C, IURATO A, E. TRODELLA L, NACCA A, CORNACCHIONE P AND MAMELI A. Estimation of patient setup uncertainty using BrainLAB Exatrac X-Ray 6D system in image-guided radiotherapy. Journal of Applied Clinical Medical Physics, v. 16; 2015.
[14] STROOM J. C., HEIJMEN B. J. M. Geometrical uncertainties, radiotherapy planning margins, and the ICRU-62 report. Radiotherapy and Oncology, v.64; 2002.
[15] Wang H1, Wang C1, Tung S1, Dimmitt AW2, Wong PF1, Edson MA2, Garden AS2, Rosenthal DI2, Fuller CD2, Gunn GB2, Takiar V2, Wang XA1, Luo D1,Yang JN1, Wong J1, Phan J2. Improved setup and positioning accuracy using a three-point customized cushion/mask/bite-block immobilization system for stereotactic reirradiation of head and neck cancer. J Appl Clin Med Phys. V16; 2016.