Article
, Vol. 29, No. 12, 2514-2521, 2018Printed in Brazil - ©2018 Sociedade Brasileira de Química
*e-mail: [email protected]
Fast
Ephedrine
Quantification
by
Gas
Chromatography
Mass
Spectrometry
GabrielR.A.Carneiro,aAndressaM.S.Silva,aRaquelM.Cavalcante,b MonicaC.Padilha,aFranciscoR.deAquinoNeto,aHenriqueM.G.Pereiraaand
ViníciusF.Sardela*,a
aLaboratório Brasileiro de Controle de Dopagem - Laboratório de Apoio ao Desenvolvimento Tecnológico
(LBCD-LADETEC), Instituto de Química, Universidade Federal do Rio de Janeiro, Avenida Horácio Macedo, 1281, Polo de Química, Bloco C, Cidade Universitária, 21941-598 Rio de Janeiro-RJ, Brazil
bDepartamento de Engenharia Química, Escola de Química, Universidade Federal do Rio de Janeiro,
Avenida Athos da Silveira Ramos, 149, Centro de Tecnologia, Bloco E, Sala E201, Cidade Universitária, 21941-909 Rio de Janeiro-RJ, Brazil
Ephedrines are widely used in therapy. Because of their stimulant properties, these substances are relevant in different forensic fields. At present, the state of the art for ephedrines quantification relay based on a liquid chromatography mass spectrometry, mainly because of the dilute-and-shoot approach. Notwithstanding, several gas chromatography based methods have already been described, all of them include cleanup steps, with the potential disadvantage of incurring errors and increasing the workload. In this paper, a straightforward method for ephedrine quantification based on gas chromatographic mass spectrometry, without cleanup and based on Doehlert matrix optimization is presented. Only 10 µL of a urine sample is necessary and for N -methyl-N-(trimethylsilyl)trifluoroacetamide/N-methyl-bis-trifluoracetamide derivatives, the intermediate precision was 2.77% for ephedrine, 9.20% for cathine, 8.29% for norephedrine and 4.27% for pseudoephedrine. The limit of detection was 20 ng mL-1 for ephedrine, 30 ng mL-1 for cathine and 40 ng mL-1 for norephedrine and pseudoephedrine.
Keywords: ephedrines, gas chromatography, mass spectrometry, Doehlert matrix optimization, doping control
Introduction
Ephedrines are alkaloids widely used in therapies for the treatment of asthma and narcolepsy.1,2 Side effects
already described for ephedrine use include anxiety, headache, hallucinations, high blood pressure, increased heart rate, loss of appetite, and inability to urinate.2,3 An
ephedrine overdose usually causes a stroke, heart attack and addiction.4,5 Ephedrine abuse is also widespread among
amateur and professional athletes to improve performance (doping).6
Because ephedrines are classical medicines and easily accessible, the World Anti-doping Agency (WADA) included these compounds in their list of prohibited substances with a threshold concentration in urine.7
The threshold established by WADA7 for ephedrine
(10 µg mL-1), pseudoephedrine (150 µg mL-1), cathine
(5.0 µg mL-1) and methylephedrine (10 µg mL-1) are at the
µg mL-1 level. Hence, sensitivity is not a critical parameter
in method development. Nevertheless, doping control laboratories must develop fast, reproducible, accurate, robust and forensically reliable methods for quantification of these substances.
Many methods have been developed to quantify ephedrines in urine, including the gas chromatography nitrogen phosphorous detector (GC-NPD),8 GC mass
spectrometry (GC-MS),9 ion mobility MS (IM-MS)10 and
liquid chromatography MS in tandem (LC-MS/MS).11
Among them, LC-MS/MS is the most frequently used method, enabling the direct injection of dilute urine into the chromatographic system. This approach is very straightforward, simple and quick, and decreases sample handling and improves the robustness of quantification.12
retention times due to matrix overloading of the column and pH matrix influence on chromatographic resolution.13
Moreover, some urine causes a strong matrix effect (ion enhancement or suppression), which interferes with electrospray ionization (ESI).14-16
All other methods described, including the GC-based ones, require sample pretreatment such as liquid-liquid extraction, solid-phase extraction and/or filtration, which is time-consuming and reduces the sample throughput .8-10,17
The application of GC analysis to quantify ephedrines was first developed in 1977 by Lin et al.18 They used a specific
electron-capture assay after a liquid-liquid extraction with benzene and trifluoroacetic acid (TFA) derivatives to detect pseudoephedrine and norpseudoephedrine.18 Subsequently,
the GC method to determine ephedrine was modified to reduce the toxicity of sample preparation and improve the sensitivity using toluene as the extraction solvent and trifluoroacetic anhydride (TFAA).19 In doping control, the
first GC method capable of quantifying all the ephedrines simultaneously was described in 2001 by Van Eenoo et al.,8
who used GC-NPD. In addition, sample preparation was performed using a liquid-liquid extraction at alkaline pH, where the organic part was subsequently concentrated by evaporation and injected into a gas chromatograph with a nitrogen-phosphorus detector. The method was demonstrated to be accurate and to improve the speed of analyses because it eliminated the derivatization step. However, in contrast to MS-based detection, NPD detection does not allow molecular characterization, requiring a complementary method to meet WADA requirements.20
Although direct injection has been used to determine ephedrines in urine via LC-MS/MS, the direct injection on GC-MS has not been explored. In this study, we present a rapid GC method to quantify ephedrine concentrations in urine by the injection of the derivatized sample into a gas chromatograph-mass spectrometer.
Experimental
Reagents
N-Methyl-N-(trimethylsilyl)trifluoroacetamide (MSTFA, Sigma-Aldrich, Massachusetts, USA), N -methyl-bis-trifluoracetamide (MBTFA, Sigma-Aldrich, Massachusetts, USA) and tert-butyl alcohol (Tedia, Rio de Janeiro, Brazil) were used in this study. The standards used in the tests were ephedrine, norephedrine, pseudoephedrine and cathine, all from LGC Standards (London, United Kingdom). As the internal standard, D3-2-(dimethylamino)-1-(4-methylphenyl)-1-propanol (LGC Standards, London, United Kingdom) was used.
GC-MS analysis
The analysis was performed using a gas chromatograph coupled to an ISQ quadrupole mass spectrometer (Thermo Scientific, San Jose, USA) equipped with a Thermo Scientific™ TriPlus™ RSH autosampler (Thermo Fisher Scientific, Milan, Italy). The carrier gas was helium (ultrapure) with an initial flow rate of 0.9 mL min-1 at
a constant pressure of 19.0 psi. An HP-5MS® capillary
column (5% methylsiloxane, 15 m, 0.20 mm i.d., film thickness 0.33 µm; J&W Scientific, Agilent Technologies Inc., California, USA) was used. The injection temperature (Tinj) was 250 °C. The injection mode consisted of the following parameters: 3 µL split 1/20; septum purge 60 mL min-1. A split/splitless in-house deactivated glass
single liner from HP (cup 6 mm length × 1 mm) and an internal volume of 1.1 mL was used. Inside the liner, 0.017 mg of deactivated glass wool was well compacted between 23 and 33 mm, as measured from its top. The GC temperature program was set as follows: the initial column oven temperature was 60 °C (held for 1 min); the temperature was then increased to 100 °C at 30 °C min-1
(held isothermally for 1 min), then to 120 °C at 3 °C min-1
(held isothermally for 1 min), and finally to 300 °C at 90 °C min-1 (held for 2.6 min). The mass spectrometer was
operated in the electron ionization (EI) mode at 70 eV with the following parameters: ion source temperature, 250 °C; interface temperature, 280 °C; quadrupole temperature, 180 °C; accelerating voltage, 100 eV higher than the standard tune; in full-scan mode within a mass range of
m/z 50-600 and SIM (selective ion monitoring) for m/z 179.
Sample preparation
The samples were analyzed by the method described by Sardela et al.21 for quantification of glycerol. Briefly,
ten microliters of urine sample were mixed with 190 µL of a freshly prepared internal standard (I.S.) solution containing 200 µL of an I.S. solution (100 µg mL-1
D3-2-(dimethylamino)-1-(4-methylphenyl)-1-propanol in methanol) and 1.8 mL of tert-butanol. The samples were subsequently dried at 40 °C under flowing N2 for
3 min. The dried extract was derivatized with a selected derivatization procedure: 100 µL of MSTFA at 80 °C for 30 min combined to 10 µL of MBTFA for 10 min, and then analyzed using GC-MS.
Derivatization evaluation procedure
pseudoephedrine, cathine and norephedrine at a concentration of 1 µg mL-1. Six aliquots of 10 µL were prepared:
(i) 3 aliquots were derivatized only with 100 µL of MSTFA and heated to 60 °C for 30 min, and (ii) another 3 aliquots were derivatized under the same conditions, plus 10 µL of MBTFA. All the aliquots were transferred to vials and analyzed using GC-MS.
Ephedrine instrumental analysis
Ephedrines were injected from derivatized urine into a gas chromatograph and analyzed using MS. The injections were performed with variable volumes, splits and Tinjs according to a Doehlert design.22 The variables were Tinj,
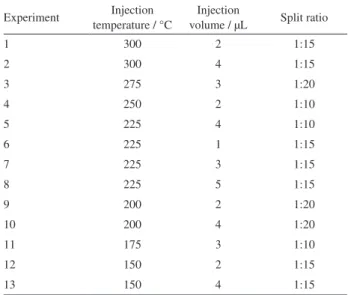
injection volume (Vinj) and split ratio (Split). The number of levels for these variables were established according to the geometry of the design employed, which resulted in a study with seven levels for Tinj, five levels for Vinj and three levels for Split, totaling 13 experiments. The total Tinj was varied between 150 and 300 °C, the Vinj between 1 and 5 µL and the Split between 10 and 20. Table 1 shows the numbered experiments designed for these variables according to a Doehlert matrix. Data obtained were modeled using Statistica for Windows software,23 employing the experimental design
module. Triplicates at the central point were performed to estimate the experimental variance.
Assay validation
The experimental design used for the validation experiments was based on WADA’s Technical Document, International Standard for Laboratories.24
Linearity was evaluated using six concentration levels: 5, 7.5, 10, 12.5, 15 and 20 µg mL-1 for ephedrine and
pseudoephedrine and 2.5, 3.75, 5, 6.25, 7.5 and 10 µg mL-1
for cathine and norephedrine. In this study, three replicates were prepared at each concentration levels. Subsequently, the quadratic determination coefficient (R2) was determined for the calibration curve. Although
norephedrine is not a prohibited substance in doping control, further studies related the concentration of this substance and the misuse of ephedrine can be reevaluated in the future. Therefore, a procedure able to quantify ephedrine and its respective metabolite, as described in this work, would be relevant.
Using calibration curves obtained according to a linearity approach, the repeatability was evaluated after quantification of 10 replicates of the same urine spiked at 10 µg mL-1 for ephedrine and pseudoephedrine and
5 µg mL-1 for cathine and norephedrine. The precision
was calculated for each compound as the relative standard deviation (RSD). Because the method consisted of a direct injection approach, the extraction efficiency was not evaluated. For evaluating the matrix interference, negative urine samples (n = 10) were analyzed to determine if endogenous interfering peaks were present at the expected retention times for the analytes and the I.S.
Intermediate precision was performed on a following day evaluating the calibration curve with the same points of linearity and 10 aliquots of different urines spiked at concentrations of 10 µg mL-1 for ephedrine
and pseudoephedrine and 5 µg mL-1 for cathine and
norephedrine.
Limit of detection (LOD) and lower limit of quantification (LLOQ)
The LOD and LLOQ were determined for the lowest point of the calibration curve obtained in the linearity experiment. The criteria established were lowest concentrations that would be detected with a signal-to-noise (S/N) > 3 for LOD and S/N > 10 for LLOQ.
Results and Discussion
MSTFA evaluation
The hydrogens from hydroxy and amine groups from ephedrines were replaced by the trimethylsilyl (TMS) after reaction of ephedrines with MSTFA. The ephedrines-N-TMS-O-TMS products, when submitted to MS analysis, led to a primary β-homolytic cleavage adjacent to the N atom:
m/z 130 for ephedrine and pseudoephedrine and m/z 116
Table1. Experimental design for the three variables (injection temperature, volume of injection and split ratio) according to a Doehlert matrix
Experiment Injection temperature / °C
Injection
volume / µL Split ratio
1 300 2 1:15
2 300 4 1:15
3 275 3 1:20
4 250 2 1:10
5 225 4 1:10
6 225 1 1:15
7 225 3 1:15
8 225 5 1:15
9 200 2 1:20
10 200 4 1:20
11 175 3 1:10
12 150 2 1:15
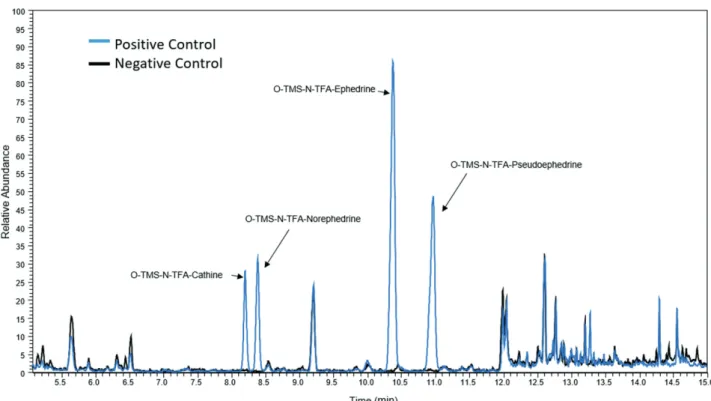
for cathine and norephedrine; the other ions were smaller than 10% of these base ions. Although all ephedrines have fragments similar to these, the molecules showed chromatographic selectivity and could be identified by their retention time. However, for pseudoephedrine, an intense peak with the same m/z at the same retention time was observed in all negative urines evaluated (Figure 1a). Using the NIST spectral library, the interference was identified as creatinine, which was present in high concentrations in all urine samples analyzed, as expected. The presence of this interference precludes the accurate quantification of pseudoephedrine because it cannot be differentiated from creatinine. Several modifications were performed on the chromatographic run to separate them, without success. This interference was not observed when cleanup steps were included in the protocol; however, this approach is not feasible because the goal is to eliminate the cleanup steps to save time and reduce manpower. Therefore, this derivatization was not effective for the analysis of all ephedrines without a sample extraction step, one of the main advantages of the present method.
MSTFA/MBTFA evaluation
Although MSTFA is the most volatile of the silyl reagents and is presently most often used in GC-MS analysis
for doping control and clinical analysis,13 for stimulants, the
combination of MSTFA and MBTFA is well described.25,26
First, with the addition of MSTFA, the silylation of the amine and hydroxy groups occurred, as already observed in the previous derivatization. When added, MBTFA reacted with the molecules by replacing the trimethylsilyl group attached to the nitrogen with a trifluoroacetyl group through a nucleophilic substitution reaction of the SN2 type. MSTFA
was used prior to MBTFA to avoid competition between the two derivatization reagents. If both reagents are added simultaneously, different products can be formed. The reaction with MBTFA occurs only at the nitrogen and not at the oxygen. The fact that oxygen forms a more stable bond with silicon than with nitrogen enables selective substitution in the amine.
The fragmentation of N-TFA-O-TMS derivatives from ephedrine compounds was influenced by the trifluoroacetamide group, as described by Sardela et al.27
in 2009. This fragmentation induces the formation of an
m/z 179 ion, which is common to all ephedrines (Figure 2). Therefore, in the drug analysis of urine, all the analytes were detected without interference after the diagnostic ion was different, and the retention time of creatinine did not coincide with the ephedrines (Figure 3).
Because of the results obtained using a combination of MSTFA with MBTFA as a derivatizing agent, this
combination was chosen for use during the development of this work.
Injection Doehlert matrix optimization
The results obtained in the analyses were evaluated using statistical software to perform a multivariate optimization based on the Doehlert matrix. This approach is considered more efficient than univariate processes because it enables evaluation of the influence of several parameters of a procedure simultaneously with a smaller number of experiments. Given that no sample cleanup was performed, an optimization using multivariate analysis regarding the
injection condition was evaluated. The variables used for this analysis were (i) the Vinj of the sample, (ii) the Split Ratio and (iii) the Tinj.
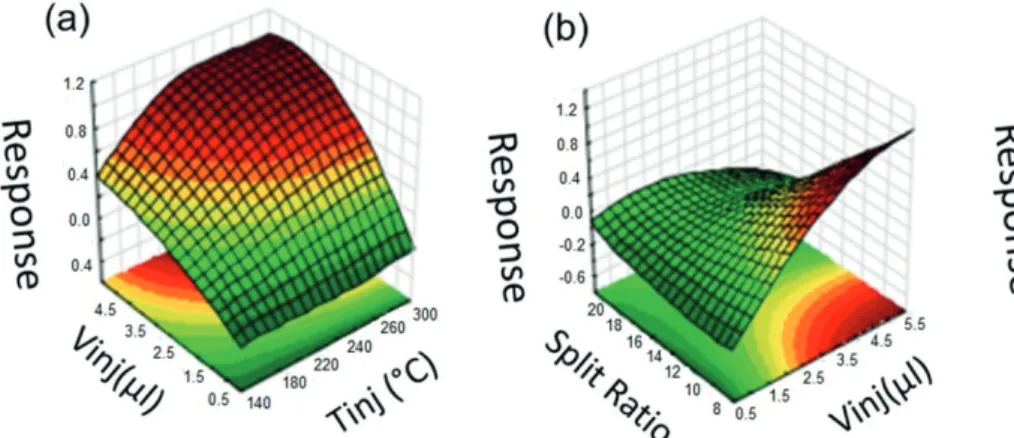
The results of the multivariate optimization for ephedrine are evident in the regions of the graph in Figure 4. The red color shows the parameters that generate the greatest response, whereas green represents parameters that generate the lowest values. The graph surface indicates that volumes less than 3 µL increase the sensitivity and that volumes greater than 3 µL do not further affect the response (Figures 4a and 4b). Therefore, 3 µL was used as the Vinj. Evaluating the graphic’s surface for the volume against the Tinj (Figure 4a), it was revealed that at 3 µL Vinj, the response remains the same after 250 °C; thus, at higher temperatures, the results were practically the same. Given the possibility of ephedrine degradation,9 the final Tinj of 250 °C was
considered the best.
The last parameter to be defined was the Split. The graph of the Split against the Tinj (Figure 4c) shows that lower Splits resulted in better sensitivity at 250 °C. The same behavior was observed in the graph of the Split against the Vinj (Figure 4b), where the higher sensitivity was observed at 3 µL for the lowest Split (1:10). Thus, the Split was set at 1:10.
With the experimental parameters selected, a test with 5 injection repetitions was performed to verify the reproducibility of the procedure. The RSD (in percentage)
Figure2. Reaction of ephedrine with MSTFA and MSTFA/MBTFA reagent.
obtained for ephedrine’s area exceeded 22%. The Split 1:10 gave results with the highest noise and the peak integration was compromised. Therefore, a Split of 1:20 was evaluated, and the signal-to-noise ratio was compared for both Splits; the signal-to-noise ratios of the two splits were similar to each other.
Finally, the injection parameters chosen to perform the analysis were 250 °C Tinj, 3 µL Vinj and 1:20 Split.
Validation
The N-TFA-O-TMS derivatives for all ephedrines were stable for at least ten days at room temperature. Moreover, the analytical ranges set to 5-20 µg mL-1 for ephedrine
and pseudoephedrine and 2.5-10 µg mL-1 for cathine and
norephedrine showed acceptable linearity (r2 ≥ 0.990)
using a least-squares fit (Figure 5). Reference samples from
Figure4. Multivariate analysis of the injection parameters optimization for the ephedrine analysis.
the WADA External Quality Assessment Scheme (EQAS) were analyzed. A quantitative comparison between the consensus value of 32 doping control laboratories and the estimated concentration obtained with this present method was performed. The intermediate precision was 2.77% for ephedrine, 9.20% for cathine, 8.29% for norephedrine and 4.27% for pseudoephedrine. For seven aliquots from EQAS urine, the repeatability (RSD) was 4.97% for ephedrine, 8.94% for cathine, 8.00% for norephedrine and 6.99% for pseudoephedrine. The LLOQ (S/N > 10) was estimated by measuring the signal-to-noise ratio of blank urine spiked with all compounds at 60 ng mL-1
for ephedrine, 110 ng mL-1 for cathine, 140 ng mL-1 for
norephedrine and 150 ng mL-1 for pseudoephedrine, and
the LODs (S/N > 3) for compounds were 20 ng mL-1
for ephedrine, 30 ng mL-1 for cathine, 40 ng mL-1 for
norephedrine and 40 ng mL-1 for pseudoephedrine.
The LODs and LLOQs observed for the ephedrines are similar to the other procedures previously described, and considering that any cleanup step was performed in the present work, the noise observed for all the ephedrines detection was considerable low, which is suitable for analytical and toxicological propose. Ephedrine regions were negligible in the blank urine injected after the analysis of higher concentration level controls in the calibration curves; thus, the carry over, if any, does not interfere in the estimation of the concentration or with the linearity of the calibration curve.
Conclusions
The direct derivatization of dried urine was a straightforward method for ephedrine quantification based on GC-MS. The procedure dispenses cleanup steps and reduces the sample handling. The double derivatization with MSTFA/MBTFA showed less matrix interference than a single derivatization with MSTFA. Especially for pseudoephedrine analysis, N-TFA-O-TMS derivative is more indicated in order to avoid creatinine interference. Given that no sample cleanup was performed, an optimization using multivariate analysis regarding the injection condition was evaluated in order to improve the robustness and linearity of the instrumental result. Applying the optimized injection parameters: 250 °C of injector temperature, 3 µL of injection volume and a split ratio of 1:20, the procedure showed analytical ranges of 5-20 µg mL-1 for ephedrine and pseudoephedrine and
2.5-10 µg mL-1 for cathine and norephedrine, and high
sensitivity to quantify and identify all the compounds. The N-TFA-O-TMS derivatives for all ephedrines were stable for at least ten days at room temperature, the
analytical ranges was set to 5-20 µg mL-1 for ephedrine
and pseudoephedrine and 2.5-10 µg mL-1 for cathine and
norephedrine. The intermediate precision was 2.77% for ephedrine, 9.20% for cathine, 8.29% for norephedrine and 4.27% for pseudoephedrine and the LLOQ was 60 ng mL-1
for ephedrine, 110 ng mL-1 for cathine, 140 ng mL-1 for
norephedrine and 150 ng mL-1 for pseudoephedrine.
Acknowledgments
This work was supported by CNPq, FAPERJ and Ministério do Esporte. We wish to thank ThermoFisher Scientific and Nova Analitica for providing us with all the technical assistance for this development.
References
1. Gaddum, J. H.; Br. Med. J.1938, 1, 713.
2. Lessenger, J. E.; Feinberg, S. D.; J. Am. Board Fam. Pract.
2008, 21, 45.
3. Lake, C. R.; Gallant, S.; Masson, E.; Miller, P.; Am. J. Med.
1990, 89, 195.
4. Ulbricht, C.; Chao, W.; Costa, D.; Rusie-Seamon, E.; Weissner, W.; Woods, J.; Curr. Drug Metab.2008, 9, 1063.
5. Haller, C. A.; Benowitz, N. L.; N. Engl. J. Med.2000, 343, 1833.
6. Martin, D. M.; Baron, D. A.; Gold, M. S.; J. Addict. Dis.2006,
25, 5.
7. World Anti-Doping Agency (WADA) Technical Document - TD2017DL; Decision Limits for the Confirmatory Quantification of Threshold Substances, version 1.0; WADA: Montreal, 2017. Available at https://www.wada-ama.org/sites/default/files/ resources/files/2016-12-13_td2017dl.pdf, accessed in January 2018.
8. Van Eenoo, P.; Delbeke, F. T.; Roels, K.; De Backer, P.;
J. Chromatogr. B: Biomed. Sci.Appl.2001, 760, 255. 9. Sardela, V. F.; Sardela, P. D. O.; Pereira, H. M. G.; Neto, F. A.;
J. Chromatogr. A2011, 1218, 1266.
10. Lokhnauth, J. K.; Snow, N. H. J.; Sep. Sci.2005, 28, 612. 11. Deventer, K.; Pozo, O. J.; Van Eenoo, P.; Delbeke, F. T.;
J. Chromatogr. B2009, 877, 369.
12. Deventer, K.; Pozo, O. J.; Verstraete, A. G.; Van Eenoo, P.;
TrAC,Trends Anal. Chem.2014, 55, 1.
13. Helfer, A. G.; Michely, J. A.; Weber, A. A.; Meyer, M. R.; Maurer, H. H.; J. Chromatogr. B2017, 1043, 138.
14. Isaguirre, A. C.; Olsina, R. A.; Martinez, L. D.; Lapierre, A. V.; Cerutti, S.; Microchem. J.2016, 129, 362.
15. Schlittenbauer, L.; Seiwert, B.; Reemtsma, T.; J. Chromatogr. A2015, 1415, 91.
17. Saito, T.; Mase, H.; Takeichi, S.; Inokuchi, S.; Pharm. Biomed. Anal.2007, 43, 358.
18. Lin, E. T.; Brater, D. C.; Benet, L. Z.; J. Chromatogr. A1977,
140, 275.
19. Lo, L. Y.; Land, G.; Bye, A.; J. Chromatogr. B: Biomed. Sci. Appl.1981, 222, 297.
20. World Anti-Doping Agency (WADA) Technical Document - TD2015IDCR; Technical Document Minimum Criteria for Chromatographic-Mass Spectrometric Confirmation of the Identity of Analytes for Doping Control Purposes, version 1.0; WADA: Montreal, 2015. Available at https://www.wada-ama. org/sites/default/files/resources/files/td2015idcr_-_eng.pdf, accessed in January 2018.
21. Sardela, V. F.; Scalco, F. B.; Cavalcante, K. M.; Simoni, R. E.; Silva, D. R.; Pereira, H. M. G.; Costa, M. L. L.; Aquino Neto, F. R.; Drug Test. Anal.2015, 7, 967.
22. Ferreira, S. L.; dos Santos, W. N.; Quintella, C. M.; Neto, B. B.; Bosque-Sendra, J. M.; Talanta 2004, 63, 1061.
23. Statistica, version 12.0; Statsoft, São Paulo, Brazil, 2013. 24. World Anti-Doping Agency (WADA); Technical Document
International Standard for Laboratories, version 7.0; WADA: Montreal, 2016. Available at https://www.wada-ama.org/sites/ default/files/resources/files/isl_june_2016.pdf, accessed in June 2018.
25. Donike, M.; J. Chromatogr. A1975, 115, 591.
26. Sardela, V. F.; Sardela, P. D.; Deventer, K.; Araujo, A. L.; Cavalcante, K. M.; Padilha, M. C.; Van Eenoo, P.; Neto, F. R. A.; J. Chromatogr. A2013, 1298, 76.
27. Sardela, V. F.; Motta, M. T. R.; Padilha, M. C.; Pereira, H. M. G.; Neto, F. R. A.; J. Chromatogr. B2009, 877, 3003.
Submitted: February 16, 2018 Published online: July 3, 2018