Decreased muscle strength is associated with
proin
fl
ammatory cytokines but not testosterone
levels in men with diabetes
J.P. Ferreira
1, A.M.O. Leal
2, F.A. Vasilceac
3, C.D. Sartor
4,5, I.C.N. Sacco
4, A.S. Soares
1and
T.F. Salvini
1 1Laboratório de Plasticidade Muscular, Departamento de Fisioterapia, Universidade Federal de São Carlos, São Carlos, SP, Brasil 2Departamento de Medicina, Universidade Federal de São Carlos, São Carlos, SP, Brasil 3Departamento de Gerontologia, Universidade Federal de São Carlos, São Carlos, SP, Brasil 4Departamento de Fisioterapia, Fonoaudiologia e Terapia Ocupacional, Faculdade de Medicina, Universidade de São Paulo,
São Paulo, SP, Brasil 5Departamento de Fisioterapia, Universidade Ibirapuera, São Paulo, SP, Brasil
Abstract
The aim of this study was to compare muscle strength in male subjects with type 2 diabetes mellitus (DM2) with and without low plasma testosterone levels and assess the relationship between muscle strength, testosterone levels, and proinflammatory cytokines. Males (75) aged between 18 and 65 years were divided into 3 groups: control group that did not have diabetes and had a normal testosterone plasma level (4250 ng/dL), DnormalTT group that had DM2 with normal testosterone levels, and the DlowTT group that had DM2 and low plasma testosterone levels (o250 ng/dL). The age (means±SD) of the groups was
48.4±10, 52.6±7, and 54.6±7 years, respectively. Isokinetic concentric and isometric torque of kneeflexors and extensors
were analyzed by an isokinetic dynamometer. Plasma testosterone and proinflammatory cytokine levels were determined by chemiluminescence and ELISA, respectively. Glycemic control was analyzed by glycated hemoglobin (HbA1C). In general, concentric and isometric torques were lower and tumor necrosis factor (TNF)-a, interleukin (IL)-6, and IL-1bplasma levels were higher in the groups with diabetes than in controls. There was no correlation between testosterone level and knee torques or proinflammatory cytokines. Concentric and isometric kneeflexion and extension torque were negatively correlated with TNF-a, IL-6, and HbA1C. IL-6 and TNF-awere positively correlated with HbA1C. The results of this study demonstrated that muscle strength was not associated with testosterone levels in men with DM2. Low muscle strength was associated with inflammatory markers and poor glycemic control.
Key words: Diabetes; Testosterone; Muscle strength; Cytokines
Introduction
Clinical and epidemiological evidence demonstrates that men with type 2 diabetes mellitus (DM2), metabolic syndrome, and obesity exhibit low plasma testosterone levels (1). Low testosterone levels are associated with metabolic and cardiovascular complications, sexual dysfunc-tion, risk of bone fracture, and reduced muscle strength (2). Around 20% of people with DM2 show a decline in testosterone levels (3) from disease onset (2). The causal interactions between obesity, metabolic syndrome, DM2, and testosterone deficiency are complex. In short, increased activity of the aromatase enzyme in adipose tissue raises estradiol levels, which inhibits the hypothalamic-pituitary-adrenal axis and prompts a decline in testicular production of testosterone. Additionally, hormones (leptin) and inflammatory
mediators such as interleukin (IL)-1, IL-6, and tumor necro-sis factor (TNF)-ain adipose tissue can also compromise testicular function (4).
Testosterone replacement therapy (TRT) can improve libido, sexual function, bone density, muscle mass preser-vation, body composition, mood, erythropoiesis, cognition, and quality of life as well as can lower the risk of cardio-vascular disease (5) in obese men with DM2 (5,6). However, the topic is controversial because TRT is associated with increased risk of prostate cancer by worsening symptoms of benign prostatic hypertrophy, liver toxicity, hyper-viscosity, erythrocytosis, severe heart failure, and cardio-vascular disease, and exacerbates untreated sleep apnea, as previously reviewed (7–9). Thus, physicians should
Correspondence: T.F. Salvini:<tania@ufscar.br>
Received February 3, 2017 | Accepted May 11, 2018
discuss symptom severity with the patients, including those resulting from loss of muscle strength, and weigh the potential risks and benefits of TRT (5,6).
Regardless of other factors, people with low testoster-one levels develop reduced muscle strength (10). This is because testosterone stimulates protein synthesis and the recruitment of satellite cells (11). Additionally, testosterone inhibits production of the inflammatory cytokines IL-1 and IL-6 (12), which are known to activate apoptosis pathways and muscle atrophy (13). However, there is no study that analyzed the muscle strength of people with DM2 and the disease relationship to plasma testosterone levels. Although some research has shown that individuals with DM2 exhibit reduced muscle strength (14), whether low testosterone levels can exacerbate loss of strength in these subjects has yet to be established. Isokinetic dynamom-etry is a safe, reliable, and reproducible method to assess joint torque, providing the strength of individuals under different types of contraction (15). In addition, knee muscle strength plays an important role in movement and quality of life.
Therefore, this study aimed to evaluate the concentric and isometric torque of knee flexion and extension in diabetic men with and without hypogonadism. The pres-ence of subclinical inflammation in DM2 and its influpres-ence on the musculoskeletal system is well known, activating pathways of apoptosis muscle atrophy (13) and reducing testicular testosterone secretion (16). As such, the present investigation analyzed participants’ plasma levels of the proinflammatory cytokines IL-1, IL-6, and TNF-a.
Given that its association with subclinical inflammation means that DM2 can affect muscle strength (17), and that hypogonadism can also affect muscle strength (18) inde-pendently of DM2, the hypothesis of the study was that knee flexion and extension strength is lower in subjects with both DM2 and hypogonadism compared to subjects with DM2 and control subjects without hypogonadism.
Material and Methods
Subjects
The participants were recruited from local healthcare units and the Endocrinology Clinic of the Federal University of São Carlos. Males aged between 18 and 65 years were included in the study. The inclusion criteria for the control group were men without DM2 (19) and with normal total testosterone levels (20), for the DnormalTT group, men with DM2 (19) and normal total testosterone levels, and for the DlowTT group, men with DM2 (19) and low total testosterone levels (20). A total of 287 subjects were inter-viewed for eligibility. The exclusion criteria were cardiac diseases, pulmonary emphysema, knee arthrosis or arthritis, a history of knee ligament or meniscus injuries, herniated discs, stroke, peripheral diabetic neuropathy (PDN), and anti-inflammatory or hormonal therapy. The 75 subjects who met the inclusion criteria were distributed into the
three groups: Control (n=20), DnormalTT (n=45), and DlowTT (n=10) (Figure 1).
The study complied with the Guidelines and Regula-tions for Research Involving Human Subjects (National Health Council Resolution 196/1996) and was approved by the university’s Research Ethics committee (protocol No. 797.125). All participants took part voluntarily and gave written informed consent.
Clinical evaluation
PDN was evaluated by a trained physical therapist using the following clinical parameters: i) typical neu-ropathy symptoms assessed by a questionnaire based on the Michigan Neuropathy Screening Instrument (21); ii) tactile sensitivity using a 10 g Semmes-Weinstein mono-filament (Sorri-Baru, Brazil) tested in four plantar areas (hallux plantar face, and the 1st, 3rd, and 5th metatarsals); and iii) vibratory perception with a 128 Hz tuning fork applied to the medial region of the hallux interphalangeal joint (21). To determine the presence of PDN, these vari-ables were processed in artificial intelligence Fuzzy Logic System software (LaBiMPH, Brazil), described in greater details in previous studies (22,23). The software combines each fuzzy set of the input variables and gives the degree of PDN between 0 and 10, classified as follows: i)o2.5 absent; ii) 2.5–5.0 mild; iii) 5.1-8.0 moderate; iv)48.0 severe (22). The degree obtained by the fuzzy model showed a very strong correlation with the expert’s assessment (Pearson’s coefficient r=0.943) and a high level of accuracy when classifying real patients analyzed with the model (ROC curve area=0.91) (22).
Anthropometric and glycemic control data
Body mass index (BMI) was calculated as follows: weight (kg) / height2(cm). The glycated hemoglobin (HbA1c) percentage is a 3-month indicator of glucose control and was measured in all participants (19).
Plasma testosterone
Total plasma testosterone level was determined by chemiluminescence (24). Data are reported in ng/dL and total testosteroneo250 ng/dL was considered low (20).
Proinflammatory cytokines
Plasma concentrations of TNF-a, IL-1b, and IL-6 were analyzed by sandwich ELISA (enzyme-linked immuno-sorbent assay) and each cytokine was tested according to the manufacturer’s instructions (25). Readings were per-formed using a 490-nm filter. The detection limits of the cytokines in the serum were 5 pg/mL for IL-1b, 2.62 pg/mL for IL-6, and 1.7 pg/mL for TNF-a. After analyses, the data were transformed and normalized by the standard curve.
Torque analysis
(Biodex, System III, USA). Concentric torque was ana-lyzed at 60°/s. The equipment was calibrated according to manufacturer’s recommendations before the assess-ments. Individuals were asked which leg they could kick a ball hardest in order to determine their dominant limb. The type of contraction testedfirst was chosen randomly using a randomization spreadsheet. Before maximal testing, submaximal familiarization sessions were conducted with 3 repetitions for each movement in the concentric mode and 2 repetitions in the isometric mode. A 1.5-min rest was allowed between modes and 3 min between familiariza-tion and the maximal test. During the test, participants remained seated in the dynamometer chair with the back-rest at 85°, trunk stabilized andfixed to the backrest using two belts with an additional pelvic belt. The axis of rotation of the dynamometer was aligned with the lateral epicon-dyle of the femur and the resistance armfixed to the distal third of the leg, just above the malleolus.
Verbal and visual encouragement was provided during all maximal voluntary contractions, always by the same evaluator. After the analyses, the text files of the tests were processed in MATLAB (version 7.0.1, MathWorks, USA) to determine the peak torque achieved by participants in the repetitions. Peak torque in N-m (newton meters) was normalized by the weight of the individual and multiplied by 100.
Statistical analysis
The Levene and the Kolmogorov-Smirnov tests were applied to determine homogeneity of variance and normal distribution, respectively. One-way ANOVA and Tukey’s post-hoc test were performed to compare the clinical and demographic characteristics of the groups, as well as concentric and isometric torque of the knee flexors and extensors. Significance was set at 5%. Effect sizes (Hedges’ g) of torque values between groups were also calculated, and considered insignificant (0.00–0.19), small (0.20–0.39), medium (0.40–0.79), or large (X0.80) (26). Kruskal-Wallis and Mann-Whitney U tests were applied to analyze the proinflammatory cytokines. For nonpara-metric comparisons, the significance level was adjusted according to the number of comparisons and set at Pp 0.016. Correlations between concentric and isometric knee flexion and extension torque, proinflammatory cytokines, and HbA1c were assessed using Pearson’s correlation coefficient (r=0.10–0.29: low correlation; r=0.30–0.49: medium correlation; r=0.50–1: high correlation) (27).
Results
group (Pp0.01); however, there was no difference in BMI between the two groups with DM2. Intergroup differences were observed for HbA1C values, but only between the groups with DM2 and the control group (Po0.01; Table 1). Peak torque was similar for all movements and both contraction types in the groups with DM2. When compared to controls, the DnormalTT group showed lower concentric and isometric knee extension torques (Po0.01) and the DlowTT exhibited lower isometric kneeflexion torque (P=0.04). Both groups with DM2 showed lower concentric kneeflexion torque than controls (Po0.02; Table 2).
TNF-a, IL-6, and IL-1b concentrations were higher in the groups with DM2 than controls (Po0.01), but no difference was found between the DnormalTT and DlowTT
groups (Table 3). HbA1c was positively correlated with IL-6 and TNF-a (r=0.55, Po0.01; r=0.59, Po0.01) and negatively correlated with concentric knee flexion and extension torque (r=–0.30, Po0.01; r=–0.24, P=0.03). Concentric and isometric kneeflexion and extension torque were negatively correlated with TNF-a (r=–0.27, Po0.01; r=–0.33, Po0.01; r=–0.35, Po0.01; r=–0.43, Po0.01, respectively, for TNF-a vs concentric kneeflexion; TNF-a vs concentric knee extension; TNF-a vs isometric knee flexion, and TNF-a vsisometric knee extension) and IL-6 (r=–0.22, P=0.03; r=–0.27, Po0.01; r=–0.38, Po0.01; r=–0.41, Po0.01, respectively, for IL-6 vs concentric kneeflexion; IL-6vsconcentric knee extension; IL-6vs iso-metric kneeflexion, and IL-6vsisometric knee extension). Table 1.Clinical characteristics of the participants.
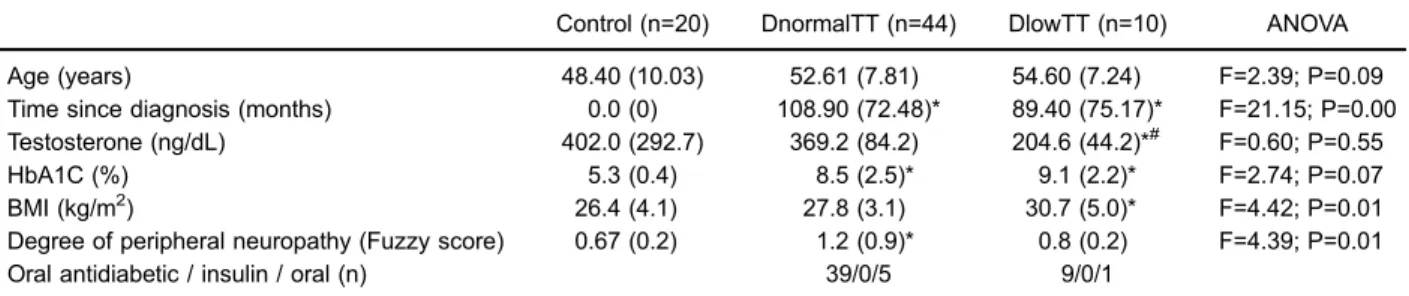
Control (n=20) DnormalTT (n=44) DlowTT (n=10) ANOVA
Age (years) 48.40 (10.03) 52.61 (7.81) 54.60 (7.24) F=2.39; P=0.09
Time since diagnosis (months) 0.0 (0) 108.90 (72.48)* 89.40 (75.17)* F=21.15; P=0.00 Testosterone (ng/dL) 402.0 (292.7) 369.2 (84.2) 204.6 (44.2)*# F=0.60; P=0.55
HbA1C (%) 5.3 (0.4) 8.5 (2.5)* 9.1 (2.2)* F=2.74; P=0.07
BMI (kg/m2) 26.4 (4.1) 27.8 (3.1) 30.7 (5.0)* F=4.42; P=0.01
Degree of peripheral neuropathy (Fuzzy score) 0.67 (0.2) 1.2 (0.9)* 0.8 (0.2) F=4.39; P=0.01
Oral antidiabetic / insulin / oral (n) 39/0/5 9/0/1
Data are reported as means±SD. DnormalTT: type 2 diabetics with normal total testosterone; DlowTT: type 2 diabetics with low total testosterone. *Po0.05 compared to controls;#Po0.05 compared to DnormalTT.
Table 2.Peak torque for the different contraction types.
Type of Contraction
Joint movement
Control (n=20)
Effect size Controlvs DnormalTT
DnormalTT (n=44)
Effect size DnormalTT vsDlowTT
DlowTT (n=10)
Effect size Controlvs DlowTT
ANOVA
Concentric Flexion 94.18 (33.87) –1.58 53.35 (21.16)* 0.59 66.67 (28.37)* 0.85 F=16.8; P=0.00 Extension 156.61 (56.50) –1.17 104.36 (37.68)* 0.74 132.98 (41.79) 0.45 F=10.0; P=0.00 Isometric Flexion 99.65 (35.77) –0.65 80.46 (25.99) –0.33 70.81 (40.73)* 0.77 F=3.73; P=0.02 Extension 218.90 (54.04) –0.81 171.95 (58.88)* 0.17 181.65 (43.10) 0.73 F=4.89; P=0.01
Peak torque is reported as means±SD (N.m/kg100). DnormalTT: type 2 diabetics with normal total testosterone; DlowTT: type 2
diabetics with low total testosterone. Effect size: insignificant (0.00–0.19), small (0.20–039), medium (0.40–0.79), large (X0.80). *Po0.05 compared to controls.
Table 3.Comparison of inflammatory markers tumor necrosis factor (TNF-a), interleukin- 6 (IL-6), interleukin 1- beta (IL-1b).
Control (n=20) DnormalTT (n=44) DlowTT (n=10) Kruskal-Wallis test
TNFa(pg/mL) 0.71 (0.71–0.71) 0.74 (0.71–1.00)* 1.00 (0.74–1.00)* H=46.2; Po0.01 IL-6 (pg/mL) 0.50 (0.51–0.51) 0.73 (0.51–0.83)* 0.73 (0.73–0.83)* H=45.0; Po0.01 IL-1b(pg/mL) 0.87 (0.87–0.87) 0.90 (0.84–0.90)* 0.90 (0.84–0.90)* H=14.0; Po0.01
There was no correlation between testosterone level and knee torques, or proinflammatory cytokines, considering all groups.
Discussion
The results of the present study showed reduced isometric and concentric torque in individuals with DM2 regardless of testosterone levels and their association with high IL-6 and TNF-aconcentrations. Thesefindings were consistent with the important pathophysiological role of inflammation in reducing muscle strength.
With respect to decreased muscle strength in individ-uals with DM2, our results confirmed thefindings of previous studies showing that individuals with diabetes have lower skeletal muscle strength than those without diabetes (28,29). The mechanism of muscle strength decline in DM2 subjects is not well defined. In the present study, clinical neuropathy was excluded, but subclinical neuropathy could not be excluded.
We hypothesized that low testosterone levels would negatively influence decreased muscle strength in individ-uals with DM2. However, both diabetic groups (normal and low testosterone subgroup) exhibited lower muscle strength than control subjects and there was no correlation between testosterone levels and muscle strength. Testos-terone administration has been associated with increased muscle strength. However, previous studies (10,30) that examined the correlation between endogenous testoster-one and muscle strength have been inconclusive, possibly because circulating testosterone levels may not directly or linearly reflect its biological action on target tissues.
Mechanistically, the interaction between low muscle strength and high HbA1c may be explained by the effect of hyperglycemia on skeletal muscle mitochondrial dysfunc-tion, protein degradadysfunc-tion, and autophagy pathways (31,32), as well as the accumulation of advanced glycation products and oxidative stress (33).
Another potential mechanism for decreased muscle strength in individuals with DM2 is the rise in inflammatory cytokine levels. In the present study, the inflammatory markers TNF-a, IL-6, and IL-1b concentrations were higher in both groups with DM2 than in controls. It has
been previously demonstrated that increased plasma concentration of inflammatory cytokines may cause loss of strength in these individuals (13,34). Inflammatory cyto-kines may lead to the inhibition of skeletal muscle protein synthesis and myoblast differentiation by activating MAFbx/ atrogin-1, eIF3-f, MyoD, and MuRf1 (35–37). In addition, it has been reported that increased TNF-alevels may acti-vate the caspase pathway, leading to skeletal muscle atrophy due to enzymatic fragmentation of muscle DNA (38,33).
In conclusion, the results of this study demonstrated that muscle strength was lower in individuals with DM2 and was not associated with low total testosterone levels. Our results also indicated that reduced muscle strength in subjects with DM2 subjects could be associated with an increase in the inflammatory cytokines IL-6 and TNF-a and poor glycemic control. However, further studies are needed to clarify this association.
As limitations, the DlowTT group was a very small sample and despite the number of individuals interviewed, only 10 individuals with DM2 and low testosterone met the eligibility criteria of the study. Given the sample size eval-uated in the DlowTT group, one-way ANOVA as the statis-tical design, and an alpha error of 5%, the statisstatis-tical power (1– b) obtained using a small effect size was 0.70. We also calculated the sample size using a power of 0.93 and medium effect size (0.45). For future studies, we recom-mend using a sample size of 75 individuals equally distrib-uted among groups. In addition, it would be interesting for future studies to analyze the association between strength and low testosterone level with the quality of life and physical activity level of these individuals.
Acknowledgments
This study was supported by Fundac¸ão de Amparo à
Pesquisa do Estado de São Paulo (FAPESP, Process No. 2011/22122-5) and Conselho Nacional de Desenvolvi-mento Científico e Tecnológico (CNPq). T.F. Salvini, I.C.N. Sacco, and C.D. Sartor are funded by CNPq (Process Nos. 3013442013-2, 305606/2014-0, and 151531/2013-7, respectively). J.S.P. Ferreira received a PhD scholarship from the Coordenac¸ão de Aperfeic¸oamento de Pessoal
de Nível Superior (CAPES) (Process No. 1662695).
References
1. Grossmann M. Low testosterone in men with type 2 diabetes: significance and treatment.J Clin Endocrinol Metab2011; 96: 2341–2353, doi: 10.1210/jc.2011-0118.
2. Cheung KKT, Luk AOY, So WY, Ma RCW, Kong APS, Chow FCC, et al. Testosterone level in men with type 2 diabetes mellitus and related metabolic effects: A review of current evidence.J Diabets Investig2015; 6: 112–123, doi: 10.1111/ jdi.12288.
3. Al Hayek AA, Robert AA, Alshammari G, Hakami H, Al Dawish MA. Assessment of hypogonadism in men with type 2 diabetes:
a cross-sectional study from Saudi Arabia.Clin Med Insights Endocrinol Diabetes2017; 10: 1179551417710209.
6. Seftel AD, Kathrins M, Niederberger C. Critical update of the 2010 endocrine society clinical practice guidelines for male hypogonadism a systematic analysis.Mayo Clinic Proc 2015; 90: 1104–1115, doi: 10.1016/j.mayocp.2015.06.002. 7. Michaud JE, Billups KL, Partin AW. Testosterone and
prostate cancer: an evidence-based review of pathogenesis and oncologic risk.Ther Adv Urol2015; 7: 378–387, doi: 10.1177/1756287215597633.
8. Onasanya O, Iyer G, Lucas E, Lin D, Singh S, Alexander GC. Association between exogenous testosterone and cardio-vascular events: an overview of systematic reviews. Lancet Diabetes Endocrinol2016; 4: 943–956, doi: 10.1016/S2213-8587(16)30215-7.
9. Allan C a, Strauss BJG, McLachlan RI. Body composition, metabolic syndrome and testosterone in ageing men.Int J Impot Res. 2007; 19: 448–457, doi: 10.1038/sj.ijir.3901552. 10. Auyeung TW, Lee JSW, Kwok T, Leung J, Ohlsson C, Vandenput L, et al. Testosterone but not estradiol level is positively related to muscle strength and physical perfor-mance independent of muscle mass: A cross-sectional study in 1489 older men.Euro J Endocrinol 2011; 164: 811–817, doi: 10.1530/EJE-10-0952.
11. Sinha-hikim I, Roth SM, Lee MI, Bhasin S. Testosterone-induced muscle hypertrophy is associated with an increase in satellite cell number in healthy, young men.Am J Physiol Endocrinol Metab 2003; 285: E197–E205, doi: 10.1152/ ajpendo.00370.2002.
12. Malkin CJ, Pugh PJ, Jones RD, Kapoor D, Channer KS, Jones TH. The Effect of Testosterone Replacement on Endo-genous Inflammatory Cytokines and Lipid Profiles in Hypo-gonadal Men.J Clin Endocrinol Metab2004; 89: 3313–3318, doi: 10.1210/jc.2003-031069.
13. Visser M, Pahor M, Taaffe DR, Goodpaster BH, Simonsick EM, Newman AB, et al. Relationship of interleukin-6 and tumor necrosis factor-alpha with muscle mass and muscle strength in elderly men and women: the Health ABC Study. J Gerontol A Biol Sci Med Sci 2002; 57: M326–M332, doi: 10.1093/gerona/57.5.M326.
14. Ferreira JP, Sartor CD, Leal AM, Sacco IC, Sato TO, Ribeiro IL, et al. The effect of peripheral neuropathy on lower limb muscle strength in diabetic individuals.Clin Biomech2017; 43: 67–73, doi: 10.1016/j.clinbiomech.2017.02.003. 15. de Carvalho Froufe Andrade AC, Caserotti P, de Carvalho
CM, de Azevedo Abade EA, da Eira Sampaio AJ. Reliability of concentric, eccentric and isometric knee extension and flexion when using the REV9000 Isokinetic Dynamometer. J Hum Kinet2013; 37: 47–53.
16. Bornstein S, Rutkowski H, Vrezas I. Cytokines and steroido-genesis.Mol Cel Endocrinol2004; 215: 135–141, doi: 10.1016/ j.mce.2003.11.022.
17. Park S, Goodpaster B, Strotmeyer E, Kuller L, Broudeau R, Kammerer C, et al. Accelerated loss of skeletal muscle strength in older adults with type 2 diabetes the health, aging, and body composition study. Diabetes Care 2007; 30: 1507–1512, doi: 10.2337/dc06-2537.
18. Schaap LA, Pluijm SMF, Deeg DJH, Penninx BW, Nicklas BJ, Lips P, et al. Low testosterone levels and decline in physical performance and muscle strength in older men: findings from two prospective cohort studies.Clin Endo-crinol 2008; 68: 42–50, doi: 10.1111/j.1365-2265.2007. 02997.x.
19. American Diabetes Association. Standards of medical care in diabetes. In: Diabetes by region [Internet]. 2014. p. 86–89. Available from: http://www.cabi.org/cabebooks/ebook/20073 012958
20. Bhasin S, Cunningham GR, Hayes FJ, Matsumoto AM, Snyder PJ, Swerdloff RS, et al. Testosterone therapy in men with androgen deficiency syndromes: An endocrine society clinical practice guideline.J Clin Endocrinol Metab2010; 95: 2536–2559, doi: 10.1210/jc.2009-2354.
21. Bakker K, Apelqvist J, Schaper NC. Practical guidelines on the management and prevention of the diabetic foot 2011. Diabetes Metab Res Rev2012; 28: 225–231, doi: 10.1002/ dmrr.2253.
22. Watari R, Sartor CD, Picon AP, Butugan MK, Amorim CF, Ortega NRS, et al. Effect of diabetic neuropathy severity classified by a fuzzy model in muscle dynamics during gait. J Neuroeng Rehab2014; 11: 11, doi: 10.1186/1743-0003-11-11. 23. Picon AP, Ortega NRS, Watari R, Sartor C, Sacco ICN. Classification of the severity of diabetic neuropathy: a new approach taking uncertainties into account using fuzzy logic. Clinics(São Paulo) 2012; 67: 151–156, doi: 10.6061/clinics/ 2012(02)10.
24. Furuyama S, Mayes DM; Nugentc CA. A radioimmuno-assay for plasma testosterone.Steroids1970; 16: 415–428, doi: 10.1016/S0039-128X(70)80124-6.
25. Research Reagents and Assays / Immunoassays / ELISA / ELISA Kits Instruction Manual BD OptEIAä[Internet]. Avail-able from: http://www.bdbiosciences.com/nvCategory.jsp?action= SELECT&form=formTree_catBean&item=745107
26. Cohen J. Statistical power analysis for the behavioral sciences [Internet]. Academic Press; 1977 [cited 2017 Mar 23]. 474 p. Available from: http://www.sciencedirect.com/science/book/ 9780121790608
27. Stigler SM. Francis Galton’s Account of the Invention of Cor-relation.Statistical Science1989; 4: 73–79, doi: 10.1214/ss/ 1177012580.
28. Hatef B, Bahrpeyma F, Mohajeri Tehrani MR. The comparison of muscle strength and short-term endurance in the different periods of type 2 diabetes.J Diabetes Metabc Disord2014; 13: 22, doi: 10.1186/2251-6581-13-22.
29. Andreassen CS, Jensen JM, Jakobsen J, Ulhøj BP, Andersen H. Striated musclefiber size, composition, and capillary density in diabetes in relation to neuropathy and muscle strength. J Diabetes. 2014; 6: 462–471, doi: 10.1111/1753-0407.12124. 30. Roy TA, Blackman MR, Harman SM, Tobin JD, Schrager M,
Metter EJ. Interrelationships of serum testosterone and free testosterone index with FFM and strength in aging men. Am J Physiol Endocrinol Metab 2002; 283: E284–E294, doi: 10.1152/ajpendo.00334.2001.
31. Wang X, Hu Z, Hu J, Du J, Mitch WE. Insulin resistance accelerates muscle protein degradation: Activation of the ubiquitin-proteasome pathway by defects in muscle cell signaling.Endocrinology2006; 147: 4160–4168, doi: 10.1210/ en.2006-0251.
32. Kelley DE, He J, Menshikova E V, Ritov VB. Dysfunction of mitochondria in human skeletal muscle in type 2 diabetes. Diabetes2002;51: 2944–2950, doi: 10.2337/diabetes.51. 10.2944.
34. Cesari M, Penninx BW, Pahor M, Lauretani F, Corsi AM, Rhys Williams G, et al. Inflammatory markers and physical performance in older persons: the InCHIANTI study. J Gerontol A Biol Sci Med Sci 2004; 59: 242–248, doi: 10.1093/gerona/59.3.M242.
35. Powers SK, Kavazis AN, Mcclung JM. Free radical biology in skeletal muscle. Oxidative stress and disuse muscle atrophy.J Appl Physiol2007; 102: 2389–2397, doi: 10.1152/ japplphysiol.01202.2006.
36. Glass DJ. Skeletal muscle hypertrophy and atrophy signal-ing pathways.Int J Biochem Cell Biol2005; 37: 1974–1984, doi: 10.1016/j.biocel.2005.04.018.