1 University of L’Aquila, Department of Biotechnological and Applied Clinical Sciences (L’Aquila, Italy).
2 Aarhus University, Faculty of Health, Department of Dentistry and Oral Health, Section of Orthodontics (Aarhus, Denmark).
» The authors report no commercial, proprietary or financial interest in the products or companies described in this article.
Submitted: June 01, 2017 - Revised and accepted: March 19, 2018
Correlation between tooth size-arch length discrepancy and
interradicular distances measured on CBCT and panoramic
radiograph: an evaluation for miniscrew insertion
Michele Tepedino1, Marie A. Cornelis2, Claudio Chimenti1, Paolo M. Cattaneo2
Introduction: The selection of appropriate sites for miniscrew insertion is critical for clinical success. Objectives: The aim of the
present study was to evaluate how interradicular spaces measured on panoramic radiograph compare with Cone-Beam Computed Tomography (CBCT), and how crowding can influence the presence of available space for miniscrew insertion, in order to define a new “safe zones” map. Methods: A total of 80 pre-treatment panoramic radiographs and 80 CBCT scans with corresponding
digital models were selected from the archives of the department of Dentistry, Aarhus University. Crowding was measured on digital models, while interradicular spaces mesial to the second molars were measured on panoramic radiographs and CBCTs. For panoramic radiographs, a magnification factor was calculated using tooth widths measured on digital models. Statistical analy-ses were performed to investigate the correlation between the amount of crowding and the available interradicular space. Visual maps showing the amount of interradicular spaces measured were drawn. Results: The most convenient interradicular spaces are
those between the second molar and the first premolar in the mandible, and between the central incisors in the maxilla. However, some spaces were revealed to be influenced by crowding. Conclusions: Calibration of panoramic radiographs is of utmost
im-portance. Generally, panoramic radiographs underestimate the available space. Preliminary assessment of miniscrew insertion fea-sibility and the related selection of required radiographs can be facilitated using the new “safe zone” maps presented in this article.
Keywords: Orthodontics. Orthodontic anchorage procedures. Orthodontic miniscrew. CBCT. Safe zones. DOI: https://doi.org/10.1590/2177-6709.23.5.39.e1-13.onl
How to cite: Tepedino M, Cornelis MA, Chimenti C, Cattaneo PM. Correla-tion between tooth size-arch length discrepancy and interradicular distances mea-sured on CBCT and panoramic radiograph: an evaluation for miniscrew insertion. Dental Press J Orthod. 2018 Sept-Oct;23(5):39.e1-13.
DOI: https://doi.org/10.1590/2177-6709.23.5.39.e1-13.onl
Contact address: Paolo M. Cattaneo
Vennelyst Boulevard 9, DK-8000 Aarhus C, Denmark E-mail: paolo.cattaneo@dent.au.dk
Introdução: a seleção de locais apropriados para a inserção de mini-implantes é crítica para o sucesso clínico. Objetivo: os
ob-jetivos do presente estudo foram avaliar as medições de espaços inter-radiculares feitas em radiografias panorâmicas e compará-las com as medições feitas com tomografia computadorizada de feixe cônico (TCFC), além de avaliar como o apinhamento pode influenciar na disponibilidade de espaços para inserção dos mini-implantes, no intuito de definir um novo mapa de “áreas seguras”.
Métodos: foram selecionadas, nos arquivos do departamento de Ortodontia da Aarhus University, 80 radiografias panorâmicas
pré--tratamento e 80 imagens de TCFC com os modelos digitais correspondentes. O apinhamento foi medido nos modelos digitais, enquanto os espaços inter-radiculares mesiais aos segundos molares foram medidos nas radiografias panorâmicas e na TCFC. O fator de magnificação das radiografias panorâmicas foi calculado utilizando-se as larguras dentárias medidas nos modelos digitais. Análises estatísticas foram realizadas para investigar a correlação entre a quantidade de apinhamento e o espaço inter-radicular dis-ponível. Foram desenhados mapas visuais mostrando a quantidade dos espaços inter-radiculares medidos. Resultados: os espaços
inter-radiculares mais adequados são aqueles entre o segundo molar e o primeiro pré-molar inferior, e entre os incisivos centrais superiores. Porém, verificou-se que alguns espaços são influenciados pelo apinhamento. Conclusões: A calibração das radiografias
panorâmicas é de suma importância, pois, geralmente, as radiografias panorâmicas subestimam o espaço disponível. A avaliação preliminar da viabilidade de inserção dos mini-implantes e a seleção das radiografias necessárias para isso podem ser facilitadas utilizando-se os novos mapas de “áreas seguras” aqui apresentados.
INTRODUCTION
Orthodontic miniscrews are devices specifically de-signed to be temporarily inserted into the alveolar bone to
enhance anchorage.1 They are commonly used when
pa-tient compliance is an issue, when the number of teeth does not allow appropriate anchorage, or when teeth are
peri-odontally compromised.2 The success rate of orthodontic
miniscrew insertion is reported to be between 61% and
100%,3,4 being affected by many factors;1,3-7 and root
prox-imity appears to play an important role.8 The choice of
ap-propriate insertion site is critical: it is important to place the miniscrew in a site that is convenient from a biome-chanical point of view, and to do so without damaging any surrounding periodontal structures (dental roots, maxil-lary sinus, nerves) during the insertion procedure. Many authors have defined maps of “safe zones” for miniscrew insertion; a few studies were conducted on panoramic
ra-diographs,9,10 whilst the majority used Cone Beam
Com-puted Tomography (CBCT) to determine the “quality”
and suitability of different insertion sites.11-20 The former
are affected by horizontal and vertical magnifications21-24
typically caused by the patient’s positioning, tooth angula-tions and root posiangula-tions, and degrees of asymmetries within
and between the jaws.9,21,25 Still, they represent a simple,
low-cost and low-dose radiographic examination routinely
prescribed to orthodontic patients.26 CBCTs, on the other
hand, represent the gold standard in 3D radiographic imag-ing due to a relatively low radiation dose and high-quality images, which provide more realistic images than 2D
im-ages.27 However, according to previous studies, there is little
consensus regarding how much information CBCTs can provide over conventional radiographs, and in which cases
increased radiation exposure can be justified.27-32
Schnelle et al.9 investigated the presence of 3 and
4 mm of space between two adjacent roots on panoramic radiographs in order to define a map of interradicular sites where a miniscrew could be safely placed. This amount of space was chosen as a typical miniscrew diameter is between 1.2 and 2 mm, and there must be at least 1 mm of bone surrounding the miniscrew to avoid root dam-age during insertion. Other authors measured the space between the roots at different heights on panoramic
ra-diographs10 or CBCTs.13,14,16,18,20,33 A systematic review of
the available literature concluded that ideal sites for orth-odontic miniscrew placement, defined by appropriate quantity and quality of bone, are the buccal and lingual interradicular spaces between the second premolar and
the second molar, both in the maxilla and the mandible.11
Another possible parameter for identifying miniscrew insertion sites is dental crowding. Different malocclusions show differences in bone availability between the roots due
to dentoalveolar compensation of skeletal discrepancies.12
Moreover, Schnelle et al9 found increased interradicular
space for miniscrew insertion after tooth alignment, com-pared with before treatment. However, it has not previously been demonstrated whether there is any correlation between the amount of interradicular space and dental crowding.
Landin et al35 compared the percentage of
minis-crews placed without damaging surrounding structures by blind insertion with having either a pre-operative periapical radiograph, a panoramic radiograph or a small-volume CBCT. Interestingly, blind placement, periapical radiograph and panoramic radiograph per-formed almost the same, suggesting that pre-operative 2D radiographic images give no significant advantage. On the other hand, three-dimensional information pro-vided by CBCT was significantly more useful, though at the cost of an increased ionizing radiation dose.
A miniscrew insertion site evaluation method that would minimize or even discard the use of ionizing ra-diation would be very advantageous for both clinicians and patients in light of the ALARA (As Low As Reasonably Achievable) principle. For this reason, the present paper ad-dresses the following question: Is there a way of increasing the amount of information extrapolated from a traditional radiograph by combining it with specific clinical observa-tions to ensure safe miniscrew placement at low radiation cost? The goal is to help the clinician from the first step of his orthodontic treatment planning, choosing the ap-propriate clinical and/or radiological examination, in order to determine the possible insertion site(s) of miniscrews.
Therefore, the aims of this study were to evaluate: 1) how the assessment of interradicular spaces on pan-oramic radiographs performs compared with CBCTs; and 2) how the presence of radiologically adequate in-terradicular spaces correlates with tooth size-arch length discrepancy, in order to define a new “safe zones” map. The hypothesis was that the amount of tooth size-arch length discrepancy can be used as a pre-treatment clini-cal tool to assess the possibility of miniscrew insertion.
MATERIAL AND METHODS
Protec-tion Agency (Aarhus University Journal no. 62908). Eighty pre-treatment panoramic radiographs (Pan-oramic group) and eighty CBCT scans (CBCT group) of patients previously treated at the Section of Orthodontics, Aarhus University were randomly selected (www.randomizer.org) from the archive ac-cording to the following inclusion criteria:
» Permanent dentition, with second molars erupted. » No agenesis or missing teeth, except for third molars.
» Patients under 35 years of age at the time of the radiographic examination.
» Absence of signs of periodontitis and/or bone resorption on the radiographic examination.
» Pre-treatment digital models available.
The radiographic records were retrieved from the ar-chive of previously treated patients; they had been taken in accordance with the radiological guidelines of the Department of Dentistry, Aarhus University.
Digital models
The digital models were imported into the O3DM®
software (Ortolab, Częstochowa, Poland), which was used for the measurements. The tooth size-arch length discrepancy (i.e. crowding) was assessed according to
the method described by Lundström.36 First, the
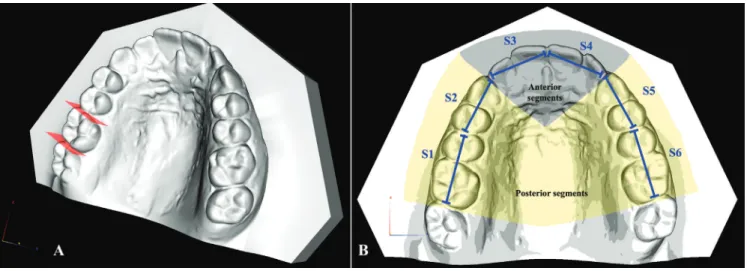
mesio-distal width of each tooth, excluding the second molars, was measured. Then, the arch was divided into six seg-ments starting from the right first molar to the left first molar, each comprising two teeth at the time (S1= right first molar and second premolar; S2= right first
premo-lar and canine; S3= right lateral and central incisors; S4= left lateral and central incisors; S5= left first premo-lar and canine; S6= left first mopremo-lar and second premopremo-lar) as shown in Figure 1. Then, the length of each segment was measured, and the sum of the relative teeth widths was calculated. Finally, the difference between the two lengths was calculated. This value was negative in cases with crowding and positive in cases with spacing.
Moreover, a value for tooth size-arch length discrep-ancy of the anterior region (from the distal contact point of the lateral incisor to the contralateral one) and two values for the left and right posterior regions (from the distal contact area of the first molar to the mesial contact point of the canine) were calculated as well.
Panoramic radiographs
To measure the interradicular spaces, a specifically designed analysis from PorDios software (PorDios for Windows, Randers, Denmark) was used. Each image was calibrated using the correct DPI. For each interra-dicular space, one operator manually placed two points at the cemento-enamel junction (CEJ) of the two ad-jacent teeth and two points at the apex of the adad-jacent roots. Then, a line connecting the two CEJ points and a line connecting the two apex points were automatically drawn together with the two midpoints of these lines; a third line (midpoint line) connecting these midpoints was then drawn. Two lines were automatically gener-ated perpendicular to the midpoint line, dividing the latter into three equal parts. The interradicular distance was measured along these two lines (i.e. at 1/3 and 2/3
of the root length) (Fig 2). This procedure was repeated for each interradicular space, starting from the mesial aspect of the second molars.
To account for the intrinsic horizontal magnification of the panoramic radiographs, the mesiodistal width of all first molars, first premolars and central incisors was measured both on the panoramic radiographs and on the digital models, to calculate three “magnification factors”: the magnification factor calculated for each first molar was used to adjust the measurement of the interradicular spaces mesial and distal to that first molar; the factor calculated for the first premolar was used for the interradicular spaces mesial and distal to that first premolar; the factor of the central incisor was used for all the interradicular spaces mesial to the canine.
The vertical magnification, also present on the pan-oramic radiographs, was judged to be negligible since a ratio and not a linear measurement was used to divide the vertical height (1/3 and 2/3) used for the horizontal measurements.
CBCT
The volumetric data obtained from the NewTom 5G CBCT scanner (QR, Verona, Italy; scan protocol: voxel size 0.3 mm, scanning time 18s, emission time 2.4s, 110kV) were opened with the NNT software (NNT v. 4.6, QR, Verona, Italy) and used to generate custom images. First, the data-set was oriented parallel to the occlusal plane in both the sagittal and the transversal directions; then, us-ing the “broken line” function with a thickness of 9 mm, a panoramic-like image was generated putting a point at the center of each tooth, likely at half the length of the root.
Two panoramic-like images (one for the maxilla and one for the mandible) were created, with straight segments be-tween each tooth, to avoid distortions and to ensure the repeatability of the measurements.
The panoramic-like images that were created in this way were imported into the PorDios software, and the same protocol as described before was applied to mea-sure the interradicular spaces.
The data averaged from the panoramic radiographs and CBCTs were used to define two visual maps of the interradicular spaces. In accordance with the
lit-erature,9,20 an interradicular space equal to or
exceed-ing 3.0 mm was considered a “safe zone” for miniscrew placement, whilst an interradicular space of less than 1.6 mm was judged to be unsuitable since it is equal to
the diameter of an average miniscrew.18
Interradicu-lar spaces measuring less than 3.0 mm but more than 1.6 mm were considered borderline zones, where care-ful evaluation is needed.
Error of the method
To evaluate the error of the method, 30 panoramic radiographs, 30 CBCTs and 30 digital models were ran-domly selected from the whole sample using an online tool (www.randomizer.org), and the measurements were repeated by the same operator after at least one week.
For all measurements, Dahlberg’s formula (s = √ (∑d2)/2n,
where d= difference between the first and second mea-surements) was used to calculate the standard error on the repeated sets of measurements. Bland-Altman plots were used to check for the intra-observer reliability
be-tween the two sets of measurements.37
Statistical analysis
A Shapiro-Wilk normality test was performed for each variable to assess whether the data were normally distributed. Depending on whether the data were nor-mally distributed or not, independent sample T-tests or Mann-Whitney tests were applied to evaluate whether a statistically significant difference between the same variable from the left and right sides was present. If no statistically significant difference was found, the data from the left and the right sides were pooled.
The amount of crowding between the Panoramic group and the CBCT group was compared using the same tests as described above.
To assess whether a correlation between the width of interradicular spaces and tooth size-arch length dis-crepancy exists, a Pearson correlation (if both variables tested were normally distributed) or a Kendall’s tau test (if one or both variables tested were not-normally dis-tributed) was then performed. The significance level for all tests was set at 0.05.
RESULTS
The mean age was 16 ± 5.2 years (min = 10, max = 34) for the Panoramic group, and 19 ± 6.1 years (min = 11, max = 34) for the CBCT group. The former included 29 males and 51 females, the latter 30 males and 50 females.
Error of the method
The average error of the method for measuring tooth size-arch length discrepancy of the individual segments was between 0.18 mm and 0.27 mm in the maxilla and between 0.19 mm and 0.25 mm in the mandible; whilst for the measurement of whole arch tooth size-arch length discrepancy, the error was 0.52 mm for the max-illa and 0.5 mm for the mandible. The average error of the method in measuring interradicular spaces on pan-oramic radiographs was 0.28 mm (range 0.20–0.34 mm) in the maxilla and 0.48 mm (range 0.32–0.56 mm) in the mandible. The average error of the method in mea-suring interradicular spaces on CBCTs was 0.30 mm (range 0.21–0.49 mm) in the maxilla and 0.24 mm (range 0.15–0.34 mm) in the mandible. The Bland-Alt-man plots showed no systematic errors.
Digital models
In the maxilla, all data were normally distrib-uted, except for tooth size-arch length discrepancy of
the posterior right and left segments for patients from both CBCT and Panoramic groups. In the mandible, all data were not normally distributed, except for tooth size-arch length discrepancy of the left posterior seg-ment for the CBCT group.
The measurements of the left and right posterior segments were pooled since no statistically significant differences were found between the two sides both in the mandible and in the maxilla.
Regarding maxillary tooth size-arch length discrep-ancy, no statistically significant differences were found between the Panoramic and the CBCT groups for the entire arch and all the individual segments; the same applied for the mandibular entire arch and posterior segments (Table 1). On the other hand, a statistically
significant difference (p = 0.02) in anterior mandibular
tooth size-arch length discrepancy was found between the CBCT group and the Panoramic group (Table 1), with the mean difference of only 0.2 mm.
Panoramic radiographs
The magnification factors of panoramic radiographs are reported in Table 2, while the descriptive statistics for interradicular spaces on panoramic radiographs are reported in Table 3.
In the mandible, all data regarding interradicular spaces were not normally distributed, except for the interradicular spaces between first and second mo-lars at the coronal level. In the maxilla, all data were not normally distributed except for the interradicu-lar spaces between first mointerradicu-lar and second premointerradicu-lar at both the coronal and apical third, and between canine and lateral incisor at the apical third.
The comparisons between the measurements of interradicular spaces on the left and right sides were not statistically significant either in the maxilla or the mandible, except for the interradicular space between the maxillary first and second premolars at the apical third level. However, since this difference was only 0.32 mm, and thus smaller than the measured error of the method (0.34 mm), it was decided to pool the data from the left and right sides for further analysis.
found at the coronal and apical thirds between the sec-ond and first molars, between the first molar and secsec-ond premolar, and between the second and first premolars at the apical thirds (Table 3).
In the maxilla, a statistically significant positive cor-relation was found between the tooth size-arch length discrepancy and the presence of interradicular space be-tween the canine and lateral incisor at the coronal and apical thirds, and between the lateral and central incisors at the coronal third (Table 4). In the mandible, the only statistically positive correlation between tooth size-arch length discrepancy and availability of space was found for the space between the central incisors at the coronal third level (Table 4).
CBCTs
Descriptive statistics for interradicular spaces measured on CBCT images are reported in Table 5. In the max-illa, all data were normally distributed, except for the in-terradicular spaces between the second and first molars at
both the coronal and apical third, between first molar and second premolar at the coronal third, between second and first premolars at the coronal third, between canine and lateral incisor at the coronal third, between the lateral and central incisors at both the coronal and apical third, and be-tween the two central incisors at both the coronal and api-cal third. In the mandible, all data regarding interradicular space measurements were normally distributed, except for the measurements between the central and lateral incisors at both the coronal and apical third, between the central incisors at both the coronal and apical third levels, and be-tween the first and second molars at the apical third.
No differences between the interradicular spaces in the left and right sides in the maxilla as well as the man-dible were statistically significant, except for the spaces between the maxillary second and first molars; however, since this difference was only 0.3 mm, a value lying in the same range of both the error of the method and of the voxel dimension, it was considered negligible, and all data from the left and right sides were therefore pooled.
Panoramic group CBCT group
Mean ± SD Max Min Mean ± SD Max Min p value
Maxilla
Posterior crowding -0.8 ± 1.5 2.4 -6,7 -0.8 ± 1.5 2,2 -7,3 0.521*
Anterior crowding -1.1 ± 1.1 2.6 -4,1 -0.8 ± 1.1 2,4 -4,0 0.062**
Total crowding of the arch -3.7 ± 3.6 4.9 -10,8 -3.4 ± 3.6 6,1 -15,5 0.552**
Mandible
Posterior crowding -1.0 ± 1.3 1,7 -6,4 -1.0 ± 1.3 2,4 -7,3 0.794*
Anterior crowding -0.6 ± 0.9 2,7 -2,9 -0.4 ± 1.0 3,9 -4,7 0.022*
Total crowding of the arch -3.1 ± 3.4 5,8 -11,0 -2.7 ± 3.2 7,3 -9,4 0.397**
Table 1 - Descriptive statistics for tooth size-arch length discrepancy (millimeters).
*Mann-Withney U-test; **Independent sample t-test.
Table 2 - Magnification on panoramic radiographs assessed by comparison with digital models (mean ± SD expressed in %).
Table 3 - Comparison between measurements on panoramic radiographs with or without calibration through dental casts (mean ± SD in millimeters).
* 3 mm or more of interradicular space; 7_6 = interradicular space between second and first molars; 6_5 = interradicular space between first molar and second premolar; 5_4 = interradicular space between second and first premolars; 4_3 = interradicular space between first premolar and canine; 3_2 = interradicular space between canine and lateral incisor; 2_1 = interradicular space between lateral and central incisors; 1_1 = interradicular space between the central incisors.
Right first molar Right first premolar Right central incisor Left first premolar Left first molar
Maxilla 27 ± 15 22 ± 16 9 ± 12 25 ± 16 32 ± 16
Mandible 33 ± 17 19 ± 14 19 ± 14 24 ± 15 36 ± 15
7_6 6_5 5_4 4_3
Coronal 3rd Apical 3rd Coronal 3rd Apical 3rd Coronal 3rd Apical 3rd Coronal 3rd Apical 3rd
Maxilla Not calibrated 1.5 ± 0.9 1.0 ± 1.2 2.5 ± 1.0 3.6 ± 1.4* 1.1 ± 0.9 1.7 ± 1.2 0.5 ± 0.7 1.6 ± 1.2 Calibrated 1.1 ± 0.7 0.8 ± 0.9 1.9 ± 0.8 2.8 ± 1.1 0.9 ± 0.7 1.3 ± 0.9 0.4 ± 0.7 1.3 ± 1.1
Table 4 - Correlation between tooth size-arch length discrepancy and interradicular spaces on panoramic radiographs
*p<0.05; ** p<0.01; 7_6 = interradicular space between second and first molars; 6_5 = interradicular space between first molar and second premolar; 5_4 = interradicular space between second and first premolars; 4_3 = interradicular space between first premolar and canine; 3_2 = interradicular space between canine and lateral incisor; 2_1 = interradicular space between lateral and central incisors; 1_1 = interradicular space between the central incisors.
7_6 6_5 5_4 4_3 3_2 2_1 1_1
Maxilla Coronal third 0.000 -0.001 0.065 0.107 0.281** 0.180* 0.028
Apical third 0.049 0.024 0.105 0.038 0.249** -0.055 0.065
Mandible Coronal third -0.011 0.025 0.063 0.039 -0.102 0.147 0.169*
Apical third -0.027 0.001 0.019 0.044 -0.058 0.066 0.049
In the maxilla, an interradicular space exceeding 3 mm was present only between the two central inci-sors at the apical third. In the mandible, an interra-dicular space exceeding 3 mm was found at the apical third between the first and second molars as well as between the first molar and second premolar, and at both the apical and coronal levels between the first and second premolars (Table 5).
In the maxilla, a statistically significant positive cor-relation between tooth size-arch length discrepancy and interradicular space was detected both at the apical and coronal thirds between the first and second premolars, as well as between the canine and lateral incisor, and at the coronal third between the two central incisors. Fur-thermore, a statistically significant negative correlation was detected for anterior tooth size-arch length
discrep-ancy and interradicular space between the central and lateral incisors at the apical third (Table 6).
In the mandible, a statistically significant positive cor-relation between tooth size-arch length discrepancy and interradicular space was detected at the coronal and api-cal thirds between the first molar and second premolar, as well as between the second and first premolars; at the coronal third between the first premolar and canine, and between the two central incisors at the coronal third. In addition, a statistically significant negative correlation was detected for anterior tooth size-arch length discrep-ancy and interradicular space between the central and lateral incisors at the apical third (Table 6).
All interradicular space measurements from pan-oramic radiographs and CBCTs and correlations are presented graphically in figures (Figs 3 and 4).
Table 5 - Descriptive statistics for interradicular spaces on CBCTs (mean ± SD in millimeters).
Table 6 - Correlation between tooth size-arch length discrepancy and interradicular spaces on CBCTs.
* 3.0 mm or more of interradicular space; 7_6 = interradicular space between second and first molars; 6_5 = interradicular space between first molar and second pre-molar; 5_4 = interradicular space between second and first premolars; 4_3 = interradicular space between first premolar and canine; 3_2 = interradicular space between canine and lateral incisor; 2_1 = interradicular space between lateral and central incisors; 1_1 = interradicular space between the central incisors.
*p<0.05; ** p<0.01; 7_6 = interradicular space between second and first molars; 6_5 = interradicular space between first molar and second premolar; 5_4 = interradicular space between second and first premolars; 4_3 = interradicular space between first premolar and canine; 3_2 = interradicular space between canine and lateral incisor; 2_1 = interradicular space between lateral and central incisors; 1_1 = interradicular space between the central incisors.
7_6 6_5 5_4 4_3 3_2
Coronal 3rd Apical 3rd Coronal 3rd Apical 3rd Coronal 3rd Apical 3rd Coronal 3rd Apical 3rd Coronal 3rd Apical 3rd
Maxilla 1.1 ± 0.6 1.0 ± 0.7 2.0 ± 0.6 2.1 ± 1 2.0 ± 0.7 2.1 ± 1 1.7 ± 0.7 2.1 ± 0.9 1.8 ± 0.6 2.8 ± 1.2
Mandible 2.7 ± 0.8 3.3 ± 1.3* 2.9 ± 0.7 3.7 ± 1.1* 3.0 ± 0.9* 4.1 ± 1.3* 1.9 ± 0.7 2.6 ± 1.0 1.5 ± 0.5 2.3 ± 1.0
7_6 6_5 5_4 4_3 3_2 2_1 1_1
Maxilla Coronal 3rd 0.018 0.088 0.162** 0.013 0.359** -0.002 0.162*
Apical 3rd 0.096 0.097 0.192** -0.054 0.246** -0.184* 0.102
Mandible Coronal 3rd 0.074 0.258** 0.290** 0.175* -0.016 0.029 0.170**
Figure 3 - Mapping of interradicular spaces.
Each interradicular space is divided by a line into two parts (corresponding to the coronal third and apical third measurements), and a color is assigned for each depending on the number of millimeters of space found. Green = 3.0 mm or more; yellow = equal to or more than 1.6 mm; red = less than 1.6 mm. (A) Mapping of interradicular spaces on panoramic radiograph; (B) Mapping of interradicular spaces on CBCT.
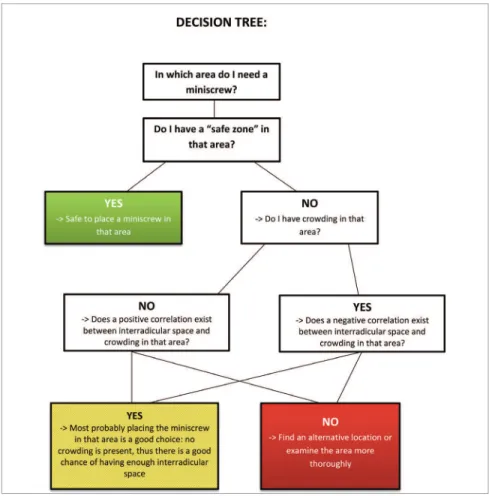
Figure 5 - Decision tree to be used together with the map in Figure 4, to help clinicians evaluate the possibility of miniscrew insertion from the outset of orthodontic treatment planning.
DISCUSSION
The main aim of the present study was to assess the amount of mesiodistal interradicular space between adjacent roots for miniscrew insertion and to correlate these findings with the presence or absence of crowd-ing, in order to develop a simple clinical diagnostic tool for preliminary planning of miniscrew placement. Overall, the error of the method for all measurements of interradicular spaces on both panoramic radiographs and CBCT was small and clinically non-relevant, with the Bland-Altman plots confirming good reliabil-ity of the measurements. The measurements of tooth size-arch length discrepancy also showed a small mea-surement error, confirming that digital models are a reliable method for assessing the presence of crowding
and/or spacing in the arch.38
The horizontal magnification of the panoramic ra-diographs was overcome using a calibration method that involved digital models. Magnification assessed on pan-oramic radiographs was greatest in the lower molar re-gion, whilst the smallest values were found in the upper
incisors region (Table 2). These values are smaller than those reported in a previous study (from a minimum of 19% for the maxillary central incisors to a maximum of
55% for the mandibular second molars),22 but higher
than the magnification values reported by Schnelle et
al9 (from 2-6% in the anterior region to 22% in the
posterior mandible).When measuring interradicu-lar spaces on non-calibrated panoramic radiographs, a general overestimation of the available bone was found. This was in excess of 1 mm in the mandibular molar region compared with the calibrated panoramic radio-graph, which underlines the importance of calibrating digital panoramic radiographs, for example by using dental casts, when precise measurement is needed.
The studied sample (Table 1) presented crowding ranging from mild (less than 4 mm) to moderate (from 5 to 9 mm), with only a few cases showing severe (more
than 10 mm) crowding.39 Overall, baseline
interra-dicular space can therefore, indeed, be attributed to the different radiographic techniques. The lower anterior segment is an exception, as a statistically significant dif-ference in the amount of crowding could be observed. However, the difference in crowding between both groups was merely 0.2mm, which is clinically irrelevant. Obviously, a robust way of confirming this statement would be to collect simultaneous panoramic radio-graphs and CBCTs from the same patients and to com-pare the images. However, due to ethical reasons that relate to the need of limiting exposure to ionizing radia-tion, it is not possible to prospectively recruit a sample where both radiographic techniques are employed at the same time on the same patients. For the same reason, it is almost impossible to retrospectively retrieve such a group of patients where both panoramic radiograph and CBCT were taken at the same point in time.
The maps (Fig 3A and 3B) can be used to estimate the optimal sites for miniscrew insertion. In general, slightly more interradicular space was found in the mandible than in the maxilla.
In a previous study about “safe zones” for miniscrew
placement based on panoramic radiographs,9 the areas
between premolars both in the mandible and maxilla were discarded due to a high distortion risk. In the same study, it was found that sites with more than 3 mm of interradicular space in the maxilla were evident be-tween the first molar and second premolar, the canine and lateral incisor, and the central incisors; whereas in the mandible, these sites were between the second and first molar, the first molar and second premolar, and the canine and lateral incisor. These results are in ac-cordance with those of the present study, except for the space between the maxillary first molar and the second premolar, as well as between the mandibular canine and lateral incisors, where smaller spaces were detected.
Poggio et al20 evaluated interradicular spaces at
different levels of the alveolar crest on CBCTs. The greatest amount of space in the maxilla was found between the second and first premolars, between the first premolar and canine, and to a lesser extent between the first molar and second premolar; in the mandible, with the exception of the space between the first premolar and canine, there was generally a good amount of space. The results for mandibular spaces are consistent with those of the present study, whilst in the maxilla the interradicular spaces found
in the present study were smaller than those previ-ously reported. However, it should be considered that the reference points in the present study were sam-pled at different levels, which increases precision and may help explain the different results.
Despite the heterogeneity of the considered
publi-cations, a systematic review11 reported general
agree-ment regarding the best sites for miniscrew placeagree-ment: the areas between the first and second molars, the first molar and second premolar both in the maxilla and in the mandible were indicated as the best locations. In the present study, however, the posterior region of the maxilla, and the space between the second and first molars in particular, showed a small amount of avail-able bone, thus contradicting what was found in the literature. Overall, panoramic radiographs underesti-mated the available interradicular spaces compared with CBCT, which is considered the gold standard for linear
measurements.40 Two exceptions were the space at the
coronal third between the first and second molars in the mandible, and the space at the apical third between the maxillary canine and lateral incisor. The latter can prob-ably be explained because at that point the arch displays an increased curvature and panoramic radiographs
im-ages therefore present greater distortion.41
To test the hypothesis that assessment of tooth size-arch length discrepancy can be used as a preliminary clinical tool for the evaluation of miniscrew insertion, the correlation between the amount of dental crowding and the presence of sufficient interradicular space for minis-crew insertion was assessed as well in the present study. In general, tooth size-arch length discrepancy measured at the crown level seems to be related to the amount of
in-terradicular space. Schnelle et al9 repeated interradicular
of this correlation is particularly important for interradic-ular areas where a suitable amount of space for miniscrew insertion is usually found; however, for a patient who has crowding, it should be expected that the interradicular space would be less than usual.
In their review, AlSamak et al11 proposed the use of
“safe zone” maps provided by the literature to define guidelines for miniscrew insertion, arguing that they would thereby avoid radiographs, at least for those sites that have proven to be favorable. Indeed, sometimes clinical examination alone is appropriate for evaluating miniscrew insertion sites. Considering also the results
of Landin et al,35 this task can be reasonably achieved.
In the present study, the value of “safe zone” maps was
Figure 6 - Clinical example of a deep bite case where miniscrews inserted between lateral incisors and canines could be used for intrusion of the maxil-lary anterior segment. Miniscrews are planned distal to the maxilmaxil-lary lateral incisors; according to the map, the chosen insertion sites are marked as yellow, but with a strong correlation between crowding and interradicular space. Since there is no crowding, the interradicular space is assumed to be sufficient and miniscrews can be considered. Indeed, the CBCT confirms this deduction. A) Digital models showing no crowding in the maxillary arch;
B) Panoramic-like image of the maxilla.
Figure 7 - Clinical example of a patient with moderate crowding. In the man-dible, for example, miniscrews between the first and second premolars could provide absolute posterior anchorage to solve crowding and incisal protrusion. According to the map, the interradicular spaces between the first and second premolars are marked as green sites, but with a strong correlation between crowding and interradicular space. Therefore, less space for miniscrew insertion may be expected in the case of crowding. In this case, on the right side, which is more crowded than the left, the CBCT confirms that inserting a miniscrew is not possible. A) Digital models showing crowding in both maxillary and mandibular arches; B) Panoramic-like image of the mandible.
improved by additional data from tooth size-arch length discrepancy; maps of average interradicular space are important, but the presence of crowding or spacing may substantially change the actual space available.
be used in combination with tooth size-arch length discrepancy assessment in light of the ALARA prin-ciple, whereby redundant radiographic investigation of the patient may be avoided. The map may also be used to unveil different biomechanics to bypass those inconvenient spaces, or even to choose from the out-set to use 3D radiographic examination that allows more comprehensive evaluation of the desired inser-tion sites. To help clinicians in this process, a decision tree based on the maps of safe zones and the map of correlations has been proposed (Fig 5). Nevertheless, further studies are needed to validate the suggested method in a clinical environment. To illustrate how the decision tree could help in clinical scenarios, two examples are provided (Figs 6 and 7).
Fewer correlations between tooth size-arch length discrepancy and interradicular spaces were found on panoramic radiographs with respect to CBCTs. An ex-planation for this finding could be that smaller inter-radicular spaces were measured overall on panoramic radiographs, and therefore the smaller range of values could have limited the correlation.
Although with Pearson correlation or Kendall’s tau tests a value of +1 means a perfect positive correlation and -1, a perfect negative correlation, in this particular case, a positive correlation coefficient means that when crowding increases, interradicular space decreases, since a positive (interradicular space) and a negative value (dental crowding) were correlated.
Surprisingly, when correlating interradicular spaces measured on CBCTs and tooth size-arch length dis-crepancy, a negative correlation was found at the apical level of the interradicular space between the lateral and central incisors in both the maxilla and the mandible, which means that for these regions, more crowding re-sults in more interradicular space. The reason for this finding may relate to the divergence of the roots where crowding is present; however, further investigations need to be performed to verify this finding.
It is important to underline that single interradicular spaces were correlated with the tooth size-arch length discrepancy of the entire relative segment (anterior or posterior) and not with a value of tooth size-arch length discrepancy between the two adjacent teeth relative to that interradicular space. This procedure was chosen to reflect what is usually applied in clinical practice, where tooth-by-tooth assessment of crowding is meaningless.
“Safe zone” maps should be used in combination with the map showing which interradicular spaces are correlated with dental crowding (Fig 4). This combi-nation facilitates the preliminary planning of miniscrew insertion before choosing which radiographs to pre-scribe, thereby making it possible to avoid unnecessary ionizing radiation.
CONCLUSIONS
1. The use of digital models to calibrate panoramic images constitutes a valuable tool, while direct hori-zontal measurements on non-calibrated panoramic radiographs lack precision.
2. Overall, compared with CBCT, panoramic radiographs underestimate the actual interradicular space, hindering the use of miniscrews when in re-ality insertion would be possible, provided that the amount of crowding is the same.
3. The findings of this study result in a new “safe zone” map. The best areas for miniscrew insertion are between the upper central incisors and the inter-radicular spaces from the mandibular second molar to the mandibular first premolar.
1. Wehrbein H, Göllner P. Skeletal anchorage in orthodontics--basics and clinical application. J Orofac Orthop. 2007 Nov;68(6):443-61.
2. Heymann GC, Tulloch JF. Implantable devices as orthodontic anchorage: a review of current treatment modalities. J Esthet Restor Dent. 2006;18(2):68-79; discussion 80.
3. Cornelis MA, Scheffler NR, De Clerck HJ, Tulloch JF, Behets CN. Systematic review of the experimental use of temporary skeletal anchorage devices in orthodontics. Am J Orthod Dentofacial Orthop. 2007 Apr;131(4 Suppl):S52-8.
4. Tsui WK, Chua HD, Cheung LK. Bone anchor systems for orthodontic application: a systematic review. Int J Oral Maxillofac Surg. 2012 Nov;41(11):1427-38.
5. Cheng SJ, Tseng IY, Lee JJ, Kok SH. A prospective study of the risk factors associated with failure of mini-implants used for orthodontic anchorage. Int J Oral Maxillofac Implants. 2004 Jan-Feb;19(1):100-6.
6. Melsen B, Costa A. Immediate loading of implants used for orthodontic anchorage. Clin Orthod Res. 2000 Feb;3(1):23-8.
7. Moon CH, Lee DG, Lee HS, Im JS, Baek SH. Factors associated with the success rate of orthodontic miniscrews placed in the upper and lower posterior buccal region. Angle Orthod. 2008 Jan;78(1):101-6.
8. Kuroda S, Yamada K, Deguchi T, Hashimoto T, Kyung HM, Takano-Yamamoto T. Root proximity is a major factor for screw failure in orthodontic anchorage. Am J Orthod Dentofacial Orthop. 2007 Apr;131(4 Suppl):S68-73.
9. Schnelle MA, Beck FM, Jaynes RM, Huja SS. A radiographic evaluation of the availability of bone for placement of miniscrews. Angle Orthod. 2004 Dec;74(6):832-7.
10. Wey MC, Shim CN, Lee MY, Jamaluddin M, Ngeow WC. The safety zone for mini-implant maxillary anchorage in Mongoloids Aust Orthod J. 2012 May;28(1):17-21.
11. AlSamak S, Gkantidis N, Bitsanis E, Christou P. Assessment of potential orthodontic mini-implant insertion sites based on anatomical hard tissue parameters: a systematic review. Int J Oral Maxillofac Implants. 2012 Jul-Aug;27(4):875-87.
12. Chaimanee P, Suzuki B, Suzuki EY. “Safe zones” for miniscrew implant placement in different dentoskeletal patterns. Angle Orthod. 2011 May;81(3):397-403. 13. Choi JH, Yu HS, Lee KJ, Park YC. Three-dimensional evaluation of maxillary
anterior alveolar bone for optimal placement of miniscrew implants. Korean J Orthod. 2014 Mar;44(2):54-61.
14. Deguchi T, Nasu M, Murakami K, Yabuuchi T, Kamioka H, Takano-Yamamoto T. Quantitative evaluation of cortical bone thickness with computed tomographic scanning for orthodontic implants. Am J Orthod Dentofacial Orthop. 2006 June;129(6):721.e7-12.
15. Farnsworth D, Rossouw PE, Ceen RF, Buschang PH. Cortical bone thickness at common miniscrew implant placement sites. Am J Orthod Dentofacial Orthop. 2011 Apr;139(4):495-503.
16. Fayed MM, Pazera P, Katsaros C. Optimal sites for orthodontic mini-implant placement assessed by cone beam computed tomography. Angle Orthod. 2010 Sept;80(5):939-51.
17. Laursen MG, Melsen B, Cattaneo PM. An evaluation of insertion sites for mini-implants - A micro-CT study of human autopsy material. Angle Orthod. 2013 Mar;83(2):222-9.
18. Ludwig B, Glasl B, Kinzinger GS, Lietz T, Lisson JA. Anatomical guidelines for miniscrew insertion: vestibular interradicular sites. J Clin Orthod. 2011 Mar;45(3):165-73.
19. Ozdemir F, Tozlu M, Germec-Cakan D. Cortical bone thickness of the alveolar process measured with cone-beam computed tomography in patients with different facial types. Am J Orthod Dentofacial Orthop. 2013 Feb;143(2):190-6.
20. Poggio PM, Incorvati C, Velo S, Carano A. “Safe zones”: a guide for miniscrew positioning in the maxillary and mandibular arch. Angle Orthod. 2006 Mar;76(2):191-7.
21. Van Elslande DC, Russett SJ, Major PW, Flores-Mir C. Mandibular asymmetry diagnosis with panoramic imaging. Am J Orthod Dentofacial Orthop. 2008 Aug;134(2):183-92.
22. Rejebian GP. A statistical correlation of individual tooth size distortions on the orthopantomographic radiograph. Am J Orthod. 1979 May;75(5):525-34. REFERENCES
23. Larheim TA, Svanaes DB. Reproducibility of rotational panoramic radiography: mandibular linear dimensions and angles. Am J Orthod Dentofacial Orthop. 1986 July;90(1):45-51.
24. Larheim TA, Svanaes DB, Johannessen S. Reproducibility of radiographs with the orthopantomograph 5: tooth-length assessment. Oral Surg Oral Med Oral Pathol. 1984 Dec;58(6):736-41.
25. Laster WS, Ludlow JB, Bailey LJ, Hershey HG. Accuracy of measurements of mandibular anatomy and prediction of asymmetry in panoramic radiographic images. Dentomaxillofac Radiol. 2005 Nov;34(6):343-9. 26. Quintero JC, Trosien A, Hatcher D, Kapila S. Craniofacial imaging
in orthodontics: historical perspective, current status, and future developments. Angle Orthod. 1999 Dec;69(6):491-506.
27. Kapila SD, Nervina JM. CBCT in orthodontics: assessment of treatment outcomes and indications for its use. Dentomaxillofac Radiol. 2015;44(1):20140282.
28. Kapila S, Conley RS, Harrell WE Jr. The current status of cone beam computed tomography imaging in orthodontics. Dentomaxillofac Radiol. 2011 Jan;40(1):24-34.
29. Bornstein MM, Scarfe WC, Vaughn VM, Jacobs R. Cone Beam Computed Tomography in implant dentistry: a systematic review focusing on guidelines, indications, and radiation dose risks. Int J Oral Maxillofac Implants. 2014;29 Suppl:55-77.
30. Kuijpers-Jagtman AM, Kuijpers MAR, Schols JGJH, Maal TJJ, Breuning KH, van Vlijmen OJC. The use of cone-beam computed tomography for orthodontic purposes. Semin Orthod. 2013;19(3):196-203.
31. van Vlijmen OJ, Kuijpers MA, Bergé SJ, Schols JG, Maal TJ, Breuning H, et al. Evidence supporting the use of cone-beam computed tomography in orthodontics. J Am Dent Assoc. 2012 Mar;143(3):241-52.
32. De Vos W, Casselman J, Swennen GR. Cone-beam computerized tomography (CBCT) imaging of the oral and maxillofacial region: a systematic review of the literature. Int J Oral Maxillofac Surg. 2009 June;38(6):609-25.
33. Yang L, Li F, Cao M, Chen H, Wang X, Chen X, et al. Quantitative evaluation of maxillary interradicular bone with cone-beam computed tomography for bicortical placement of orthodontic mini-implants. Am J Orthod Dentofacial Orthop. 2015 June;147(6):725-37.
34. Baumgaertel S, Hans MG. Buccal cortical bone thickness for mini-implant placement. Am J Orthod Dentofacial Orthop. 2009 Aug;136(2):230-5 35. Landin M, Jadhav A, Yadav S, Tadinada A. A comparative study between
currently used methods and Small Volume-Cone Beam Tomography for surgical placement of mini implants. Angle Orthod. 2015 May;85(3):446-53. 36. Lundstrom A. An investigation of 202 pairs of twins regarding
fundamental factors in the aetiology of malocclusion. Eur J Orthod. 2007;29(Suppl 1):i51-7.
37. Bland JM, Altman DG. Statistical methods for assessing agreement between two methods of clinical measurement. Lancet. 1986 Feb 8;1(8476):307-10. 38. Correia GD, Habib FA, Vogel CJ. Tooth-size discrepancy: a comparison
between manual and digital methods. Dental Press J Orthod. 2014 July-Aug;19(4):107-13.
39. Al-Abdallah M, Sandler J, O'Brien K. Is the Royal London Space Analysis reliable and does it influence orthodontic treatment decisions? Eur J Orthod. 2008 Oct;30(5):503-7.
40. Tsutsumi K, Chikui T, Okamura K, Yoshiura K. Accuracy of linear measurement and the measurement limits of thin objects with Cone Beam Computed Tomography: effects of measurement directions and of phantom locations in the fields of view. Int J Oral Maxillofac Implants. 2011 Jan-Feb;26(1):91-100.