Using Data Envelopment Analysis to support the design of process improvement
interventions in electricity distribution
Carla A.F. Amadoa,*, Sérgio P. Santosa and João F.C. Sequeirab
a
Faculty of Economics, University of Algarve and CEFAGE-UE 8005-139 Faro, Portugal
b
EDPDistribuição, S.A., Estrada da Penha, 8000-116 Faro, Portugal
*Corresponding author:
Faculty of Economics University of Algarve Campus de Gambelas, Edifício 9
8005-139 Faro Portugal
E-mail: [email protected] Tel: 00351 289 817571 Fax: 00351 289 800064
This is a post-print (i.e. final draft post-refereeing) of a manuscript submitted to European Journal of Operational Research.
To cite this article: Amado, C.A.F, Santos, S.P. and J. Sequeira (2013). “Using Data Envelopment Analysis to support the design of process improvement interventions in electricity distribution”. European Journal of Operational Research, 228: 226-235.
To link to this article: http://dx.doi.org/10.1016/j.ejor.2013.01.015
Abstract — A significant number of studies have documented the use of Data Envelopment Analysis for efficiency measurement in the context of electricity distribution, particularly at the level of the distribution utilities. However, their aim has been predominantly descriptive and classificatory, without any attempt to ‘open’ the black box of the transformation process. In contrast, our aim is to explore the potential of DEA to contribute to the design of effective process improvement interventions within a distribution utility.
In particular, in this paper, we study an important question within the context of DEA analysis: that is, to investigate whether differences in efficiency can be attributed to a particular managerial programme or design feature. We use two different methodologies to undertake this type of analysis. Firstly, we apply Mann-Whitney rank statistics to the scores obtained from DEA in order to evaluate the statistical significance of the differences observed between an intervention programme and its control group programme. Secondly, we undertake dynamic analysis with the Malmquist Productivity Index in order to study the impact of the introduction of a new technology on a group of units. Our case study focuses on the performance evaluation of medium-voltage power lines belonging to one of the service areas in the Public Electricity Distribution System in Portugal. The results from our case study show that the application of DEA for process improvement interventions has great potential and should be explored in other contexts.
1-INTRODUCTION
Efforts to improve efficiency and productivity in the delivery of public services have been developed across Europe and several reform initiatives have been undertaken with these objectives. Electricity distribution is considered to be a public service in many European countries and, in this respect, ensuring “value for money” is of paramount importance.
As discussed by Kumbhakar and Hjalmarsson (1998), it is useful to evaluate the efficiency and productivity of electricity distributors because their performance is largely influenced by the quality of management. Evaluating the efficiency and productivity within the context of electricity generation, however, may not be as useful because they are mainly determined by technological factors. Furthermore, as discussed by Santos et al. (2010), it is important to bear in mind that retail electricity distribution has a much closer relationship with customers than electricity generation. Therefore, an appropriate assessment of the performance of the distribution utilities and of the processes used to manage their systems can play an important role in ensuring an efficient and effective use of their resources and so help the delivery of high quality services to customers.
Performance assessment can either take the form of an internal evaluation exercise or of a benchmarking exercise. Through a benchmarking exercise an organisation compares itself with similar organisations operating in the same sector. Both types of performance evaluation can be of interest in the context of electricity distribution.
Data envelopment analysis (DEA) is a non-parametric linear programming technique which has proved very effective in determining best practice and it has been extensively used for benchmarking. DEA has been used to evaluate the efficiency of different types of decision making units (DMU) including banks, hospitals, universities, courts of law and also electricity utilities. However, while several single and multi-country studies of the relative efficiency of electricity distribution utilities have been reported, these studies have tended to be of a summative rather than formative nature (Santos et al. 2010). That is, their aim has been predominantly descriptive and classificatory. In contrast, the evaluation we discuss in this paper is predominantly formative, characterised by an effort to involve decision makers and to provide useful information for organisational management and improvement. Its ultimate aim is the promotion of learning and the identification of effective policies and procedures in the context of electricity distribution. In line with what has been suggested by Triantis (2004), this type of research attempts to explore the potential of DEA to contribute to the design of effective process improvement interventions. Rather than focusing on the individual classification and efficiency scoring of several DMUs, we study an important question within the context of DEA analysis: that is to investigate whether differences in efficiency can be attributed to a particular managerial programme or design feature.
To illustrate the use of DEA for formative evaluation performance this paper compares the cost-efficiency of 79 medium-voltage power lines belonging to one of the regional distribution networks
in the Public Electricity Distribution System in Portugal and undertakes analyses regarding the impact of different design systems and different maintenance programmes.
This study makes a contribution to the DEA literature on two grounds. Firstly, by applying DEA to study performance at a disaggregated level within a company, we contribute to pushing the DEA research envelope in the direction of opening the input-output transformation box and identifying the structures and mechanisms behind successful practice, as suggested by several authors (see for example, Triantis 2004, Avkarin and Parker 2010). Secondly, by applying rank statistics and undertaking dynamic analysis in the context of electricity distribution we contribute to a better understanding of the design specifications and maintenance programmes that contribute most to reducing costs and improving service quality delivery.
The remainder of this paper is organised as follows. Section 2 sets the context for this research study. Section 3 discusses the methodology used to test the impact of specific policies and design specifications. Section 4 discusses the DEA model used to undertake the efficiency analysis, presents the results obtained and discusses their usefulness. Section 5 concludes and presents suggestions for future research.
2-CONTEXT OF STUDY –ELECTRICITY DISTRIBUTION SYSTEM DESIGN AND EFFICIENCY OF OPERATION
EDP Group develops its regulated electricity distribution activity in mainland Portugal and in Spain. EDP Distribuição - Energia, S.A. (EDPD) is the EDP Group's company operating in the regulated distribution and supply businesses in Portugal. Electricity distribution activity is a regulated activity that consists of bringing the electricity through the distribution network from the transportation network substations to the final consumption points (EDP Energias de Portugal 2009). Within the scope of this activity, EDPD builds, operates and maintains the distribution network and other installations aimed at electricity distribution, providing service quality and direct and customised assistance to its clients. The distribution network includes the overhead lines and underground cables of high, medium and low voltage, the substations, the transformation poles, the metering, billing, and related support systems involved in the retail side of electricity delivery. The public lighting equipment is also part of the distribution network. The reliability and sustainability of the distribution network is fundamental for EDPD to develop its activity of electricity distribution and to guarantee adequate levels of service delivery, with high quality standards.
Maintenance in electricity distribution is the activity involved in maintaining the distribution system and its equipment in good working order, to improve its reliability and sustainability and to extend its life expectancy (Manganye and Tlabela 2008). As discussed by Meeuwsen and Kling (1997: 181) “[electric] utilities show an increasing interest in maintenance philosophies and practices, and the related costs and benefits. [M] The increasing interest in the maintenance process is due to the increasing maintenance work load and decreasing maintenance resources”.
The measurement and improvement of efficiency in electricity distribution is of paramount importance in order to minimise the overall costs involved and to maximise the quality of services delivered (minimisation of the number and duration of interruptions). As emphasised by Ćurčić et al. (1996: 74) “[power] supply cuts to customers are the most serious failure of power system functions. The damage caused by system outages has serious consequences for both customers and utilities. Following an outage caused by a faulted or overloaded network element, system control operators have an exceptionally hard task to restore power to customers in the most efficient way”.
Despite regulation of service quality standards, there is some level of flexibility regarding the design and configuration of the distribution network and the specific type of maintenance activities undertaken. In this respect, it is essential to identify the aspects of design configuration and maintenance that are associated with the highest levels of efficiency.
With regards to the system design, a good example of the flexibility involved is the decision to install or not install Oil Circuit Recloser (OCR) equipment in the overhead distribution lines. This equipment will interrupt the flow of power if there is a fault or short on the power lines, isolating the impact of power interruption to a smaller part of the power line, until the problem has been fixed and electricity distribution can be restored. Although a significant investment, it is considered that this piece of equipment can minimise the effects of interruptions, because, according to some studies (see for example, Weedy 1972: 26), around 90% of faults on overhead power lines are transient and can be cured by autoreclosing. EDPD has invested significantly in this technology, spending 4.4 million Euros in 2009, 8 million Euros in 2010 and 9.5 million Euros in 2011 (EDP – PDIRD 2009-11), and still plans to increase its investment. It is expected that the installation of OCR equipment may contribute to improving the quality of the service by lowering the duration and spread of power interruptions. However, once installed, this type of equipment also requires regular maintenance, whose costs should be taken into account. It is therefore of major interest to investigate the impact of this technology on the efficiency of lines.
With regards to the specific type of maintenance activities carried out on the lines, an example of flexibility is the amount of preventive maintenance versus corrective maintenance that is carried out on each of the lines. Whilst preventive maintenance is performed before a failure occurs to maintain a system in satisfactory condition, corrective maintenance is performed only after a failure occurs (Cui 2008).There are two types of preventive maintenance: time-based and condition-based. Whilst time-based prevention is performed at regular time intervals, condition-based prevention is based on the knowledge of the condition of the equipment. Corrective maintenance can be performed immediately after a failure has been noticed or can be deferred in time if the failure does not require urgent action. Preventive maintenance has the advantage of controlling equipment failure and related costs. However, not all preventive maintenance is cost-effective, as it may be cheaper to repair the failure (Jaturonnatee et al. 2006).
Gupta et al. (2001) discuss the difficulty in analysing the impact of different maintenance policies on costs and resulting benefits, given the interaction between several parameters, emphasising the need for further research to investigate the effect of preventive maintenance on system’s performance. In their paper, they study the impact of different prevention maintenance policies on manufacturing systems’ performance. They use queuing theory, with pooling state-dependent server vacation models, and conclude that when there are no jobs waiting to be processed at the end of a maintenance activity, it is worth undertaking another preventive maintenance activity.
As discussed by Dekker (1996: 229),“the main question faced by maintenance management, whether its output is produced both effectively, in terms of contribution to company profits, and efficiently, in terms of manpower and materials employed, is very difficult to answer”. In his paper, Dekker (1996) reviews several deterministic and stochastic models developed to study the optimal preventive maintenance effort and to help scheduling preventive maintenance actions in several different contexts. From his extensive literature review (112 papers), he concludes that whilst maintenance optimisation had already flourished as a discipline, its impact on decision making within organizations had been limited so far. Scarf (1997) also provides an interesting review of the literature in this research area, discussing examples of models for different types of maintenance, concluding that most research in this area had been of a theoretical type with the development of mathematical models with little attention paid to their applicability. In this respect, Scarf (1997) goes further than Dekker (1996) and appeals to Operational Research modellers to direct their efforts to solve real-maintenance problems, with application-driven studies.
Our case-study is an example of an application-driven study, where the research objectives are derived by real problems faced by the maintenance department of one of the regional networks of EDPD. This guarantees the practical relevance of our study. Furthermore, its methodological relevance and originality relate with the fact that this is the first published paper in the electricity distribution context using DEA to study the impact of different maintenance policies on the efficiency of lines. Previous DEA papers in the electricity distribution context have compared the efficiency and productivity of electricity distribution networks. Santos et al. (2010) provide a comprehensive review of these studies and point out that they tend to be mostly summative; that is, their aim has been predominantly descriptive and classificatory. Weyman-Jones et al. (2008) and Santos et al. (2010) constitute examples of formative studies in this context, where the main objective was to draw some lessons about how performance measurement and improvement can be implemented within an electricity distribution company.
In this article, the type of evaluation we carry out is also formative with the objective of drawing lessons regarding process improvement interventions in the context of electricity distribution. However, compared with the previous studies undertaken, our level of analysis is lower. Following the suggestions put forward by Triantis (2004), we intend to open the input-output transformation box in electricity distribution and focus on disaggregated process evaluation. Specifically, we
compare the cost-efficiency of a sample of medium-voltage overhead power lines belonging to one of the regional networks in EDPD and undertake analyses regarding the impact of different maintenance programmes and the impact of different design specifications.
3-METHODOLOGY
3.1 - USING DATA ENVELOPMENT ANALYSIS TO EVALUATE THE IMPACT OF POLICIES AND DESIGN ALTERNATIVES
DEA is a non-parametric technique used to measure the efficiency of DMUs and was first proposed by Charnes et al. (1978). The technique uses a production metaphor. It considers that each DMU is engaged in a transformation process, whereby using some inputs (resources) it tries to produce some outputs (goods or services). DEA uses all the data available to construct a best practice empirical frontier, to which each inefficient DMU is compared.
One of the interesting features of DEA is that it allows each unit to identify a benchmarking group; that is, a group of units that are following the same objectives and priorities, but performing better. In this regard, DEA aims to respect the priorities of each DMU by allowing each one of them to choose the weight structure for inputs and outputs that most benefits its evaluation. As a result, it aims to classify each unit in the best possible light in comparison to the other units. Another advantage of DEA is that it does not require specification of a cost or production function, allowing for richer models.
Below we present the envelopment form and the multiplier form of the DEA problem, with input orientation and assuming Constant Returns to Scale (CRS) for DMU0 (Cooper et al. 2007):
0
0
0
:
:
0 0 ,≥
≥
−
≥
+
−
λ
λ
θ
λ
θ
λ θX
x
Y
y
to
subject
Min
form
t
Envelopmen
.
0
,
1
0
:
:
0 0 ,≥
=
≤
−
v
u
vx
vX
uY
to
subject
uy
Max
form
Multiplier
v uThis problem will have to be solved individually for each of the N DMUs compared. In the primal and dual formulations presented, u and v are row vectors of output and input weights,
x
0andy
0 are column vectors of the inputs used and the outputs produced by DMU0 under evaluation, X and Y are input and output matrices representing the data for all N DMUs,θ
is a scalar representing the radial reduction in all inputs used by DMU0 and λ is a column vector of intensity variables, reflecting the weight to be attached to each DMU in forming the efficient benchmark for the DMU0under analysis.
θ
is the radial efficiency measure for DMU0, and will be equal to 1 if the DMU is radially efficient, and smaller than 1 if the DMU is inefficient when compared with the other DMUs.The DEA input oriented model with Variable Returns to Scale (VRS) (Barker et al. 1984) is similar
to the CRS version but includes the convexity restriction in the envelopment form:
1
1
=
∑
= N j jλ
. Theintroduction of this additional restriction will produce a scale variable (unrestricted in sign), which is subtracted in the objective function and in the first set of restrictions of the dual formulation. As discussed by Banker et al. (1984), if DMU0 is efficient under the VRS assumption, whether increasing, constant or decreasing returns to scale are present depends on whether the scale variable assumes a positive, null or negative value, respectively, in the optimal solution for the dual problem. Furthermore, if we run the DEA model under the CRS and VRS assumptions, we can obtain a measure of scale efficiency by diving the score obtained under the CRS assumption by the score obtained under the VRS assumption. If this ratio is equal to one, the DMU is scale efficient, but if it is smaller than one the DMU is scale inefficient.
A significant number of methodological developments have been proposed regarding the DEA technique. One of such developments relates with the use of weight restrictions in order to include information related with judgements regarding the value of each input and output (Allen et al. 1997). Several methodologies have been proposed to incorporate value judgements in DEA.The reader interested in this and other developments is referred to Cook and Seiford (2009) and Cooper et al. (2007).
In this paper, we study an important question within the context of DEA analysis: that is to investigate whether differences in efficiency can be attributed to a particular managerial programme or design feature. We use two different methodologies to undertake this type of analysis. Firstly, we apply Mann-Whitney rank statistics to the scores obtained from DEA in order to evaluate the statistical significance of the differences observed between a treatment programme and its control group programme. Secondly, we undertake dynamic analysis with the Malmquist Productivity Index, first proposed by Caves et al. (1982) and later improved by Färe et al. (1994), in order to study the impact of the introduction of a new technology on a group of lines.
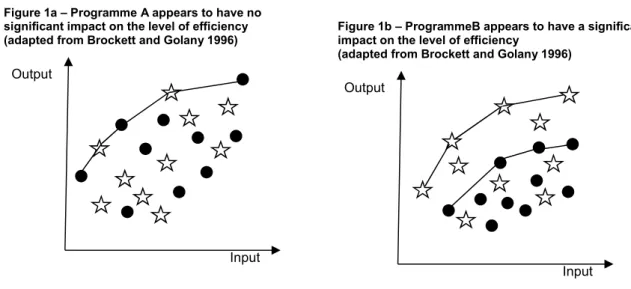
Brockett and Golany (1996) proposed an approach to estimate programmatic efficiency, which was based on the ‘programme evaluation’ methodology first suggested by Charnes and Rhodes (1981). Brockett and Golany’s approach is based on a procedure which involves four steps, described below:
I. Split the group of all DMUs (j = 1, ..., N) into two groups consisting of N1 and N2 DMUs (N1 + N2 = N). One of the groups contains DMUs which received the programme and the other group contains the DMUs which did not receive the programme intervention. Run DEA separately for the two groups.
II. In each of the two groups separately, adjust inefficient DMUs to their ‘level if efficient’ value by projecting each DMU onto the efficiency frontier of its group.
III. Run a pooled (or ‘inter-envelop’) DEA with all N DMUs at their adjusted efficient levels. IV. Apply a statistical test to the results of step III to determine if the two groups have the
same distribution of efficiency values within the pooled DEA set. Brockett and Golany (1996: 469) suggest the use of Mann-Whitney rank test.
As discussed in Brockett and Golany (1996), this procedure allows an analysis regarding the impact of specific programmes on the level of efficiency by distinguishing between ‘managerial inefficiency’ and ‘programmatic inefficiency’. Figures 1a and 1b below represent two contrasting situations regarding the impact of two programmes. In Figure 1a, we have a situation where programme A applied to a group of DMUs (represented as stars) does not appear to have a significant impact in the level of efficiency – the group of DMUs where the programme was implemented share the frontier with those where the programme was not implemented. In Figure 1b, we have a situation where programme B applied to a group of DMUs (represented as stars) appears to have a significant positive impact on the level of efficiency - the efficiency frontier for the DMUs where the programme was implemented is significantly superior. This positive impact can be identified despite the fact that some of the DMUs where the programme was introduced present relatively low levels of managerial efficiency.
Figure 1a – Programme A appears to have no significant impact on the level of efficiency (adapted from Brockett and Golany 1996)
Figure 1b – ProgrammeB appears to have a significant impact on the level of efficiency
(adapted from Brockett and Golany 1996)
According to Sympson (2005 and 2007), this four step procedure can lead to distorted results. Bias can be introduced in the second step by adjusting the input or output values to the efficient level of each group. This is because the process at step II depends on how the efficient DMUs are distributed between the programmes. Sympson (2007) demonstrates that the procedure proposed by Brockett and Golany (1996) tends to present stronger bias when two unequally sized groups are compared, favouring the larger of the two groups. In this respect, in order to avoid this bias, we have worked with sub-groups of DMUs with similar sizes.
Input Output
Input Output
3.2 – THE MALMQUIST PRODUCTIVITY INDEX
DEA can also be used to assess productivity changes over time through the calculation of Malmquist Productivity Indices (MPI) and their components(Caves et al. 1982, and Färe et al. 1994). The MPI is “an index representing the Total Factor Productivity (TFP) growth of a DMU, in that it reflects progress or regress in efficiency along with progress or regress of the frontier technology over time under the multiple inputs and multiple outputs framework” (Tone 2004: 203). This index is calculated by multiplying two indices: the ‘catch-up index’ and the ‘frontier shift index’. The catch-up effect captures the change in the efficiency rate of a particular DMU from one period to another, whilst the frontier shift effect captures the change in the efficient frontier from one period to another.
The DEA technique can be used to calculate both the ‘catch-up index’ and the ‘frontier-shift index’, assuming constant returns to scale (CRS).Let us now discuss how these measures can be obtained. Consider that 2(( , )t1), Q Q t y x
δ with t1 = 1,2 and t2 = 1,2 represents the efficiency score of DMUQ operating in time period t1, with reference to the frontier technology of period t2, under the CRS technology.
Following Tone (2004), the ‘catch-up index’ (C) and the ‘frontier-shift index’ (F) can be calculated using the following expressions:
. ) ) , (( ) ) , (( 1 1 2 2 Q Q Q Q y x y x C δ δ = . ) ) , (( ) ) , (( ) ) , (( ) ) , (( 2 1 2 2 2 1 1 2 1 1 × = Q Q Q Q Q Q Q Q y x y x y x y x F δ δ δ δ
By multiplying both effects, we obtain the expression for the MPI:
. ) ) , (( ) ) , (( ) ) , (( ) ) , (( 2 1 1 2 2 2 1 1 2 1 × = Q Q Q Q Q Q Q Q y x y x y x y x MPI δ δ δ δ
If the MPI is equal to one, it indicates that there was a status quo in the total factor productivity between the two periods analysed. Alternatively, if the MPI is smaller or greater than one, it indicates that there was decay or progress, respectively, in the total factor productivity.
Identification of each one of the components of the Malmquist Index is useful to understand the causes of the changes in productivity for each one of the DMUs, and for the industry as a whole. Another aspect that is important for the analysis is the identification of the DMUs that have
innovated from one period to another. These are the DMUs that have contributed to shift the frontier to higher levels. Färe et al. (1994) establish the two conditions necessary and sufficient to characterise a DMU as an innovator. These conditions are:
. 1 ) ) , (( nd 1 ) ) , (( 1 1 1 + = + > + t Q Q t t Q Q t y x a y x δ δ
Some authors have discussed the calculation of the MPI in situations where the researcher believes that the underlying technology is VRS. For example, Färe et al. (1994) proposes the decomposition of the MPI into three components: C assuming the VRS technology, F assuming the CRS technology, as this is considered a long term component, and a scale change effect (S). S is calculated from the ratio between scale efficiency in period 1 and scale efficiency in period 2:
.
)
)
,
((
/
)
)
,
((
)
)
,
((
/
)
)
,
((
2 2 2 2 1 1 1 1 Q Q VRS Q Q CRS Q Q VRS Q Q CRSy
x
y
x
y
x
y
x
S
δ
δ
δ
δ
=
If we multiply these three components, we arrive at the MPI, calculated assuming the CRS technology thus:
MPICRS = CVRS * FCRS * S (Färe et al. 1994 decomposition of MPI).
An alternative decomposition of the MPI has been proposed by Ray and Desli (1997), which includes the calculation of both C and F based on the VRS assumption. A scale change term (S’) is also included but its calculation is different from the one proposed by Färe et al. (1994). As pointed out by Grosskopf (2003), Ray and Desli (1997) scale change effect is in fact the product of Färe et al. (1994) scale change effect by the ratio of technical change under CRS to technical change under VRS.
MPICRS = CVRS * FVRS * S’ (Ray and Desli 1997 decomposition of MPI).
Lovell (2003) provides an interesting discussion regarding the economic interpretation of alternative decompositions for the MPI, concluding that the Ray and Desli (1997) decomposition is preferable to Färe et al. (1994) decomposition.
However, as discussed by Grosskopf (2003: 7), “[reporting] the results of the Malmquist index estimated relative to the VRS technology – unless the VRS technology were identical to the CRS technology- would mean, of course, that those results would not have an average product (ratio of output to input) interpretation”. For this reason, in most of the published studies in this research area the MPI is calculated with an assumption of CRS, irrespective of the nature of returns to scale found in the true underlying technology. The Färe et al. (1994) decomposition is an attempt to
evaluate productivity changes in a context where the true underlying technology is believed to be VRS, whilst maintaining an average product interpretation.
Another relevant issue in this research area is the lack of knowledge regarding the effects of calculating the technical change component of the MPI under the VRS assumption, in applications that require the inclusion of weight restrictions. To our knowledge, there is no published study documenting such calculation. On the contrary, there are several published studies which calculate the MPI with weight restrictions, under the CRS assumption (see for example, Santos et al. 2010; Miguéis et al. 2011). In this respect, in order to keep an average product interpretation of the results, and considering that we will include weight restrictions in our model, we have decomposed the MPI scores by using the Färe et al. (1994) decomposition method, despite its potential drawbacks as discussed by Lovell (2003). Future studies should evaluate the effects of using alternative decompositions of the MPI in empirical applications that require the inclusion of weight restrictions.
After revising the methodology used for the empirical analysis, we will now focus on the case study undertaken in this research.
4-DATA AND RESULTS –USING DEA TO EVALUATE THE IMPACT OF DESIGN AND POLICY ALTERNATIVES
4.1 - DEA Model and data
In order to evaluate the impact of network design alternatives and the impact of different strategies for network maintenance, we use data for the years 2006, 2007 and 2008 related to 79 medium-voltage aerial power lines belonging to one of the regional distribution networks of EDPD. In order to minimise the impact of exceptional events related with climatic conditions, we have focused our case study on lines belonging to the same regional distribution area, subject to relatively homogeneous climatic conditions. We have used a DEA model with input orientation and have assumed VRS, by using the formulation proposed by Banker et al. (1984). The following variables were included in the DEA model:
Inputs:
X1 - Total maintenance costs (in Euros); X2 - Power lost due to interruptions (in KVAs);
X3 – Number of transformation posts affected by interruptions; X4 - Number of interruptions;
X5-Total interruption time (in minutes).
Outputs:
Y1 - Line length (in meters); Y2 - Power installed (in KVAs);
Y3 - Number of transformation posts installed.
The choice of these variables resulted from several meetings undertaken with the managers responsible for system maintenance in one of the regional networks of EDPD. We have used an input orientation because the main objective of line maintenance management is to minimise the costs involved and improve the service quality standards. In this context, service quality relates to
reliability of service delivery. In terms of service quality, the main aim is to minimise the number of interruptions, the duration of the interruptions, the power lost due to interruptions and transformation posts affected by the interruptions. The output variables characterise the lines in terms of length, power installed and number of transformation posts installed. A variable related to the age of the lines was also suggested as anundesirable and non-controllable output. This variable was considered important because it can contribute to partially explain differences in the quality of service delivery (particularly, in terms of the number of interruptions). Unfortunately, reliable data for this variable was not available at the time of the study and therefore it was not included in the analysis.
We have run all DEA assessments with the PIM V2 software, developed by Emrouznejad and Thanassoulis (2005). Based on a preliminary analysis of the results, 6 lines were excluded, because the results suggested that they were outliers. Our final sample for analysis therefore constituted 73 aerial power lines. We have chosen to run a model with VRS because the proportionality assumption between inputs and outputs was not considered appropriate in this context. It was considered that there is scope for economies of scale, especially, in terms of the preventive maintenance costs. For example, doubling the length of the power line does not necessarily imply doubling the total maintenance costs. The same holds for some of the quality indicators (number of interruptions; total interruption time). Tables 1a, 1b and 1c below present the summary statistics for the variables used in the DEA model for each one of the three years analysed.
Table 1a – Summary statistics of the variables for the 73 lines compared (Year 2006)
Year 2006 Inputs Outputs
X1 X2 X3 X4 X5 Y1 Y2 Y3
Average 4335.13 162379.77 852.25 17.29 893.29 38263.70 8214.96 40.60
St Dev 5434.82 148597.98 1057.75 16.00 804.52 27996.66 4576.38 17.41
Max 40954.72 563763.00 5980.00 92.00 3043.00 129291.00 21346.00 83.00
Min 77.27 2240.00 19.00 1.00 0.01 5477.00 1830.00 11.00
Table 1b – Summary statistics of the variables for the 73 lines compared (Year 2007)
Year 2007 Inputs Outputs
X1 X2 X3 X4 X5 Y1 Y2 Y3
Average 7160.12 186193.32 1031.18 20.63 789.97 38369.90 8026.67 40.60
St Dev 7354.36 186818.07 1221.53 18.17 772.95 27885.04 4230.89 17.30
Max 42510.35 751050.00 6160.00 80.00 3084.00 129291.00 21346.00 83.00
Min 355.15 500.00 11.00 1.00 0.01 5719.00 1830.00 11.00
Table 1c – Summary statistics of the variables for the 73 lines compared (Year 2008)
Year 2008 Inputs Outputs
X1 X2 X3 X4 X5 Y1 Y2 Y3
Average 5130.37 125751.67 703.93 14.47 795.60 39280.10 7919.89 41.23
St Dev 4831.78 122442.59 798.10 12.13 866.04 28448.72 3614.98 17.20
Max 24939.21 618811.00 4425.00 58.00 4221.00 129291.00 16660.00 86.00
The summary statistics of the inputs and outputs show that the 73 lines compared vary considerably in size, ranging from 5,719 to 129,291 meters in length. Maintenance costs also vary considerably. In 2008, the maintenance cost attributed to each line varied from around 282 to 24,939 euros. With regards to the quality of service delivery, we can also see that clients served by different lines were subject to different standards of quality: the number of interruptions during 2008 varies from 1 to 58 interruptions and the total interruption time varies from 0.01 to 4221 minutes (more than 70 hours).
4.2 - Initial DEA analysis
The DEA results obtained from this model were discussed with the managers responsible for the system maintenance in one of the regional networks. The discussion that took place raised one main issue related to the optimal weight structure presented. The fact that many lines were classified as efficient, attributing a null weight to the quality indicators was considered inappropriate. In this respect, a set of virtual weight restrictions was included in the model, according to the methodology suggested by Sarrico and Dyson (2004). Following the classification proposed by these authors, we have developed virtual assurance regions of type I and have applied each one of the restrictions only to the target unit under assessment. This type of restriction was chosen because, on one side, they provide a natural representation of preferences and, on another side, after the inclusion of this type of restrictions the efficiency scores and targets can still be easily interpreted (Sarrico and Dyson 2004).
Ten virtual weight restrictions were added to the model in order to satisfy the preferences expressed by the managers. Two sets of three restrictions each were defined to guarantee that the virtual weight associated with the number of interruptions, on one side, and the virtual weight associated with the total interruption time, onthe other, was not smaller than the virtual weight associated with any one of the other three inputs. These sets of restrictions were considered necessary because, currently, the number of interruptions and the total interruption time are the two most important indicators of quality in use in EDPD. A third set of two restrictions was introduced to guarantee that the virtual weight associated with the maintenance costs was not smaller than the weight associated with any one of the remaining two inputs. This third set of restrictions was considered necessary because the company was interested in identifying best practice lines both in terms of quality and cost containment. Lastly, a set of two restrictions was defined to guarantee that the virtual weight associated with the length of the network was not smaller than the weight associated with any one of the other two outputs. This last set of restrictions was justified because from the three outputs defined, the length of network was the one considered most important to explain costs and quality standards.
In this respect, a model with 8 variables and 10 virtual weight restrictions was used to evaluate the relative efficiency of the 73 power lines. The summary statistics of the results obtained, for the
three years analysed, are presented in Table 2 below. These results suggest that there is great potential for cost reduction and quality improvement across the sample of lines analysed. The fact that, for example in 2008, only 15 lines were classified as efficient and the low efficiency scores obtained by some of the lines suggest that the maintenance activities undertaken in a large proportion of lines is not as effective as it could be. It was therefore considered useful to perform further analyses to identify some of the factors that may contribute to more effective maintenance.
Table 2 – Summary statistics of the efficiency results for the 73 lines (Years 2006-2008)
VRS Model with input orientation Year 2006 Year 2007 Year 2008
Average 44.91% 55.62% 53.46%
Standard Deviation 35.72% 35.63% 30.94%
Number of efficient lines 14 20 15
Max 100% 100% 100%
Min 4.53% 3.63% 8.03%
In order to contribute to the understanding of the structures and mechanisms behind successful practice in electricity distribution systems maintenance, we have undertakentwo sets of‘programme evaluation’ and one set ofdynamic analysis.Two different types of ‘programmes’ were evaluated. On one side, we analysed the impact of the different quality standards imposed by the Portuguese Energy Services Regulatory Authority and the impact of a specific preventive maintenance policy employed in a group of lines. On the other side, we undertook dynamic analysis to study the impact of the investment in a specific technology (OCR equipment).
4.3 - Are lines subject to higher external quality standards associated with higher levels of efficiency?
The Portuguese Energy Services Regulatory Authority has divided the service lines into three geographical areas (A, B and C) according to the quantity of customers that are served. Different service areas are required to meet different service quality standards. In cases of non-fulfilment of these standards, customers of different service areas are entitled to receive different amounts of monetary compensation. Service area A represents lines which serve the highest number of customers (located in major cities, serving more than 25000 customers). Lines in service area A are required to meet the highest service delivery quality standards and involve the highest monetary compensation penalties. Service area B includes lines serving an average number of customers (located in medium and small size cities, serving between 2500 and 25000 customers). Lines in service area B are required to meet less demanding service delivery quality standards than in service area A and involve lower penalties. Service area C includes lines that serve the remaining locations (located mainly inrural areas, serving less than 2500 customers). Lines in
service area C present the lowest service delivery quality standards and involve the lowest penalties.
Lines belonging to different geographical areas, and subject to different external quality standards, are given different treatment in terms of preventive maintenance, with priority to more thorough inspections being given to lines belonging to service areas A and B.
In order to evaluate the impact of these different external quality standards, we have divided a sample of 57 lines into two separate categories: 28 lines belonging to service areas A and B and 29 lines belonging to service area C. In the first stage, we have used data for the three year period of 2006-2008, by taking the simple average of each input and output for this period. Using a three year period allows us to smooth the annual random effects. From our set of 73 lines, we had to exclude 16 lines that changed classification during the three year period analysed. In a second stage, we have analysed data for each individual year. The input-oriented model discussed at the beginning of this section, including the ten weight restrictions, under the VRS assumption, was used in these analyses.
In order to analyse the true potential of the external quality standards programme we need to distinguish between managerial efficiency and programmatic efficiency. Step II of the procedure discussed in section 3.1 eliminates the managerial inefficiency. In Step III, DEA analysis is undertaken comparing the efficiency of the 57 lines with the inputs adjusted to their efficient levels. As would be expected, the levels of efficiency improve significantly after removing managerial inefficiency. In order to gauge the impact of the external quality standards programme, we have analysed results from Step III, with the lines separated by category of service area. Table 3 below presents these results, using the three year average.
Table 3 – Summary statistics of the programmatic efficiency of 57 lines – average 2006-2008 (Step III)
VRS model with input orientation 28 Lines belonging to areas A and B 29 Lines belonging to area C
Average 98.30% 85.45%
Standard Deviation 3.18% 21.18%
Number of efficient lines 18 10
Max 100% 100%
Min 90.09% 34.18%
Based on the results from Step III, we can verify that, once managerial inefficiency within each programme has been eliminated, the true impactof the higher external quality standards imposed in the group of lines belonging to service areas A and B is shown. On average, lines subject to higher external quality standards present significantly higher levels of efficiency. The statistical significance of the impact of this programme can be tested by using the Mann-Whitney rank test. The results obtained allow us to reject the ‘null hypothesis’ that states that lines belonging to these two groups have the same distribution of efficiency scores. In fact, the value obtained for the Z test
statistic (which follows an approximately standard normal distribution) was approximately equal to 2.74 (p-value of 0.0031). In this respect, our analysis based on the average of 2006-2008 does suggest a significant positive impact from the imposition of higher external quality standards with its associated higher penalties. In fact, the average rank for lines belonging to service areas A and B is 22.9 and the average rank for the lines belonging to service area C is 34.9.
In order to confirm this impact, we have analysed the efficiency results of the same sample of 57 lines, for each one of the three years. The results obtained for 2007 confirm a statistically significant positive impact of this programme (Z test statistic approximately equal to 2.15 – p-value of 0.016). However, using data for 2006 and 2008, we were unable to confirm a statistically significant positive impact from this programme. In this respect, we suggest that further analyses are carried in order to evaluate the impact of this preventive maintenance programme. These analyses should be carried out for lines belonging to other geographical areas, and for a longer period of time.
4.4 - Are lines subject to periodic preventive aerial inspections associated with higher levels of efficiency?
Until 31 December 2008, EDPD used different preventive maintenance policies according to its internal classification of lines into three relevance levels. The relevance level of each line is calculated in terms of several factors, including the power installed in the line;environmental relevance of the area served; external quality standards imposed to the line and the importance of the customers served by the line. Whilst lines in the two highest relevance levels are subject to aerial time-based preventive maintenance inspections, lines with the lowest relevance level are not subject to this type of time-based aerial preventive inspections. Aerial inspections have been undertaken by a specialised maintenance company and involve visual and thermographic capture and georeferencing of line items, based on detailed and accurate aerial screening of the entire length of the line, at least, once every three years. In this respect, in order to make sure that each one of the lines included in the highest relevance level group received one aerial inspection during the period considered, we have analysed the three year average data. This guarantees that the potential benefits that can result from this type of inspection are captured in the data. It is our conviction that analysing data for each year separately may produce invalid results, as we may have one year with a large proportion of lines receiving this type of inspection, showing stronger aggregate potential benefits from it and another year with a small proportion of lines receiving this type of inspection showing weaker potential aggregate benefits.
In order to evaluate the impact of these time-based aerial preventive inspections, we have identified the 63 lines which maintained their relevance level during the three year period studied
(2006-2008). From this sample of 63 lines, we identified those that presented the two highest relevance levels (21 lines) and those that presented the lowest relevance level (42 lines). In order to avoid the potential bias in the ‘programme evaluation’ that may arise when two different sized groups are compared (as discussed by Sympson 2005 and 2007), we have randomly selected 21 lines belonging to the lowest relevance level. The results of this randomly selected sample of 21 lines were compared with those obtained from the remaining 21 lines and the summary statistics were very similar, confirming non-bias selection of this sample. The two subgroups of lines used to evaluate the programme of aerial preventive inspections are therefore constituted by 21 lines with the highest two levels of relevance which are subject to aerial period time inspections and 21 lines with the lowest relevance level which are not subject to this type of regular inspection.
The input-oriented model discussed at the beginning of this section, including the ten weight restrictions, under the VRS assumption, was used in these analyses.
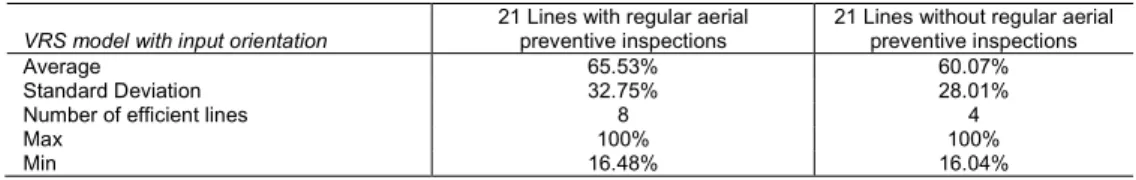
In order to gauge the impact of the time-based preventive aerial inspections programme, we have analysed results from Step III of the programme evaluation procedure described earlier, with the lines separated by category. Table 4 below presents these results.
Table 4 – Summary statistics of the programmatic efficiency of 42 lines (Step III)
Based on these results, it is possible to conclude that, even after adjusting for inner-programme managerial inefficiency, both groups of lines present relatively low levels of efficiency. Despite presenting a slightly higher average of efficiency scores, and a slightly higher average rank (21 against 23), the Mann-Whitney rank test suggests that the impact of aerial preventive inspections programme is not statistically significant. The results obtained do not allow us to reject the ‘null hypothesis’ that states that lines belonging to these two groups have the same distribution of efficiency scores. In fact, the value obtained for the Z test statistic (which follows an approximately standard normal distribution) was approximately equal to 0.54 (p-value of 0.7). In this respect, our analysis does not suggest a significant positive impact from this preventive maintenance policy.
EDPD line maintenance policy has changed since January 2009 and,currently, despite still using aerial preventive maintenance, it does not apply this type of inspection at regular intervals to lines based on their relevance level. Rather than being used as a time-based preventive type of maintenance, this type of inspection is now carried on the basis of the knowledge of the condition of the equipment and on the knowledge of its previous performance. Lines which present the
VRS model with input orientation
21 Lines with regular aerial preventive inspections
21 Lines without regular aerial preventive inspections
Average 65.53% 60.07%
Standard Deviation 32.75% 28.01%
Number of efficient lines 8 4
Max 100% 100%
poorest levels of performance (in terms of service quality) and which are known to require more thorough maintenance are subject to preventive aerial inspections.
4.5 - Does the installation of OCR technology lead to improved performance?
An important decision regarding the design of electricity distribution systems is the investment in OCR equipment to install in the lines. As previously discussed, EDPD has invested significant amounts of money in this technology in recent years and plans to continue with this type of investment. Although this technology is expected to contribute to the improvement of quality of service delivery, it will also imply an increase in maintenance costs. In this respect, it is relevant to evaluate its impact on productivity.In order to evaluate the impact of the installation of this technology, we have undertaken a dynamic analysis using the Malmquist Productivity Index and its components for the years 2007 and 2008.
In order to take some conclusions regarding the impact of the installation of this technology, we have identified three subgroups of lines which are of special interest for analysis. The first group of lines are 13 lines which did not have OCR technology in 2007 and benefited from the installation of this technology in 2008. The second group of lines are 27 lines which did not have OCR technology in 2007 and remained without this technology in 2008. The third group of lines are 17 lines which already had some OCR equipment installed in 2007 and maintained the same number in 2008. The total number of lines included in these three subgroups is 57. The remaining 16 lines (from the total sample of 73 compared) are those that already had OCR equipment installed in 2007 and benefitted from the installation of more pieces of equipment during 2008. The 73 lines were compared for the years 2007 and 2008 and the Malmquist Productivity Index and its two components were calculated for each one of them.
The summary statistics of the Malmquist Productivity Index results for the 73 lines compared are presented in Table 5a and the results for the three subgroups described earlier are presented in Tables 5b, 5c and 5d. The geometric mean was calculated, instead of the usual arithmetic mean, because of its desirable properties to analyse indices.
Table 5a – Summary statistics of the productivity results for 73 lines (Years: 2007-2008)
Model with input orientation Eff. score_2007 VRS Eff. score_2008 VRS CVRS FCRS S MPICRS Geometric Mean 40.79% 44.03% 1.08 1.09 1.15 1.35 Max 100.00% 100.00% 5.22 3.80 3.14 4.22 Min 3.63% 8.03% 0.25 0.47 0.16 0.23
Table 5b – Summary statistics of the productivity results for the 27 lines which remained without OCR equipment in 2008
Model with input orientation Eff. score_2007 VRS Eff. score_2008 VRS CVRS FCRS S MPICRS Geometric Mean 39.08% 43.52% 1.11 0.99 0.90 0.99 Max 100.00% 100.00% 3.65 3.80 1.58 2.67 Min 7.24% 13.10% 0.50 0.52 0.32 0.23
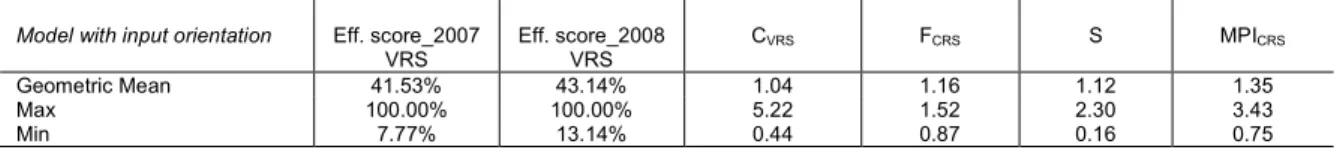
Table 5c – Summary statistics of the productivity results for the 13 lines which benefited from OCR installation in 2008
Model with input orientation Eff. score_2007 VRS Eff. score_2008 VRS CVRS FCRS S MPICRS Geometric Mean 41.53% 43.14% 1.04 1.16 1.12 1.35 Max 100.00% 100.00% 5.22 1.52 2.30 3.43 Min 7.77% 13.14% 0.44 0.87 0.16 0.75
Table 5d – Summary statistics of the productivity results for the 17 lines which already had OCR equipments in 2007 and maintained the same number in 2008
Model with input orientation Eff. score_2007 VRS Eff. score_2008 VRS CVRS FCRS S MPICRS Geometric Mean 36.66% 47.57% 1.30 1.16 1.23 1.84 Max 100.00% 100.00% 4.08 2.24 2.66 4.22 Min 3.63% 14.81% 0.47 0.66 0.64 0.54
The analysis of the results obtained for the 73 lines compared allow us to verify that, from 2007 to 2008, this sector benefited from significant improvements in productivity (average MPI = 1.35), which can be explained by a combination of a catch up effect with a frontier shift effect and a scale change effect. This is an expected result considering that EDPD has been working hard towards improvements in the quality of service delivery and improvements in cost-efficiency. Furthermore, some reconfigurations have been undertaken in some lines regarding size, which appear to have resulted in improvements in scale efficiency in some subgroups of lines. In this respect, in the period analysed, whilst the length of the lines has remained constant for the majority of the lines, the regional network of EDPD altered the power installed and the number of transformation posts installed in a significant part of the lines.
When we analyse the results of the three specific subgroups formed, we confirm that the subgroup of 13 lines which benefited from OCR installation presents, on average, an improvement in productivity (MPI = 1.35), whilst the group oflines which remained without this type of equipment presents, on average, a slight regress (MPI = 0.99). The improvements in productivity, for the lines that benefited from OCR installation are derived, mainly, from a frontier shift around these DMUs, which were able to keep up with the level of technological improvement, despite not reaching the efficiency status. Another subgroup of lines that shows significant improvements in productivity is the subgroup constituted by lines which already had this technology in 2007 and maintained the level of equipment installed. This is, in fact, the group of lines that presents the highest average
level of productivity improvement, derived from both frontier shift and efficiency catch up. Moreover, we confirm that the lines that respect the conditions to be considered innovators belong to this group. This may suggest that the introduction of this technology has a positive impact on performance, which continues to be noticeable in the medium and long term.
An aspect that requires further examination is the interaction between the installation of OCR technology and the alterations in scale efficiency. An analysis of the reconfigurations of size for each one of the three groups analysed allowed us to conclude that, whilst EDPD tended to decrease the power and number of posts installed in the group of lines without OCR, the opposite was observed in the other two groups. In fact, we can interpret these alterations in size as a transference of power from lines without OCR to those with OCR. This type of reconfiguration relates to EDPD expectancy regarding the positive effects of the installation of OCR technology on the quality of service. This type of reconfiguration appears to have been associated with a decrease in scale efficiency in the group of lines without OCR and an increase in scale efficiency in the other two groups of lines, which appear to have benefited from scale economies as the power installed increased. Beyond this scale change effect, the frontier-shift effect in both groups of lines with OCR and the catch-up effect in the group of lines which operated with OCR technology already in 2007 suggest that the installation of this type of technology is cost-efficient.
To sum up, these results confirm the improvements in productivity that have occurred in this region of EDPD and appear to suggest that the installation of this type of equipment can contribute to improve the efficiency of lines, despite the relatively high maintenance cost that this equipment involves. Further analysis of results for later years, and for other regional areas, is necessary in order to confirm this impact. Furthermore, the consideration of the costs of equipment and costs of installation would be desirable in order to evaluate the net impact of this investment. These types of costs can be included in a DEA analysis through an estimate of the depreciation cost of the equipment installed in each line.
5-CONCLUDING REMARKS
As emphasised by Triantis (2004), although efficiency measurement with DEA has been a fruitful research area, the use of this technique to evaluate alternatives within disaggregated processes has been scarce. In this respect, this paper has addressed an important area in which the impact of design and policy alternatives is investigated. In this study we were not concerned with the production of rankings of efficiency of individual DMUs, but rather our interest was in contrasting the efficiencies of groups of DMUs belonging to different design and management policy alternatives. In particular, we used ‘programme evaluation’ in the context of electricity distribution to study the impact of imposing external quality standards and the impact of a specific maintenance policy and undertook analysis with the Malmquist Productivity Index to study the impact of investing in a specific technology.
Our case study applied in one of the regional electricity distribution networks in Portugal,confirms the potential of DEA to contribute to significant organizational learning and performance improvement. This can be achieved through effective process improvement interventions based on a better understanding of the performance impact of different structures, processes and procedures. In the specific context analysed, our results did not provide solid evidence regarding a significant impact on lines’ efficiency of the imposition of external quality standards with financial penalties neither of time-based aerial preventive maintenance policy. Further analyses are needed with larger samples and longer periods of time in order to evaluate the impact of these two types of policies. With regards to the investment in OCR technology, our results show a positive impact on efficiency levels derived from the installation of this type of equipment, both in terms of a frontier shift and in terms of catching up with the efficient frontier. The analysis undertaken here considers only the maintenance costs involved. However, in order to fully evaluate the cost implications of the investment in OCR technology it would be desirable to include information regarding the cost of the equipment and of its installation.
Our dynamic analysis in this context has identified an issue that requires further research: the calculation of MPI and its components, when the true underlying technology is believed to respect VRS and the DEA applications include weight restrictions. Although several decompositions have been proposed under the VRS assumption, the effects of their calculation in the presence of different types of weight restrictions (pure weight restrictions and virtual weight restrictions) has not been studied and should be the subject of future research.
The type of analysis undertaken here can be extended in the context of electricity distribution to other design alternatives and to other maintenance policies in order to better understand the structures and mechanisms behind successful practice. Furthermore, this type of analysis can also be undertaken in other contexts where the researcher can have access to appropriate input-output data and process information.
ACKNOWLEDGEMENT
The authors thank the anonymous reviewers for the insightful comments and helpful suggestions. Funding support for this research was provided by Fundação para a Ciência e a Tecnologia (FEDER/POCI 2010).
REFERENCES
Allen R, Athanassopoulos A, Dyson RG and Thanassoulis E (1997). Weights restrictions and value judgements in data envelopment analysis: Evolution, development and future directions. Annals of Operations Research, 73: 13-34.
Avkarin NK and Parker BR (2010).Pushing the DEA research envelope. Socio-Economic Planning Sciences, 44: 1-7.
Banker RD, Charnes A and Cooper WW (1984). Some Models for Estimating Technical and Scale Inefficiencies in Data Envelopment Analysis. Management Science, 30: 1078-1092.
Brockett PL and Golany B (1996). Using Rank Statistics for determining Programmatic Efficiency Differences in Data Envelopment Analysis. Management Science, 42 (3): 466-472.
Caves DW, Christensen LR and Diewert DE (1982). The economic theory of index numbers and the measurement of input, output, and productivity. Econometrica, 50: 1393–1414.
Charnes A, Cooper WW and Rhodes E (1978). Measuring the efficiency of decision making unites. European Journal of Operational Research, 26 (6): 429–444.
Charnes A and Rhodes E (1981). Evaluating Program and Managerial Efficiency: An Application of Data Envelopment Analysis to Program Follow Through. Management Science, 27 (6), 668-697.
Cook, WD and Seiford LM (2009). Data Envelopment Analysis (DEA) – Thirty Years On”, European Journal of Operational Research 192: 1-17.
Cooper WW, Seiford L and Tone K (2007). Data Envelopment Analysis: A Comprehensive Text with Models, Applications, References and DEA-Solver Software. 2.nd Edition. Kluwer Academic Publishers: Massachusetts.
Cui L (2008). Maintenance Models and Optimization. In: Misra KB (eds). Handbook of Performability Engineering. Springer: London. Pages: 789-803.
Ćurčić S, Özveren CS, Crowe L and Lo PKL (1996). Electric power distribution network restoration: a survey of papers and a review of the restoration problem. Electric Power Systems Research, 35: 73 86
Dekker R (1996). Applications of maintenance optimization models: a review and analysis. Reliability Engineering and System Safety, 51: 229-240.
EDP Energias de Portugal (2009). Electricity Distribution. Document available online at: http://www.edp.pt/en/aedp/unidadesdenegocio/distribuicaodeelectricidade/Pages/Distribuicao.aspx. Accessed 10th November 2010.
EDP – PDIRD 2009-2011. Plano de Desenvolvimento e Investimento da Rede de Distribuição 2009-2011. Emrouznejad A and Thanassoulis E (2005) Performance improvement management. DEASoft, Pim Ltd. Färe R, Grosskopf S, Norris M and Zhang Z (1994).Productivity Growth, Technical Progress, and
EfficiencyChange in Industrialized Countries. The American Economic Review, 84 (1): 66-83.
Grosskopf S (2003). Some Remarks on Productivity and its Decompositions. Journal of Productivity Analysis, 20: 459-474.
Gupta D, Gϋnalay Y and Srinivasan MM (2001). The relationship between preventive maintenance and manufacturing system performance. European Journal of Operational Research, 132: 146-162.
Jaturonnatee J, Murthy DNP and Boondiskulchok R (2006). Optimal maintenance of leased equipment with corrective minimal repairs. European Journal of Operational Research, 174: 201-215.
Kumbhakar SC and Hjalmarsson L (1998). Relative performance of public and private ownership under yardstick competition: electricity retail distribution. European Economic Review, 42: 97-122.
Lovell CAK (2003). The Decomposition of Malmquist Productivity Indexes. Journal of Productivity Analysis, 20: 437-458.
Manganye MF and Tlabela PM (2008). The importance of maintenance activities and negative contributing factors faced by electricity distribution maintenance industry. Electricity Distribution Maintenance Summit – Day 2: 10 June 2008, South Africa. Document available online at: http://www.nersa.org.za/ Accessed 7 December 2010.
Meeuwsen JJ and Kling WL (1997). Effects of preventive maintenance on circuit breakers and protection systems upon substation reliability. Electric Power Systems Research, 40 (3): 181-188.
Miguéis VL, Camanho AS, Bjørndal E and Bjørndal M (2011). Productivity change and innovation in Norwegian electricity distribution companies. Journal of the Operational Research Society, forthcoming. doi:10.1057/jors.2011.82
Ray S and Desli E (1997). Productivity Growth, Technical Progress and Efficiency Change in Industrialized Countries: A Deja Vu. American Economic Review, 87: 1033 -1039.
Santos SP, Amado CAF and Rosado JR (2010). Formative evaluation of electricity distributionutilities using data envelopment analysis. Journal of the Operational Research Society: 1-22.
Sarrico C and Dyson RG (2004). Restricting Virtual Weights in Data Envelopment Analysis. European Journal of Operational Research, 159 (17): 34.
Scarf PA (1997). On the application of mathematical models in maintenance. European Journal of Operational Research, 99: 493–506.
Sympson G (2005). Programmatic efficiency comparisons between unequally sized groups of DMUs in DEA. Journal of the Operational Research Society, 56: 1431-1438.
Sympson G (2007). A cautionary note on methods of comparing programmatic efficiency between two or more groups of DMUs in data envelopment analysis. Journal of Productivity Analysis, 28: 141-147.
Tone K (2004). Malmquist Productivity Index: Efficiency change over time. In: Cooper WW, Seiford LM and Zhu J (eds). Handbook on Data Envelopment Analysis. Kluwer Academic Publishers: London. Pages: 203–227.
Triantis KP (2004). Engineering Applications of DEA, In: Cooper WW, Seiford LM and Zhu J (eds). Handbook on Data Envelopment Analysis. Kluwer Academic Publishers: London. Pages: 401-441.
Weedy BM (1972). Electric Power Systems. Second Edition, John Wiley and Sons: London.
Weyman-Jones TG, Boucinha J and Inácio CF (2008). Efficiency Analysis of Maintenance and Outage Repair in Electricity Distribution. Portuguese Journal of Management Studies, XIII: 89–110.