O
O
O
O
O
O
O
O
O
O
O
O
O
O
O
Application of metric entropy to determine properties of
structural materials
Grzegorz Garbacz
1*
and Lesław Kyzioł
2
1
Faculty of Production Engineering and Logistics, University of Technology, Opole, Poland
2Faculty of Mechanical Engineering, Gdynia Maritime University, Gdynia, Poland
Obstract
Composite materials have nowadays become a group of construction materials whose application in mechanical structure designing has been constantly increasing. There is therefore a real demand for an objective opinion on the mechanical properties of composites. According to the authors, determining those properties based on the recommended methods included in current standards requires objectivization. The difficulty is that those methods are usually based on the geometrical shape of stress curves in the strain function. The study proposes an new method of testing the mechanical properties of composites through analyzing the internal dynamics of measurement data based on uniaxial stretching tests. A tool in such an analysis is determining the Kolmogorov-Sinai metric entropy values of measurement data. Nine samples of composite materials having various compositions have been tested. In selecting these materials, the focus has been on the possibility of introducing composite recyclates as their structural components.
Keywords: designing materials, Kolmogorov-Sinai metric entropy, mechanical properties, recycling, stretching curve.
How to cite: Garbacz, G., & Kyzioł, L. (2019). Application of metric entropy to determine properties of structural
materials. Polímeros: Ciência e Tecnologia, 29(4), e2019050. https://doi.org/10.1590/0104-1428.03119
1. Introduction
Composite materials have been widely used in engineering applications as structural components. Property analysis of composite materials in terms of their engineering applications has an extensive bibliography. Referring to examples, the experimental methods of composite mechanics have been presented in the report[1], the mechanical properties of composites and the methods of damage assessment have been presented included in the report[2]. Computational analysis of the relationships between the structure and mechanical properties of the composite are discussed in[3]. The methods which allow to improve the desired properties of the composite are described in[4]. An experimental investigation on mechanical properties of the hybrid polymer nanocomposite has been recently reported in[5]. The analysis of fatigue damage has been presented in the report[6]. The difficulties related to recycling as well as polymer and composite utilization have been presented in the report[7]. However, determining material constants of composites involves certain difficulties stemming from their structural specifics. Moreover, the composite stretching curve usually does not include characteristic points reflecting internal structural strain. A clear damage to the composite sample usually occurs instantly, just as in case of brittle materials. Engineering calculations, however, require a determination of the stage in the composite material deformation process, right before its destruction, at which essential changes from the point of view of its durability and strength occur. The key is to calculate the metric entropy of data measurement subsets based on the formula proposed by
Kolmogorov-Sinai (K-S). The essence of metric entropy is that its nature is dynamic, as it describes system movement typical for chaotic processes. Metric entropy measures the dynamic instability of a system, i.e. expresses a method of describing chaos in a quantitative way[8].
The report[9] presents the results of mechanical testing of structural materials and the prepared mathematical model supported by dedicated computer software, one that allows for calculating the Kolmogorov-Sinai entropy for the results of those tests. The calculations included data sets consisting of several hundred to over a dozen thousand measurement points. Based on the K-S entropy calculations, the report[10] includes determining material constants for metals and the report[11] for composites. Both analyses involved stretching samples, controlled by extensometer signal. Additionally, the report[11] analyzes phase images of metric entropy. The purpose of this article is to present a new method consisting in converting measurement data based on their internal strain dynamics for newly-invented composites[12].
2. Materials and Methods
2.1 Own research
New composite materials[12] subjected to testing have been designed and produced in the laboratory of the Faculty of Mechanics, Technology Basics Institute at the Maritime Academy in Gdynia. Mechanical tests were carried out on
three composite materials whose structures were filled with different recyclate types. The composites consisted of the following components: Polimal 109A resin serving as the matrix, a glass mat serving as reinforcement and recyclate serving as the filler. The recyclate has been obtained through grinding industrial waste in the form of polyester-glass laminates and screening using a size 1.2 x 1.2 mm square mesh sieve.
The type A Polimal 109 composite component is an all-purpose, non-saturated, polyester structural resin. This resin is recommended for the manual manufacturing of large format, glass-fiber laminates. The percentage by weight contents of glass mat and other components has been included in Table 1. The materials obtained have been designated a K10, K30 and K0. The purpose of the tests is
also to determine the influence of the filler (recyclate) on the overall strength of the composite.
Selected, typical parameters of Polimal 109 have been included in Table 2. This data originates from the product sheets, which describes only their indicative nature.
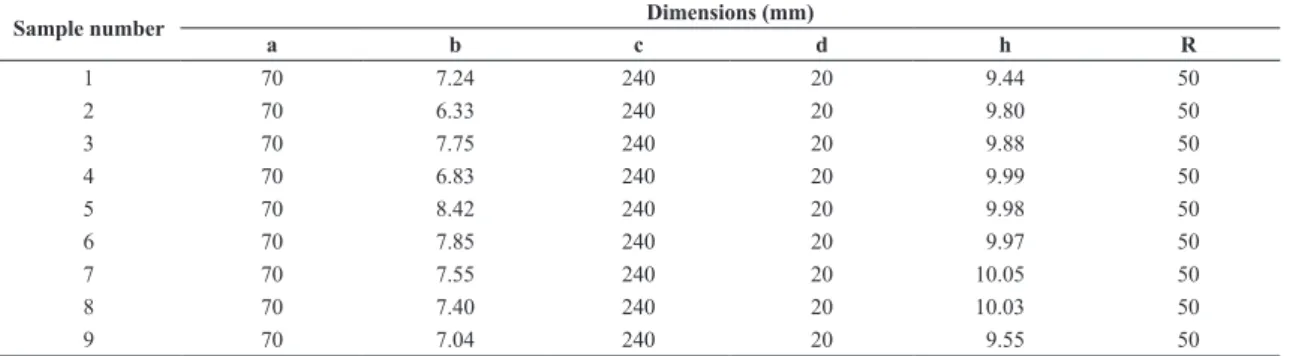
The shape and dimensions of samples, measured prior to the test, have been presented in Figure 1. Samples were prepared by waterjet cutting with the greatest possible care. Sample cross-section dimensions, recognized as significant considering the calculation of nominal stress, have been measured with the accuracy of 0.01 mm and have been included in Table 3. The aim of this analysis is to present a test method, not to determine material constants intended for presentation in construction material tables, as it would also require conducting tests on a much larger number of samples.
Table 1. Sample composition.
Composite Sample no. Resin (%) Glass mat (%) Glass mat layer number Fiber (%) accelerant(%)Hardner and
K10 1, 2, 3 61.5 27 10 10.5 1
K30 4, 5, 6 61 8 2 30 1
K0 7, 8, 9 62 37 12 0 1
Table 2. Selected parameters of Polimal 109 resin.
Parameter Norm Unit Value
tensile strength ISO 527 MPa 70
tensile elongation ISO 527 % 1,8
Toughness ISO 179 kJ / m2 10
Barcol hardness ASTM D 2583 oB 42
Figure 1. Sample geometry.
Table 3. Sample dimensions.
Sample number a b cDimensions (mm)d h R
1 70 7.24 240 20 9.44 50 2 70 6.33 240 20 9.80 50 3 70 7.75 240 20 9.88 50 4 70 6.83 240 20 9.99 50 5 70 8.42 240 20 9.98 50 6 70 7.85 240 20 9.97 50 7 70 7.55 240 20 10.05 50 8 70 7.40 240 20 10.03 50 9 70 7.04 240 20 9.55 50
In accordance with the data included in Table 1, 3 and 4, nine samples underwent uniaxial stretching tests. For the purposes of calculations and the presentation of results included in this article, 18 registered records of data have been used, meaning 2 data records of force and strain have been made for each sample. The number of sets corresponds to the number of measurement points, and it is the same for a single test conducted until material destruction. Strain
was recorded using an extensometer with a 50 mm base. The average strain rate and the sample total time of stretching are presented in Table 4. The static stretching test results for each sample were used as the bases for mathematical calculations aiming at determining the changes within Kolmogorov-Sinai metric entropy. The stretching tests have been conducted by controlling the applied force of the Zwick/Roell MPMD P10 B type HB 100 universal testing machine. The standard recommendations (DIN EN ISO 527-1) for testing have been observed. The tests have been carried out at the Faculty of Marine Engineering at Gdynia Maritime University. Composite material samples have been subjected to uniaxial stretching.
The figures (Figure 2) present sample scraps after rupture. Clear differences between samples containing recyclate and samples without recyclate, considering their external surfaces, are observable. The external surfaces of samples without recyclate (K0) are bright, and the surfaces of samples containing recyclate (K10 and K30) include bright grains of grinded polyester-glass dust.
2.2 Kolmogorov-Sinai metric entropy notion
The Kolmogorov-Sinai metric entropy[13,14] which, for the discrete probability distribution, is expressed by the following Equation 1: N i i i 1 S p lnp = = −∑ (1) where: N - number of subintervals, into which the result measurement data set has been divided. The Kolmogorov-Sinai measurement data set cardinality is indirect. At first, the cardinality is used to calculate the piprobability. Measurement data sets in reports are designated by the letter k. In fact, those are subsets distinguished from an entire record of test data and designated by the letter n. pi is probability of results in an ith interval (where the definition assumes
ln ,
p p 0≡ if p = 0).
If the intervals are equally likely, meaning p 1/Ni= for all instances of i, the entropy is expressed by formula S=lnN
and assumes a maximum value. However, if the results are included in specific intervals, the entropy assumes a minimum value, S 0= because p 1i= .
K-S metric entropy is dynamic by nature; therefore, it is useful for describing and analyzing phenomena of that exact nature, e.g. construction material strain. Fluctuation of metric entropy involves changes within the dynamics of physical strain processes as well as includes dissipation of energy that accompanies those changes.
Kolmogorov-Sinai entropy is calculated multiple times, each time for a certain number of subsets having a fixed, heuristically assumed cardinality of k, distinguished from the strain set n possible results registered during the stretching test. Internal dynamics of strains has been analyzed as the tests have been conducted by controlling the stretching force. In this case, the force diagram in the function of measurement points is linear. If the tests were conducted through controlling the stretching using the extensometer signal, it would be necessary to analyze the internal dynamic changes within the force or nominal stress. If an additional
Table 4. Average strain rate and total time of stretching test. Sample number stretching test (s)Total time of Strain rate (s-1)
1 124 1.8·10-4 2 121 1.5·10-4 3 137 1.7·10-4 4 55 2.2·10-4 5 62 1.5·10-4 6 75 1.2·10-4 7 130 1.4·10-4 8 145 1.5·10-4 9 136 1.1·10-4
Figure 2. Image of sample scraps after rupture, in accordance with the numbering provided in Table 1 and Table 3.
transverse extensometer was used, it would be possible to analyze the actual stress. The analysis described in this article has been based on strain signal data records obtained through tests conducted using a single extensometer mounted longitudinally.
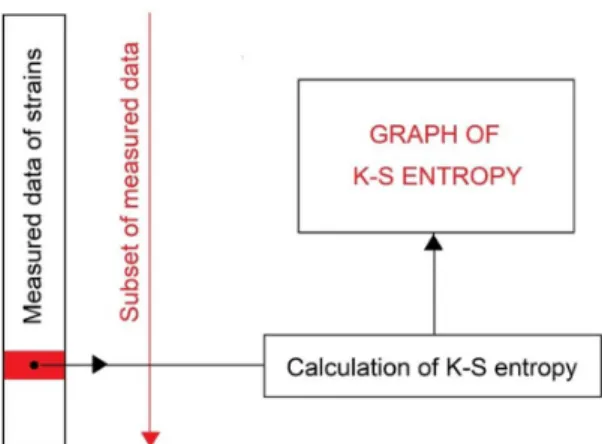
In order to better illustrate the calculation process, k-element subsets are compared to a “caterpillar” crawling over an n element measurement data set. The “caterpillar” makes n minus k steps. The distinguished k element subsets are each time divided into N subintervals to perform the calculations of Kolmogorov-Sinai entropy. For each test, N has a heuristically assigned value and is fixed. Each position of
a k set that determines its content allows for calculating the position of a single point on the entropy diagram. K-S metric entropy diagram in the function of subsequent measurement points consists of n minus k points. This situation has been schematically shown in Figure 3 and Figure 4.
2.3 Method of calculating a single entropy value corresponding to a single diagram point
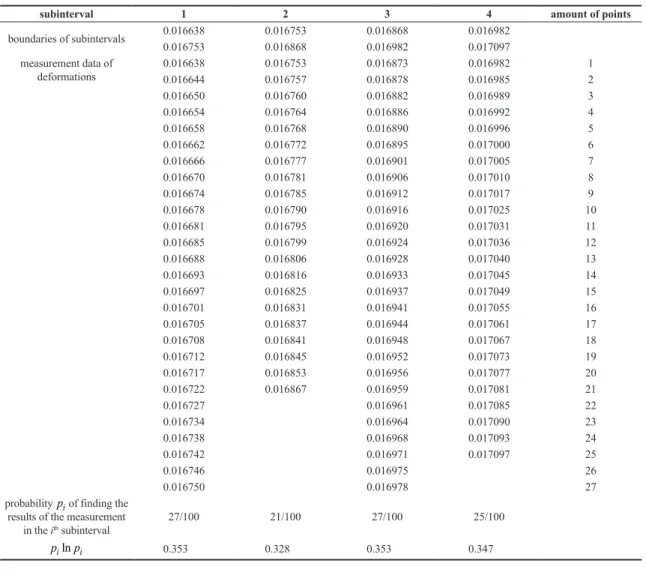
The cardinality of an n strain measurement data record and the cardinality of k-element subsets as well as the number of N subintervals to which the k-element subsets have been divided in relation to the strains of the examined sample 1 have been assumed in accordance with Table 5(first row).
For a selected subset of k 100= data, from measurement point 6301 to point 6400, a single value of K-S entropy has been calculated. The subset has been sorted in an ascending order from the minimum value to the maximum value. Based on the difference between max and min values, the limits for N =4 subintervals have been calculated, meaning the difference has been divided by 4. Point 6351 has been adopted as the central point of the subset and the K-S entropy for this point, and, based on the performed calculations as per Equation 2, equals 1.381. Subintervals 1, 2 and 3 are left-closed and right-open. The final subinterval is closed on both ends. The described actions have been presented in Table 6.
Finally, the K-S entropy is: 4 i i i 1 S p lnp = = −∑ =− −( .0 353 0 328 0 353 0 347 1 381− . − . − . )≈ . (2) According to Table 5, the n strain measurement data record for sample 1 equals 7077 points. The complete diagram of K-S entropy values presented in Figure 5 consists of 6977 points. The reason for this is that the k value has been deducted from the n value, meaning 100 points have been deducted from 7077 and the result of 6977 has been obtained.
3. Results and Discussions
In the course of uniaxial stretching tests, records of force data and corresponding strain of the extensometer have been registered for each of the 9 composite samples presented in Figure 2. Stress has been calculated considering the data from cross-section areas of samples. Figures 6-8 present the results of tests in a coordinate system of strain - stress.
The results from static stretching tests have proved that the highest mechanical properties were found in the
Figure 3. Demonstration of k subset “movement”.
Figure 4. Schematic presentation of the K-S entropy diagram development.
Table 5. n, k and N figures referring to the subsequent sample tests.
Sample number Total number of measurement points n Number of points for subset k Number of subset’s partitions N
1 7077 100 4 2 5189 100 4 3 6438 100 4 4 1782 80 4 5 2093 80 4 6 2158 80 4 7 7659 100 4 8 8168 100 4 9 7232 100 4
Table 6. Organized measurement data of strains and the calculation of probability for each subinterval.
subinterval 1 2 3 4 amount of points
boundaries of subintervals 0.0166380.016753 0.0167530.016868 0.0168680.016982 0.0169820.017097 measurement data of deformations 0.0166380.016644 0.0167530.016757 0.0168730.016878 0.0169820.016985 12 0.016650 0.016760 0.016882 0.016989 3 0.016654 0.016764 0.016886 0.016992 4 0.016658 0.016768 0.016890 0.016996 5 0.016662 0.016772 0.016895 0.017000 6 0.016666 0.016777 0.016901 0.017005 7 0.016670 0.016781 0.016906 0.017010 8 0.016674 0.016785 0.016912 0.017017 9 0.016678 0.016790 0.016916 0.017025 10 0.016681 0.016795 0.016920 0.017031 11 0.016685 0.016799 0.016924 0.017036 12 0.016688 0.016806 0.016928 0.017040 13 0.016693 0.016816 0.016933 0.017045 14 0.016697 0.016825 0.016937 0.017049 15 0.016701 0.016831 0.016941 0.017055 16 0.016705 0.016837 0.016944 0.017061 17 0.016708 0.016841 0.016948 0.017067 18 0.016712 0.016845 0.016952 0.017073 19 0.016717 0.016853 0.016956 0.017077 20 0.016722 0.016867 0.016959 0.017081 21 0.016727 0.016961 0.017085 22 0.016734 0.016964 0.017090 23 0.016738 0.016968 0.017093 24 0.016742 0.016971 0.017097 25 0.016746 0.016975 26 0.016750 0.016978 27
probability pi of finding the results of the measurement
in the ith subinterval 27/100 21/100 27/100 25/100
ln
i i
p p 0.353 0.328 0.353 0.347
Figure 5. Diagram presenting the strain and K-S entropy for
sample 1 with the marked set of k 100= measurement points. Figure 6. K10 composite samples stretching diagrams.
K0 designated composite (recyclate 0%), a bit lower in K10 composite and significantly lower in K30 composite. In composite K30, a high amount of recyclate (30%) and a low amount of glass mat, which is basically responsible for bearing the loads, caused the structure of such composite to display low strength properties and very low plasticity.
Strain, stress and K-S entropy in the function of subsequent measurement data diagrams have been prepared in order
to use the metric entropy calculations to detect changes within the structure of composites assessed based on the measurement data dynamics. Table 5 presents the records of n number of measurement points registered during each test as well as optional values k and N, adopted heuristically based on the observation of entropy diagram sharpness and expressiveness. The k values should be high enough to determine subintervals and to calculate probability, similarly
to developing a histogram. When excessive k values are adopted, the local dynamics is lost and the K-S entropy diagram does not include clear local minima. The adopted N value bears similar significance. Generally, higher k and N values are adopted for a large n record, meaning over a dozen thousand data. The method is not applicable to a small n number e.g. 100 measurement points. In data records of approx. 20,000 measurement points, it is usually difficult to distinguish between measurement noise and the response of the tested material.
The purpose of the diagrams is to search for clear metric entropy drops, which serve as the basis for conclusions related to the material structure change.
Figure 7. K30 composite samples stretching diagrams.
Figure 8. K0 composite samples stretching diagrams.
Figure 9. K-S metric entropy diagram against relative strain for sample 1.
Figure 10. Stress diagram in the function of subsequent measurement points for sample 1.
Based on the shape of the K-S entropy diagram as well as Figure 9 and Figure10, a conclusion was drawn that the internal composite material damage begins at the 5,359 measurement point, which corresponds to the relative strain of 0.013 and a 79 MPa stress.
Another significant entropy drop has been identified at point 5536, to which the relative strain of 0.14 and an 82 MPa stress correspond. A drastic drop in the entropy value can be observed right before sample rupture and applies to all tested samples.
Based on the shape of the K-S entropy diagram as well as Figure 11 and Figure 12, a conclusion was drawn that the internal composite material damage begins at the test
Figure 11. K-S metric entropy diagram against relative strain for sample 2.
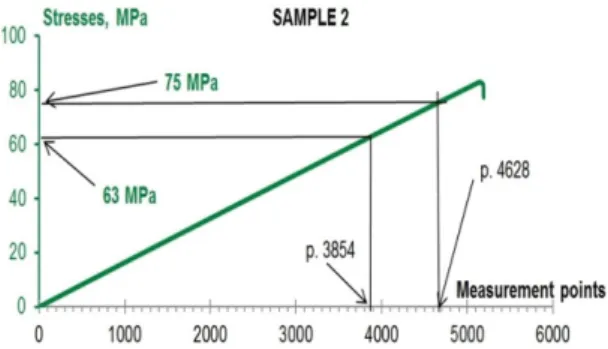
Figure 12. Stress diagram in the function of subsequent measurement points for sample 2.
Figure 13. K-S metric entropy diagram against relative strain for sample 3.
Figure 14. Stress diagram in the function of subsequent measurement points for sample 3.
Figure 15. K-S metric entropy diagram against relative strain for sample 4.
Figure 16. Stress diagram in the function of subsequent measurement points for sample 4.
starting point, in the area marked orange. However, the situation stabilizes around point 1700 and continues until measurement points 3854 and 4628 where major entropy drops are visible, which corresponds to relative strains of 0.013 and 0.014 as well as 63 and 75 MPa stresses.
Figure 13 presents one major entropy drop corresponding to point 6276. The point corresponds to strain equal to 0.0205. Based on Figure 14 a stress equal to 87 MPa has been determined. The phenomenon occurred right before sample rupture.
Figure 15 presents an entropy drop related to the final stretching stage, meaning sample rupture. This constitutes the 1406 measurement point as well as the corresponding relative strain of 0.0056, and according to Figure 16, stress equal to 21.3 MPa.
Similarly to Figure 15 and Figure 16, Figure 17 and Figure 18 present an entropy drop related to the final stretching stage, meaning sample rupture. The 1905 measurement point as well as the corresponding relative strain of 0.0073, and according to Figure 18, stress equal to 23.54 MPa have been determined as demarcation points. The behaviour of the sample 6 during the tests followed that recorded for the sample 5 (respective diagrams are not shown). For the sample 6, it was found that the relative strain is 0.0084 and stress equals 27 MPa.
The process of composite internal structure change within sample 7 starts with the beginning of stretching, which has been marked orange on Figure 19. The damage development and halt schemes are very similar to sample 2. Moreover, two significant measurement points have been distinguished – 5768, where the internal composite structure changes occur, and 6619 as the starting point for a definitive sample destruction. The stress and strain values for those points have been presented in Figure 19 and Figure 20. The results obtained for the sample 8 (not shown) are the same within a few percents as those which were determined for the sample 7.
Figure 21 presents the 6029 measurement point that corresponds to the commencement of composite structure changes and point 7029 that directly precedes the sample destruction. Proper strain and stress values have been provided in Figure 21 and Figure 22.
The described method is based on the entropy of macroscopic quantity, i.e., the mechanical stress of the sample. Since the sample break originates from its structural changes at the microscopic level, therefore, our method may provide an insight into the relationship between the mechanical properties of composites and their structure. However, further studies are required for this purposes, e.g., simultaneous recording of the stress of the sample and the changes of the sample structure by non-destructive testing methods.
Figure 17. K-S metric entropy diagram against relative strain for sample 5.
Figure 18. Stress diagram in the function of subsequent measurement points for sample 5.
Figure 19. K-S metric entropy diagram against relative strain for sample 7.
Figure 20. Stress diagram in the function of subsequent measurement points for sample 7.
Figure 21. K-S metric entropy diagram against relative strain for sample 9.
Figure 22. Stress diagram in the function of subsequent measurement points for sample 9.
4. Conclusions
1. The presented method for determining the mechanical properties of composite materials can be used in the process of structural design.
2. Due to the fact that the standards related to the strength of polymer composites basically do not consider the plasticity limit, this method becomes useful in the process of designing structures made of those materials. 3. The proposed method allows an objective assessment
of the composite composition and the usefulness of material share from their recycling, considering designing materials having the required construction properties. 4. The proposed method of presenting the changes within
the dynamics of data received based on strength tests conducted in laboratories or based on measuring actual objects may be used in design and modelling. Data availability statement
The raw data required to reproduce these findings are available on request. The processed data required to reproduce these findings are available on request.
5. References
1. Ochelski, S. (2004). Experimental methods of mechanics
incomposite materials research Metody doświadczalne mechaniki kompozytów konstrukcyjnych, Warszawa: Wydawnictwo
Naukowo-Techniczne.
2. Szymczak, T., & Kowalewski, Z. L. (2014). Mechanical properties of selected composites and methods of their fracture assessment. Transport Samochodowy, 4, 33-54.
3. Mishnaevsky, L. Jr, Mikkelsen, L. P., Gaduan, A. N., Lee, K.-Y., & Madsen, B. (2019). Nanocellulose reinforced polymer composites: computational analysis of structure-mechanical properties relationships. Composite Structures,
224, 111024-111032. http://dx.doi.org/10.1016/j.
compstruct.2019.111024.
4. Jong, L. (2019). Improved mechanical properties of silica reinforced rubber with natural polymer. Polymer Testing, 79, 106009. http://dx.doi.org/10.1016/j.polymertesting.2019.106009. 5. Kumar, G. N., Kumar, C. S., & Seshagiri Rao, G. V. R. (2019).
An experimental investigation on mechanical properties of hybrid polymer nanocomposites. Materials Today:
Proceedings, 19(2), 691-699. http://dx.doi.org/10.1016/j.
matpr.2019.07.755.
6. Rutecka, A., Kowalewski, Z. L., Makowska, K., Pietrzak, K., & Dietrich, L. (2015). Fatigue damage of Al/SiC composites – Macroscopic and microscopic analysis. Archives of Metallurgy
and Materials, 60(1), 101-105. http://dx.doi.org/10.1515/
amm-2015-0016.
7. Błędzki, A. K., Gorący, K., & Urbaniak, M. (2012). Possibilities of recycling and utilization of the polymeric materials and composite products. Polimery, 57(9), 620-626. http://dx.doi. org/10.14314/polimery.2012.620.
8. Dietrich, L., & Garbacz, G. (2008). Chaos taken into account
in measurement of physical quantities. In: Proceedings of the 25th Danubia-Adria Symposium on Advances in Experimental Mechanics (p. 53-54). České Budějovice and Český Krumlov,
Czech Republic: Czech Technical University in Prague Faculty of Mechanical Engineerin.
9. Garbacz, G. (2009). Processing of experimental data taking
into account their chaotic nature (Doctoral thesis). Institute
of Fundamental Technological Research Polish Academy of Sciences, Warsaw, Poland.
10. Garbacz, G., & Kyzioł, L. (2014). Determination of yield point of structural materials with using the metric entropy. Journal
of KONES Powertrain and Transport, 21(3), 97-104. http://
dx.doi.org/10.5604/12314005.1133176.
11. Garbacz, G., & Kyzioł, L. (2017). Application of metric entropy for results interpretation of composite materials mechanical tests. Advances in Materials Science, 17(1), 70-81. http:// dx.doi.org/10.1515/adms-2017-0006.
12. Panasiuk, K., & Hajdukiewicz, G. (2017). Production of composites with added waste polyester-glass with their initial mechanical properties. Scientific Journals of the Maritime University of
Szczecin, 57(124), 30-36. http://dx.doi.org/10.17402/242.
13. Kolmogorov, A. N. (1959). Entropy per unit time as a metric invariant of automorphism. Doklady of Russian Academy of
Sciences, 124, 754-755.
14. Sinai, Y. G. (1959). On the notion of entropy of a dynamical system. Doklady of Russian Academy of Sciences, 124, 768-771.
Received: May 26, 2019 Revised: Sept. 21, 2019 Accepted: Oct. 14, 2019