Maria da Piedade Oom de Albuquerque d’Orey
Bachelor of Science in Applied Chemistry
Functionalization of Silica Surfaces: Influence in
Naproxen Molecular Mobility and Release Profile
Dissertation to obtain the degree of Master in Bioorganic Chemistry
Supervisor: Dr. Teresa Cordeiro, FCT/UNL
Co-Supervisor: Prof. Doutora Madalena Dionísio Andrade, FCT/UNL
Jury:
President: Prof. Doutora Paula Cristina de Sério Branco
Arguing: Prof. Doutora Maria Margarida Canas Mendes de Almeida Cardoso
I
Maria da Piedade Oom de Albuquerque
d’Orey
Bachelor of Science in Applied Chemistry
Functionalization of Silica Surfaces:
Influence in Naproxen Molecular
Mobility and Release Profile
Dissertation to obtain the degree of Master in Bioorganic Chemistry
III
Functionalization of Silica Surfaces: Influence in Naproxen Molecular
Mobility and Release Profile
Copyright © Maria da Piedade Oom de Albuquerque, Faculdade de Ciências e Tecnologia, Universidade Nova de Lisboa
A Faculdade de Ciências e Tecnologia e a Universidade Nova de Lisboa têm o direito, perpétuo e sem limites geográficos, de arquivar e publicar esta dissertação através de
exemplares impressos reproduzidos em papel ou de forma digital, ou por qualquer outro meio conhecido ou que venha a ser inventado, e de a divulgar através de repositórios
V
Acknowledgements:
The assignment I developed was of great interest to me, as it was chemistry applied to
the pharmaceutical area. I acquired new skills, and increased my understanding on the subject.
As so, I would like to thank my supervisor, Dr. Teresa Cordeiro, for all the help, time and
support through this year she gave me.
I would also like to thank my co-supervisor, Prof. Doutora Madalena Dionísio for the opportunity to work in this project, and for all the time and effort to teach me.
Thank you to all the people that helped me during my laboratory work:
• Professor Doutor João Sotomayor with the drug loading.
• Professora Doutora Margarida Cardoso with laboratory facilities for drug delivery.
• Professora Doutora Marta Corvo with NMR analysis and data treatment.
• Doutora Inês Matos for the aid in the silica synthesis and silica surface
functionalization
• Dr. Nuno Costa from Laboratório de Análises (FCT-UNL) for textural
characterization of the silica.
• D. Idalina, D. Conceição e D. Palminha for the availability to aid with laboratory
equipment.
Thanks too, to my laboratory colleagues Andreia Santos and Sara Inocêncio, for all the encouragement.
At last, I would like to thank my parents, my two brothers, family and friends for all their
VII
Abstract:
This work aimed to improve aqueous drug solubility by amorphization upon loading in silica porous matrixes and stabilize it in the amorphous form. Naproxen was chosen as
the target material, a practically insoluble pharmaceutical drug, with pyretic and anti-inflammatory properties. To evaluate the influence of guest-host interactions in the drug
delivery, two silica matrixes were synthesized differing in their surface composition: unmodified MCM-41 mainly with surface silanol groups and MCM-41_Func caped with
methyl groups. The surface area modification with methyl groups was confirmed by attenuated total reflectance Fourier transform infrared spectroscopy (ATR-FTIR),
thermogravimetric analysis (TGA) and nuclear magnetic resonance (NMR). Textural analysis showed narrow pore diameter distributions centered at 3.0 and 2.9 nm,
respectively.
To evaluate the guest’s physical state, different techniques were used as: differential
scanning calorimetry (DSC), dielectric relaxation spectroscopy (DRS) and attenuated total reflectance Fourier transform infrared (ATR-FTIR) spectroscopy. These analyses
showed that naproxen was successful incorporated in the both silica. The naproxen’s amorphization was confirmed by the DSC detection of the glass transition, located in
between ~0ºC and 22ºC. However, crystallization and melting are always observed, nonetheless in low extent (~6 % of crystallization degree).
The mobility of the amorphous pharmaceutical drug incorporated inside these silica
pores, was probed by DRS, allowing estimating a dielectric glass transition temperature in good agreement with the calorimetric one and revealing a higher mobility for the
hydrated unmodified composite. It was shown that this mobility enhancement controls the drug delivery, monitored by ultraviolet spectroscopy, which revealed to be faster in
the unmodified matrix.
The studied composites show promising behavior as controlled drug delivery systems.
IX
Resumo:
Este trabalho teve como objetivo melhorar a solubilidade aquosa de um fármaco, por amorfização através de incorporação em matrizes porosas de sílica, e estabilizá-lo na
forma amorfa. O naproxeno foi escolhido como material alvo, sendo um fármaco praticamente insolúvel, exibindo propriedades ant-ipiréticas e anti-inflamatórias. Para
avaliar a influência das interações hóspede-hospedeiro na libertação do fármaco, foram sintetizadas duas matrizes de sílica diferindo na sua composição superficial: uma não
modificada, MCM-41, tento sobretudo grupos superficiais to tipo silanol, e uma modificada, por metilação MCM-41_Func. A modificação da área superficial com grupos
metilo foi confirmada por espectroscopia de infravermelho com refletância total atenuada por transformada de Fourier (ATR-FTIR), análise termogravimétrica e
ressonância magnética nuclear. A análise textural mostrou distribuições de diâmetro de poro estreitas centradas em 3,0 e 2,9 nm, respectivamente.
Para avaliar o estado físico do naproxeno incorporado, foram utilizadas diferentes técnicas tais como: calorimetria diferencial de varrimento (DSC), espectroscopia de
relaxação dielétrica (DRS) e ATR-FTIR. Estas análises mostraram que o naproxeno foi incorporado com sucesso em ambas as sílicas. A amorfização do naproxeno foi
confirmada por DSC através da detecção da transição vítrea, localizada entre ~ 0ºC e 22ºC. No entanto, observa-se sempre cristalização e fusão, ainda que em baixa
extensão (~ 6% de grau de cristalização).
A mobilidade do fármaco amorfo incorporado dentro destes poros de sílica, foi sondada por DRS, permitindo estimar uma temperatura dielétrica de transição vítrea em boa
concordância com a temperatura calorimétrica, e revelando uma maior mobilidade para o compósito hidratado não modificado. Demonstrou-se que este aumento de mobilidade
controla a libertação do fármaco que se mostrou mais rápida na matriz não modificada; a libertação do naproxeno foi monitorizada por espectroscopia de ultravioleta,.
Os compósitos estudados apresentam comportamento promissor para aplicação como sistemas controlados de liberação de fármacos.
Palavras-Chave: Naproxeno, Sílica Inorgânica, Amorfo, Transição Vítrea, Libertação
XI
TABLE OF CONTENTS:
1 Introduction ... 1
1.1 Motivation ... 1
1.2 Naproxen ... 1
1.3 Bioavailability and Biopharmaceutics Classification System (BCS) ... 2
1.4 Crystals and Amorphous Materials ... 3
1.5 Phase Transitions ... 5
1.5.1 Melting ... 6
1.5.2 Glass Transitions ... 6
1.6 Silica MCM-41 ... 8
1.7 Techniques ... 8
1.7.1 Attenuated Total Reflectance Fourier Transform Infrared Spectroscopy (ATR-FTIR) ... 8
1.7.2 Thermogravimetric Analysis (TGA) ... 10
1.7.3 Scanning Electron Microscopy (SEM) ... 11
1.7.4 Transmission Electron Microscopy (TEM) ... 11
1.7.5 Differential Scanning Calorimetry (DSC) ... 11
1.7.6 Nuclear Magnetic Resonance (NMR) ... 13
1.7.7 Dielectric Relaxation Spectroscopy (DRS) ... 14
1.7.8 Ultraviolet Spectroscopy (UV-Vis) ... 18
2 Methods and Materials ... 19
2.1 Synthesis of Mesoporous MCM-41 ... 19
2.2 Functionalization of the Mesoporous Silica MCM-41 ... 20
2.3 Textural analyses of MCM-41 and MCM-41 Functionalized by Nitrogen Absorption Analysis ... 20
2.4 Drug Loading ... 21
2.5 Scanning Electron Microscopy (SEM) ... 22
2.6 Transmittance Electron Microscopy (TEM) ... 22
2.7 Thermogravimetric Analyses (TGA) ... 22
2.8 Attenuated Total Reflectance Fourier Transform Infrared Spectroscopy (ATR-FTIR) 23 2.9 Nuclear Magnetic Resonance (NMR)... 23
2.10 Different Scanning Calorimetry (DSC) ... 23
2.11 Dielectric Relaxation Spectroscopy (DRS) ... 25
2.12 Control Release Experiments ... 26
2.13 Ultraviolet-Visible Spectroscopy (UV-VIS Spectroscopy) ... 27
3 Results and Discussion ... 29
3.2 Transmission Electron Microscopy (TEM) ... 30
3.3 Thermogravimetric Analysis (TGA) ... 31
3.4 Attenuated Total Reflectance Fourier Transform Infrared Spectroscopy (ATR-FTIR) 33 3.5 Nuclear Magnetic Resonance (NMR)... 37
3.6 Different Scanning Calorimetry (DSC) ... 39
3.7 Dielectric Relaxation Spectroscopy (DRS) ... 49
3.8 Control Release Experiments ... 55
4 Conclusion ... 57
5 References ... 59
XIII
LIST OF FIGURES:
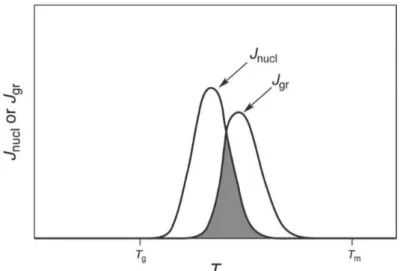
Figure 1. Representation of naproxen molecular structure. * indication of the chiral centre. ... 2 Figure 2. Amorphous solids vs Crystalline solids. ... 3 Figure 3. Demonstration of nucleation rate, Jnucleation, and rate of crystal growth, Jgrowth,
in respect to temperature. Tg is the glass-transition temperature, Tm is the melting
temperature, units are arbitrary for rate. The area where the curves overlap, in grey, is the temperature range where nucleation and growth happen.15 ... 4
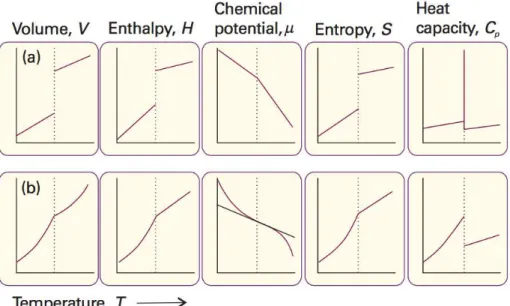
Figure 4. Thermodynamic properties changes in a) first order phase transitions and b) second order phase transitions16 ... 5
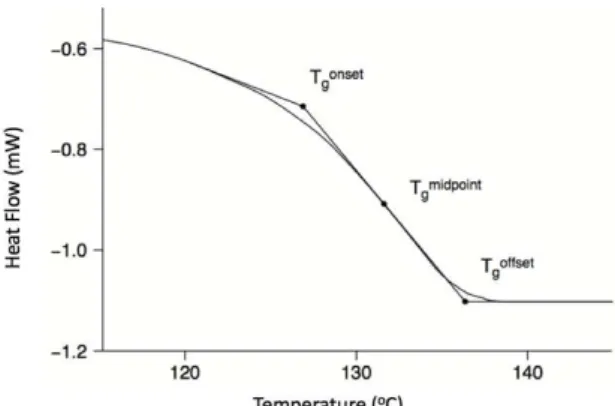
Figure 5. Representation of Tg from a DSC scan, idientification of onset, midpoint and
offset or endset. ... 7 Figure 6. Representation of temperature dependence on enthalpy and volume. Tga is
the glass transition temperature formed from a slow cooling rate and Tgb from a
faster. Tm is the melting temperature.19 ... 7
Figure 7. Scheme of a multiple reflection in ATR-FTIR.27 ... 10
Figure 8. Diagram representation of the heat-flux of differential scanning calorimetry.32
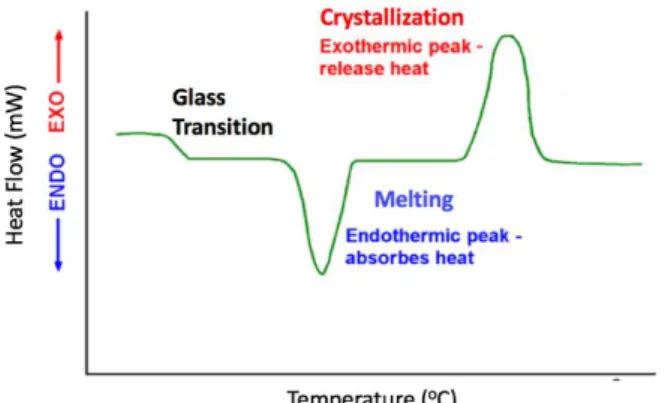
... 12 Figure 9. Differential Scanning Calorimetry profile with exothermic and endothermic
heat flow plotted versus temperature.33 ... 13
Figure 10. Attributed Qn nomenclature to the different silanol groups on the silica
surface.36 ... 14
Figure 11. Frequency response of the dielectric mechanisms.38... 15
Figure 12. Representation of electronic transitions that results from light absortion.42 18
Figure 13. Representation scheme of the MCM-41 synthesis.22 ... 19
Figure 14. Representation of MCM-41 functionalization. Adapted43 ... 20
Figure 15. Assembly line for drug loading process. ... 21 Figure 16. Illustration of how the temperatures are extracted at onset, midpoint and
endset of glass transition. ... 24 Figure 17. Thermal treatment applied to a) native naproxen and b) both silicas, in red
heating cycles and in blue cooling cycles. ... 24 Figure 18. First Thermal treatment applied to both loaded composites in red heating
cycles, in blue cooling cycles and in green annealing cycle. ... 25 Figure 19. Thermal treatment applied to a) 41 loaded with naproxen, b)
MCM-41_Func loaded with naproxen, in red heating cycles, in blue cooling cycles and in green annealing cycles. ... 25 Figure 20. Naproxen UV-Vis spectrum ... 27 Figure 21. SEM Images of unloaded MCM-41. On the left, the image with an
amplification of 200x and on right with 10.000x. ... 29 Figure 22. SEM images of loaded MCM-41. Top left 200x, top right 2.000x, bottom left
5.000x and bottom right 10.000x amplification. ... 29 Figure 23. TEM micrographs of unloaded MCM-41. ... 30 Figure 24.TEM micrographs of loaded MCM-41 with naproxen. ... 30 Figure 25. TGA plots for native naproxen (orange), both unloaded MCM-41(dark blue)
and MCM-41_Func (light green) and the respective composites (light blue and dark green). ... 31 Figure 26. Derivative plot of native naproxen (orange), both loaded MCM-41 (bluw)
and MCM-41_Func (green). ... 32 Figure 27. Region of the spectrum between 4000 and 3500 cm-1 for both matrixes, in
blue the unmodified and in green the modified one. All the curves were vertically displaced for a better visualization. The dashed lines included to aid band
Figure 28. Region of the spectrum between 3600 and 1200 cm-1 for both silica, in blue
the unmodified and in green the modified one. All the curves were vertically
displaced for a better visualization. The dashed lines to aid band visualization. ... 34 Figure 29. Region of the spectrum between 1400 and 400 cm-1 for the two matrixes, in
green the unmodified and in blue the modified one. All the curves were vertically displaced for a better visualization. The dashed lines to aid band visualization. ... 35 Figure 30. ATR-FTIR spectrum in the C-H, C=C and C=O regions for a comparison of
native naproxen with the loaded and unloaded Matrixes of MCM-41 at room temperature. All the curves were displaced vertically for a better comprehension and visualization. ... 36 Figure 31. 29Si MAS NMR spectra of the unloaded silica matrixes (see legend). ... 37
Figure 32. 13C NMR spectra of MCM-41 and MCM-41_Func. ... 38
Figure 33. Thermogram of native naproxen, main cycles represented. In pink the first heating cycle followed by de second cooling cycle in blue. ... 39 Figure 34. Thermogram of unloaded a) MCM-41 and b) MCM-41_Func, main cycles
represented. In dark pink the first heating, second cooling cycle in blue followed by the second heating cycle in lighter pink. ... 40 Figure 35. Thermogram of loaded MCM-41, main cycles represented. In dark pink the
first heating cycle and native naproxen heating cycle, the second cooling cycle in blue, second heating cycle in lighter pink followed by the cycle after annealing in purple. Native naproxen curve in orange was displaced vertically for a better
comprehension and visualization. ... 41 Figure 36. Thermogram of loaded MCM-41_Naproxen two months after the first
reading, main cycles represented. In dark pink the first heating cycle, the second cooling cycle in blue, second heating cycle in purple. ... 42 Figure 37. Thermogram of loaded MCM-41, main cycles represented. In dark pink the
first heating cycle, in orange native naproxen heating cycle, the second cooling cycle in blue, heating cycle after annealing in dark blue, heating cycle after second annealing in purple, seventh cooling cycle in green. Native naproxen curve was displaced vertically for a better comprehension and visualization. ... 42 Figure 38. Thermogram of loaded MCM-41, derivative plot evidencing one populations, smoothing was applied (x15). ... 44 Figure 39. Thermogram of loaded functionalized MCM-4, main cycles represented. In
dark pink the first heating cycle and native naproxen heating cycle, the second cooling cycle in blue, second heating cycle in lighter pink followed by the cycle after annealing in purple. Native naproxen curve in orange was displaced vertically for a better comprehension and visualization. ... 44 Figure 40. Thermogram of loaded functionalized MCM-41, main cycles represented. In
dark pink the first heating cycle, in orange native naproxen heating cycle, the second cooling cycle in blue, heating cycle after annealing in dark blue, second heating cycle after annealing in purple, seventh cooling cycle in green. Native naproxen curve was displaced vertically for a better comprehension and
visualization. ... 45 Figure 41. Thermogram of loaded MCM-41_Func_Nap, derivative plot evidencing one
populations, smoothing was applied (x15). ... 46 Figure 42. Comparison of both composites, after annealing (dried); a) Tg plot and b)
derivative plot of Tg. In blue unmodified composite and in green functionalized
composite. ... 48 Figure 43. Dielectric loss spectra taken isothermally at the temperatures indicated for
a) and b) hydrated (1st heating) and c) and d) dried (2nd heating) composites; see
legend inside figure. ... 49 Figure 44. Isochronal plots at the frequency 1x10⁴ Hz for composites, a) unmodified
XV
Figure 45. Comparative analyses between both composites for first and second
heating cycles, through isochronal a), b) and isothermal c), d) representations. ... 51 Figure 46. Representation of a fitting process. ... 52 Figure 47. Relaxation time, , versus 1/T for the alpha process of the composite
MCM-41, pink circles, isothermal loss data, blue circles, obtained from isochronal plots for some frequencies (=1/(2f), 1/Tmax). The solid line is the VFTH fit to the data
(see equation 7, and parameters in table 11). Arrows indicating dielectric Tg,DRS
(=100 s) and calorimetric Tg,DSC(onset) glass transition temperatures. ... 53
LIST OF TABLES:
Table 1. Representation of the Biopharmaceutics Classification System. 11 ... 3
Table 2. Textural properties of MCM-41 and MCM-41 functionalized. ... 21 Table 3. Temperature steps and range of dielectric measurements at which isothermal
spectra were collected for both composites. ... 26 Table 4. Water content, organic functional groups and loading percentages for both
silica and composites. ... 33 Table 5. Percentage and Chemical shifts of deconvoluted 29Si MAS NMR spectra of
MCM-41 and MCM-41_Func.25 ... 38
Table 6. Table showing values of enthalpy variation and melting temperature for MCM-41 incorporated with naproxen with no framework, the following values are an average from three collections. ... 41 Table 7. Values of thermal transitions collected from DSC for unmodified loaded
composite, MCM-41_Naproxen. The data result from an average of three
collections. ... 43 Table 8. Table showing values of enthalpy variation and melting temperature for
functionalized MCM-41 incorporated with naproxen. The values result from an average of three collections. ... 45 Table 9. Values of thermal transitions collected from DSC for modified loaded
composite, MCM-41_Naproxen. The data resulted from an average of three
collections. ... 46 Table 10. Crystalline Percentage calculi for both loaded matrixes. ... 47 Table 11. Estimated parameters of the VFTH Fit to the relaxation times of the α
LIST OF ABREVIATIONS:
- symmetry broadening the spectrum
ATR-FTIR- Infrared Spectroscopy by Attenuated Total Reflectance
asymmetric broadening spectrum
B- broadening the spectrum parameter, characteristic of the material
BCS- Biopharmaceutics Classification System
BET- Brunauer–Emmett–Teller
BJH- Barrett-Joyner-Halenda
CP- Cross Polarization
Cp Change in heat capacity
De- dielectric strength
DFT- Density Functional Theory
c Change in Enthalpy of Crystallization
m Change in Enthalpy of Fusion
Dp - Pore diameter
DRS - Dielectric Relaxation Scanning
DSC - Different Scanning Calorimetry
- optical dielectric constant (real permittivity at infinite frequency)
fmax- Maximum frequency
G- Shear modulus
HN-Havriliak Negami
HO-Si-OH- geminal silanol groups
HO-Si-Si-O-OH- vicinal silanol groups
IR-Infrared Spectroscopy
Jgrowth– rate of crystal growth
XIX
MCM-41- Mobil Composition of Matter No. 41
MCM-41_Func- Mobil Composition of Matter No. 41 functionalized loaded with naproxen
MCM-41_Func_Naproxen- Mobil Composition of Matter No. 41 functionalized loaded with naproxen
MCM-41_Naproxen- Mobil Composition of Matter No. 41 loaded with naproxen
NMR- Nuclear magnetic resonance
Q2- geminal silanol groups
Q3- vicinal or isolated silanol groups
Q4- surface siloxanes
Qn- Attributed nomenclature to the different silanol groups on the silica surface
S- Specific Surface
Si-O-Si - surface siloxanes
0- characteristic relaxation time
Tc- Crystallization Temperature
Tg- Glass Transition Temperature
Tg(endset)- Glass Transition Temperature endset
Tg(midpoint)- Glass Transition Temperature midpoint
Tg(onset)- Glass Transition Temperature onset
Tg,t=100 s- Dielectric Glass Transition at a Relaxation Time of 100 s
Tm- Melting Temperature
To- Vogel Temperature
infrared stretching vibration
asasymmetric infrared stretching vibration
ssymmetric infrared stretching vibrations
VFTH- Vogel-Fulcher-Tamman-Hesse
Vp- Total Pore volume
- angular frequency
– torsion vibrations infrared
𝜀′(𝜔)- Real part of the complex permittivity
1 Introduction
1.1 Motivation
For a long time now, drug solubility has been a topic of interest for research and
development in the pharmaceutical industry. Low water solubility is a common characteristic of many pharmaceutical drugs, therefore requiring an intake of higher
dosage, so the essential levels for treatment are reached in the blood.1 with a consequent
negative impact in the environment2 and on the cost of marketed drugs.
The process of drug development is complex and requires many phases and steps.
World researches to have success in their investigation must make a highly specific drug, with high affinity to its biological targets to reduce the probability of undesired side
effects. This is the stage where attempts are made to improve drug solubility, not compromising pharmacokinetics and pharmacodynamics. There are many approaches
been taken in consideration to improve drug’s solubility, some examples are:
amorphization, micronization, crystal modification, etc.3
This assignment focus in the amorphization of a poor water soluble crystalline drug (naproxen). The strategy is, by incorporating it in two silica (MCM-41and functionalized
MCM-41), its dissolution rate and bioavailability will improve.
1.2 Naproxen
(S)-(+)-6-Methoxy--methyl-2-naphthaleneacetic acid, more commonly known as
naproxen is a pharmaceutical drug that acts as an anti-inflammatory nonsteroidal with analgesic and antipyretic properties.4,5
Naproxen is an enantiomeric drug, being the enantiomer S, the one used for health treatments and the enantiomer R is toxic. The structure of the drug is formed by two
aromatic rings and a carboxylic acid having a pKa of 4.15.5 Naproxen is most commonly
used for the treatment of rheumatic diseases and acute painful procedures.Due to some
2
1.3 Bioavailability and Biopharmaceutics Classification System (BCS)
Bioavailability quantifies the rate in which the drug is absorbed and the fraction of the
unchanged drug that was taken in that will reach the systemic circulation.6
Characteristics as permeability and solubility are extremely important in the
determination of drug’s oral bioavailability. For many pharmaceutical drugs, solubility is
a challenge, as it is so difficult to develop proper formulation for oral administration.7
Dissolution is extremely important when it comes to the rate-determining step in the pharmaceutical drug absorption. Bioavailability in this case is contrariwise related to the
distribution of particle size when pharmaceutical drugs present properties like, low solubility, and dissolution rate.8 It is intended that by increasing solubility, bioavailability
will increase too.9 So, many tactics are being developed with the drive to enhance the
solubility, dissolution rate and oral bioavailability of poorly water drugs.10
The purpose of the Biopharmaceutics Classification System was to gather information
on in-vitro dissolution and in-vivo absorption, by associating this information different drugs could be classified.11
The BCS is a mathematical model that measures solubility and permeability under exact
conditions.11 Characteristics as aqueous solubility relating do dose and intestinal
permeability in combination with dissolution properties are the base of classification of
drugs into four classes.11 The classes are the following: class I contains all the drugs that
have high solubility and permeability due to strategy. In classes III and IV the drug´s bioavailability is conditioned by its permeability. Drugs in class II, the case of naproxen
(under study), are poorly soluble. Naproxen’s solubility is 1.26 g/L (25 ºC)4, which is very
low, so, the aim is to improve its solubility in the aqueous medium.
Figure 1. Representation of naproxen molecular structure. * indication of the chiral
Table 1. Representation of the Biopharmaceutics Classification System. 11
The system can classify the drug in its early stages, which is an important factor, as it can influence the decision to continue studying the drug or not. The system has gained
more and more importance nowadays.11
1.4 Crystals and Amorphous Materials
Solid matter can be classified as crystalline, amorphous or a mixture of the two. In crystalline solids, atoms are arranged in a long-range order in a three-dimensional space.
On the other hand, amorphous solids show no organization, it only exists local order of atoms, due to the interactions between them. Amorphous materials are defined as
non-crystalline, because atoms do not show an organized pattern12 (figure 2).
Class Solubility Permeability
I High High
II Low High
III High Low
IV Low Low
4
Such characteristics, as disorder, give amorphous properties as a higher Gibbs free energy, a faster solubility and dissolution rate, resulting in an increase in therapeutic activity, by comparing these two types of solids. However, a higher entropy, enthalpy
and Gibbs free energy make amorphous solids less stable and act as a driving force to the occurrence of crystallization.13
Crystallization is a known first-order transition (it has latent heat associated), so the
temperature will not change until the transition is completed.14 As an exothermic reaction,
passing to a more stable state, crystallization is a combination of two steps.Nucleation
and crystal growth.15For thistransition to happen, a nucleus is required for the crystal to
grow, if nucleus is present than the material during cooling becomes a glass. The nucleus
is either homogeneous or heterogeneous. If the nucleus is homogeneous, the crystal will form spontaneously during melting, if it is heterogeneous forms a pre-existing surface of an impurity.15
Figure 3. Demonstration of nucleation rate, Jnucleation, and rate of crystal growth, Jgrowth,
in respect to temperature. Tg is the glass-transition temperature, Tm is the melting
1.5 Phase Transitions
Phase transitions happen when a material changes from a state (ex. solid, liquid or gas) to a different state. This happens at a combination of certain conditions, temperature and
pressure. Examples of very familiar transitions are: condensation, vaporization… However there are those less known as: solid-solid, etc. As it can be seen, there are
many different types of phase transitions, each with their own specific characteristics and they can be classified agreeing to their thermodynamic properties.16
In first-order phase transitions, the energy that is supplied, turns into latent heat, this
occurs at a stationary temperature, until the transition is concluded. The difference in enthalpy, volume, entropy is finite at this fixed, specific temperature. The first derivative
of these measures with respect to temperature is discontinuous. Examples of first-order transitions are melting, boiling and crystallization.16
In second-order transitions regarding temperature, the first derivative is continuous and the second is discontinuous. The same properties as given above, enthalpy, entropy and
volume do not change.16
Figure 4. Thermodynamic properties changes in a) first order phase transitions and
6
1.5.1 Melting
Melting is a first order transition, and when it occurs, the substance becomes more disorder, in a liquid-like form.14Many things are happening to a material while its melting,
as: disorder increases (endothermic process having a melting enthalpy Hm associated
with it)14. The volume and heat capacity always changes. The heat capacity is defined
as the quantity of heat that is required to raise the temperature of an identified system by one degree.17
The process of melting can only take place if the substance is crystalline. The theory
says that melting occurs by an instability created as temperature increase, in the crystal lattice structure. 14
1.5.2 Glass Transitions
Having a continuous first derivative and a discontinuous second derivative, glass
transition is classified as a pseudo-second-order transition as it does not happen between two states of thermodynamic equilibrium18, so it’s not considered a true phase
transition because there aren’t discontinuous changes in the physical properties.19This
so-called transition, can only happen in amorphous material, as it has no latent heat
associated and where enthalpy, volume and entropy change continuously.19
The glass transition takes place, when a liquid is being cooled below the melting point, fast enough that it can dodge crystallization to enter in a supercooled state. As the system gets cooler and cooler, undergoes solidification due to the increase of viscosity
it’s molecular mobility slows down19 to turn into a glassy substance. This transition has a
Cp (heat capacity) associated, and it occurs over a range of temperatures, (Tg,onset,
Tg,midpoint and Tg,endset) see figure 5. This characteristic behavior of the glassy material
The characteristics of the glass are dependent on the rate at which is formed. So, it
doesn’t fall out of the liquid-like equilibrium, a slower cooling treatment is applied, giving
enough time for configurational arrangement at each temperature, consequently
originating a glass transition at lower temperatures.19 (See figure 6)
This state (glassy), is out of equilibrium, therefore it has a spontaneous tendency to
convert into a more thermodynamically stable form, consequently recrystallization can occur, above or below Tg, making it interesting and fundamental to study strategies to
avoid this trend.19
Figure 5. Representation of Tg from a DSC scan, idientification of onset, midpoint
and offset or endset.
Figure 6. Representation of temperature dependence on enthalpy and volume. Tga is
the glass transition temperature formed from a slow cooling rate and Tgb from a faster.
8
1.6 Silica MCM-41
The MCM-41 (Mobil Composition of Matter No. 41) is a favourable member of the mesoporous silicate family and of the aluminosilicate materials.21,22 The MCM-41 has a
regular pore system, consisting of hexagonal display and shaped pores, as well their highly specific pore volume (up to 1.3 ml g-1)21 and surface are (up to 1500 m2 g-1)21,
make them so promising for many uses, as drug carriers. 23 When silica is used in such
a way, the drug is loaded and then locally released in a controlled way, providing a
precise delivery to the target site. 22
Modifying (functionalizing) the silica pore inner walls, can have a crucial role, as by changing the surface it can alter the binding strength, consequently having an impact on
the release rate.24–26 These aspects keep increasing the interest of researchers and
industry in these materials.
The term known as controlled release is given to an experiment that studies the performance or delivery of a compound in response to time or stimuli.8 These
experiments are normally tested under conditions that will try to simulate body features, so, that they can mimic the period of release and how it is released in the bloodstream.8
1.7 Techniques
1.7.1 Attenuated Total Reflectance Fourier Transform Infrared Spectroscopy
(ATR-FTIR)
Infrared (IR) spectroscopy is a very well-known and extremely reliable fingerprinting
technique, as it can identify, characterize and quantify many substances; solids, liquids and gases. The spectrometers, use infrared radiation to analyse the samples by the
The technique of attenuated total reflectance (ATR), is a modernization of analyses for liquid and solid samples. In the traditional IR, solid samples preparation involves crushing the substance to a fine powder and dispersing it into a matrix. The compound being
analysed is either mixed with a liquid or a solid, potassium bromine (KBr) is probably the most widely used. The mixture is then pressed, turning into a clear glassy disk, ready to
be analysed in the spectrometers. Liquid samples are more commonly analysed as thin films in cells, the cell consists of two infrared transparent disks. Sample preparations are
easier for liquid samples than solid ones, however both type of samples cannot be used again.27
The attenuated total reflection accessory works by measuring the variations that happen
when the beam encounters the sample. This beam is directed onto an optically dense crystal with a high refractive index for a specific angle, this internal reflectance will create an evanescent wave that will reach beyond the surface of the crystal into the sample,
and it will seat on the surface of the crystal. This wave projects only a few microns beyond the crystal wall into the sample, therefore there must be good contact between both. The
evanescent wave will suffer changes (altered or attenuated) in the regions of the spectrum where the sample absorbs energy. This attenuated or altered energy return to
the beam, in the opposite end of the crystal, passing through the detector, where the system generates an infrared spectrum.27
So, to have good results with this accessory, there are two important aspects to take in account. The sample being analysed must be in direct contact with the crystal while the
evanescent wave only reaches a very small distance of 0.5 - 5 27 past the crystal. The
second aspect is that the refractive index of the crystal must be greater than the one from the sample, otherwise internal reflectance does not happen, so instead of being
10
1.7.2 Thermogravimetric Analysis (TGA)
The technique of thermogravimetric analysis consists in the examining of a mass sample
over time or temperature, the substance is exposed to a controlled atmosphere and temperature program. This means, the TGA controls the weight of the sample being
analysed as it is cooled or heated. Thermogravimetric analysis is very used to characterize a variety of materials in various sectors as environment, pharmaceutical,
petrochemical and food industries.28
The sample goes into a pan supported by a precision balance. The pan will stay in a furnace and depending on the type of experiment it will be cooled or heated. The weight
of the pan (sample) is being monitored all the time. The control of the atmosphere is done by using sample purge gas.28
Through this technique, it is possible to quantify the amount of mass that remained and
the amount of mass that degraded. The loading percentage of the matrix is calculated with the given equation:
% 𝐿𝑜𝑎𝑑𝑖𝑛𝑔 =𝑀𝑎𝑠𝑠 𝑜𝑓 𝑁𝑎𝑝𝑟𝑜𝑥𝑒𝑛+𝑀𝑎𝑠𝑠 𝑜𝑓 𝑆𝑖𝑙𝑖𝑐𝑎 𝑀𝑎𝑠𝑠 𝑜𝑓 𝑁𝑎𝑝𝑟𝑜𝑥𝑒𝑛 𝑋 100 Eq.1
1.7.3 Scanning Electron Microscopy (SEM)
A scanning electron microscope is uses a beam of high-energy electrons, that will emit a variety of signals when encountering the surface of the solid material being analysed. The interactions that are created between the electrons and the surface reveal
information about the solid sample like: the texture, the orientation about the materials and its crystalline structure. When the data is being gathered, most of the time, is
obtained over a chosen area to generate a 2-dimentional image that displays the properties all the characteristics mentioned above.29,30
1.7.4 Transmission Electron Microscopy (TEM)
TEM is a technique where a beam of electrons is transmitted through an extremely thin sample, the thickness of the sample is about 100 nm. The interactions between the
sample and beam create an image. This image will then be magnified onto a fluorescent screen or others. This type of microscope can capture extremely small detail as a single column of atoms. TEM is an extremely useful analytical method in chemistry, biology and
physics. An example it has some applications in cancer studies.31
1.7.5 Differential Scanning Calorimetry (DSC)
Differential Scanning Calorimetry is a technique which studies thermal transitions, as solid-solid, solid-liquid transitions, among others. It measures a chemical or physical
change, when energy is transferred as heat to or from the sample being studied. During these analyses, it is possible to understand what is happening to the material, even if
there are no visual changes. This is done, by comparing the behaviour of the sample with a reference material, which does not undergo any physical changes during the time
of the analysis. 14
In the apparatus, there are two pans that are isolated from the surroundings. One of the
pans is the reference pan, that is empty, and the other contains the sample being
12
change is the same for the reference pan and the sample pan. The heat flow, that is the
rate of thermal energy (Q/t) being supplied to both pans does differ, because the heat
capacity is different since one pan is empty (reference) and the other pan contains the
sample being examined. This difference in the heat flow between both pans is plotted against temperature.17,32
As it was previously mentioned, the heating rate (T/t) is set, and the heat flow (Q/t)
is measured as endothermic (melting) or exothermic (crystallization) peak (see figure 9). The values of enthalpies associated with melting and crystallization are calculated by integrating the area of respective peaks. Glass transition, on the other hand, is identified
as a step in the thermogram. Through the slope of the glass transition step, the change
in the heat capacity (Cp) can also be calculated by dividing the heat flow by the heating
rate (see equation 2).17,33
(Q⁄t) (T⁄t)=
Q
T=Cp (J ºC-1) Eq. 2
The calorimetric apparatus divides the heat capacity by the mass of the sample,
providing the specific heat capacity.
Cp
𝑚 =Cp (J ºC
-1 g-1) Eq. 3
Figure 8. Diagram representation of the heat-flux of differential scanning
1.7.6 Nuclear Magnetic Resonance (NMR)
SS-NMR, or solid-state nuclear magnetic resonance is a technique that delivers information about the structure of molecules to an atomic level, and nowadays it is
applicable in almost all scientific fields. To obtain in a detailed information as solution-nuclear magnetic resonance, additional techniques are required for ss-NMR as
magic-angle spinning (MAS) and cross-polarization (CP), between others.34
The MAS involves the rotation of the sample 54.74 º with respect to the magnetic field, so that anisotropic dipolar interactions are diminished. For this technique to be effective,
the spinning must happen at the same or higher rate than the dipolar linewidth. The CP, cross-polarization technique implicates the displacement of polarization from some more
abundant nuclei (as proton) to some lesser common ones (as carbon), with the purpose of enhancing the reason signal/noise.35
29Si ss-NMR coupled with cross-polarization and magic-angle spinning is a very
consistent technique to quantify the nature of solid silica matrixes, specially of
amorphous silica.36 Through this type of spectrum, it is possible to distinguish different
silanol groups; geminal (Q2) with a peak at -92 ppm, vicinal or isolated (Q3) at -101 ppm
and surface siloxanes (Q4) at -110 ppm.36–38
Figure 9. Differential Scanning Calorimetry profile with exothermic and endothermic
14
In the silicas being studied, the expected results from the analyses of the modified
one, a reduction in Q2 and Q3 peaks and an increase in Q4 intensity.
The 13C NMR aids by giving supplementary information on the alkyl groups bonded on
the surface of the modified matrix, indicating a successful functionalization.34
1.7.7 Dielectric Relaxation Spectroscopy (DRS)
From the dielectric relaxation technique, it can be studied the dipole relaxation caused by the reorientation motions of molecular dipoles and the originating electrical conduction due to the translational motion of electrons and ions, in a range of frequencies of 10-6 to
1012 Hz.39
When a non-conductor sample, that must contain permanent dipoles, is under an oscillating electric field a net polarization is caused.39,40Atoms combine by sharing one
or more electrons to form a molecule. As this combination is being formed, the rearrangement may origin an unequal dispersion of electrons, forming a so called dipolar
moment. This dipolar moments are not organized in precise order, instead they have a random distribution, but when they are submitted to an electric field, a re-orientation of
the dipoles occurs so they align with the field, therefore causing polarization.39,40 By
reversing the electric field, once more the dipole rearranges itself to stand the alignment,
while reorientation happens, energy is lost.39,40
Figure 10. Attributed Qn nomenclature to the different silanol groups on the silica
Permittivity (*) is the measure of the quantity of charge needed to generate an electric
field at a specific medium. The amount of energy that is gathered in the dielectric material
from the external electric field is known as the real part of permittivity (’).40 The energy
being lost from the dielectric substance is the imaginary part of the permittivity (’’). The
’’ is always greater than zero40 and the greater it is, the more energy is being dissipated
(lost), therefore leaving less energy available to the dipole re-orientate. This is linked to the intrinsic loss of the system, and it is recognized as the dielectric loss. 39
The complex dielectric permittivity function is given by:
*() = ’()- i’’() Eq.4
Where:
• is the angular frequency of the applied electric flied
• ’ (): is the real part of complex permittivity, quantifying the polarization stored
by the system, given by the ratio between the sample capacitance C, and the
capacitance when the measuring cell is vacuum filled, C0, so ´ = C/C0
16
When the frequency of the applied field is low, dipoles have time to align with the electric field. However, as frequency increases, dipoles become unable to follow the oscillating filed. Increasing the frequency, increases the imaginary part, and a maximum value will
be achieved at fmax. This maximum peak of ’’ is related to the characteristic relaxation
time. The relaxation time (), is the time needed for the displaced system aligned with
the electric field to restore its random distribution of equilibrium by an amount of 1/e
(where e is the Neper number), after the electric field is removed.39,41
The higher the temperature at which each spectrum is collected, the more mobile dipoles
are and therefore, higher fmax. This maximum ’’-peak frequency is related to the
characteristic molecular relaxation time, , measuring dipoles mobility in a material.40,41
Therefore, the relaxation time is estimated from the frequency location of the maximum dielectric loss peak through the following equation39:
max= 1
2(2 ∗∗ 𝑓max) Eq. 5
In conventional glass, former systems, i.e., materials that avoid crystallization, entering in the supercooled state and vitrifying upon further cooling, the molecular mobility can be
probed by dielectric spectroscopy near above and below the glass transition. In this dynamical range, the characteristic relaxation times fit within the frequency range of
routine dielectric spectroscopy (10-2 to 106 Hz). Since amorphous materials are
dynamically heterogeneous, even when only one dipole type is present, regions from
high mobile and low ordered to low mobile and highly ordered and combinations in
between coexist, a distribution of relaxation times instead of a single , is needed to
adequately describe the system. Experimentally, spectra are collected over a frequency
window and covering a temperature range, but each one is acquired at a constant
temperature, at which different molecular motions associated with distinct relaxation processes can be active. Therefore, to proper simulate each spectrum, a sum of relaxation processes may be needed. The most popular, although empirical, model
∗=+ ∑ 𝑗
(1+/(𝑖0)𝑗)𝑗
𝑛
𝑗=0 Eq.6
Where:
•
: optical dielectric constant (real permittivity at infinite frequency)
•
: dielectric strength
•
0: characteristic relaxation time
•
: angular frequency
•
and
: describe the symmetry and asymmetry broadening the spectrum,
within a range 0
1 and 0
.
1.
42The different relaxation processes active simultaneous at a definite temperature can exhibit distinct temperature dependencies. While very localized mobility is temperature
activated – Arrenhian (linear) temperature dependence, some cooperative processes, as the glass transition, have a linear dependence on temperature, following a
non-Arrhenius law. This nonlinear dependence is described by the Vogel-Fulcher-Tamman-Hesse (VFTH) equation, that is shown below39:
(T) =∗ 𝑒(𝑇−𝑇𝑂𝐵 ) Eq.7
where:
• : relaxation time at a high temperature limit • B: parameter specific to each material • To: Vogel temperature
To obtain the glass transition temperature, and since is not a true transition in the usual thermodynamic sense, it is required some criteria to identified it, as the temperature at
which the relaxation time, becomes 100 s. The reason for this value, derives from the
Maxwell relation.39
(𝑃𝑎𝑠−1) =
𝑚𝑎𝑥 (𝑠) ∗ 𝐺(𝑃𝑎) Eq. 8
Where:
• max: relaxation time to 100 s
• : viscosity of a solid • G: the shear stress
18
The substitution of =100 s it in the VFTH equation, allows to estimate the so-called
dielectric Tg. 39
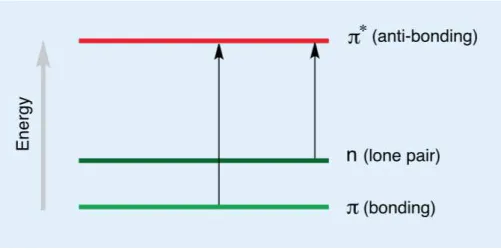
1.7.8 Ultraviolet Spectroscopy (UV-Vis)
When electrons are excited from a lower level into a higher level, visible and ultraviolet radiation are absorbed or transmitted. In both, visible and ultraviolet radiation the electron
is excited from a full orbital (low energy) to an empty, anti-bonding orbital (high energy), becoming excited. Each wavelength has an energy coupled with it, so if the precise
amount of energy is supplied to make the electronic transition, then the wavelength will be absorbed. The bigger the difference between the energy levels, more energy is required to move the electron. So, the higher the energy, the higher frequency and the
shorter the wavelength will be.43
This type of spectroscopy allows the determination of sample’s concentration and rate equations, dissolution rates and the study of reaction rates, as many others.
UV-spectroscopy is widely used in quantitative analyses for all the molecules that absorb in ultraviolet and visible electromagnetic radiation. 43,44
2 Methods and Materials
2.1 Synthesis of Mesoporous MCM-41
2.41 g of n-hexadecyltrimethylammonium bromide (C16 TMABr) was weigh and dissolved
in 10.46 ml of aqueous ammonia (25 wt. %, 0.14 mol) and in 120 ml of deionized water, to obtain a concentration of 0.055 mol L-1. The solution was under stirring for about one
hour, until there was no foam left. 10 g of TEOS (tetraethoxysilane, 0.05 mol) drop by drop was added to the surfactant solution, still under stirring, it stayed like that for one
hour. The white precipitate formed was washed with 100 mL of deionized water and removed by filtration under vacuum. The sample was left to dry at 90 ºC for nineteen
hours. It was then heated to 550 ºC at 1 ºC/min for nine hours, to remove the template.
21
20
2.2 Functionalization of the Mesoporous Silica MCM-41
0.504 g of the MCM-41 were weigh in to a small flask and left in an incubator oven at 100 ºC all night. 150 ml of dry toluene were previously prepared by using molecular
sieves (activated by being heated up to 300 ºC for one hour) and sodium lumps, which create bubbles when there is still water present. The sample of MCM-41 was removed
from the incubator oven to a three-neck round bottom flask. 2.5 ml of methyltrimethoxysilane and 150 ml of dried toluene were added in to the three-neck
round bottom flask. One of the necks of the three three-neck round bottom flask was connected to a nitrogen hose, the second one was connected to a condenser and the
third neck was closed with a glass stopper. The solution was left under stirring in an oil bath at the temperature of 80 ºC for a period of five hours. The solution was then filtered
and washed with 50 ml of dry toluene and ethanol. Finally, it was left to dry overnight in an oven at the temperature of 100 ºC.24,45
2.3 Textural analyses of MCM-41 and MCM-41 Functionalized by Nitrogen
Absorption Analysis
Both matrixes were characterized and analyzed by nitrogen porosometry in the
Laboratório de Análises/Requimte of the Chemistry Department of NOVA
University of Lisbon. Nitrogen absorption isotherms were measured at -196 ºC.
Before the analyses the sample was outgassed at 200 ºC under vacuum for 1
hour. The following textural properties were obtained:
Table 2. Textural properties of MCM-41 and MCM-41 functionalized.
a) The specific surface area (S) was determined from linear portion of the
Brunauer-Emmett-Teller (BET) plots
b) The specific total pore volume (Vp) by density Functional Theory (DFT) method
c) Pore size distribution (Dp) was determined by the Barret-Joyner-Halenda (BJH desorption)
2.4 Drug Loading
To incorporate naproxen in the silica, it was first necessary to remove water and impurities that could exist in both silica. 159 mg of MCM-41 and 152 mg of
MCM-41-Func were weighted into glass cells and were submitted to vacuum, 5 mbar and emerged in a paraffin bath to be heated for seven hours (temperatures between 140 ºC up to 170
ºC). The samples were then left to cool down for 30 minutes before inclusion.
Sample SBETa/ m2 g-1 Vpb/ cm3 g-1 Dpc/nm
MCM 41 986.1685 0.74117 3.0
MCM 41_Func 944.7177 0.70630 2.9
22
To estimate the amount of naproxen for inclusion, the filling percentage was calculated
by using silica’s pore volume and naproxen’s density in the following equation:
% 𝐹𝑖𝑙𝑙𝑖𝑛𝑔 =
𝑛𝑎𝑝𝑟𝑜𝑥𝑒𝑛 (𝑔) 𝑛𝑎𝑝𝑟𝑜𝑥𝑒𝑛 ( 𝑔𝑐𝑚3)
𝑝𝑜𝑟𝑒 𝑣𝑜𝑙𝑢𝑚𝑒 (𝑐𝑚3𝑔 ) ∗ 𝑠𝑖𝑙𝑖𝑐𝑎 (𝑔)∗ 100 Eq. 9
The mass was calculated to a filling of 80 and 75 % for MCM-41 and MCM-41_Func
respectively, so, there wouldn’t be any naproxen outside pores. The masses of naproxen were dissolved in 1 ml of chloroform, and with the glass cells still under vacuum, they were added to each sample of silica. The resulting composite was left to dry for
forty-eight hours at 50 ºC, under stirring with two magnetic bars, until all the chloroform had evaporated. After the two days, the mixtures were removed from the glass cells, and
stored in eppendorfs.
2.5 Scanning Electron Microscopy (SEM)
The samples were analysed by Microlab, Electron Microscopy Laboratory in Instituto Superior Técnico de Lisboa. The morphology of the sample was observed by using a
high-resolution scanning electron microscope Hitachi-S-2400/Bruker.
2.6 Transmittance Electron Microscopy (TEM)
The samples were analysed by Microlab, Electron Microscopy Laboratory in Instituto
Superior Técnico de Lisboa. The morphology was observed by using a high-resolution electron microscope Hitachi H8100/ThermoNoran System SIX.
2.7 Thermogravimetric Analyses (TGA)
The TGA analyses was used to evaluate the percentage of loading of naproxen in each
silica. These analyses were realized by Centro de Investigação de Materiais (CENIMAT). About ~5 mg from each sample were placed in an open aluminium pan. The thermogravimetric measurements were carried out from room temperature to 550 ºC in
the device Simultaneous Thermal Analyser (TGA-DSC – STA 449 F3 Jupiter) from Netzsch, the heating rate was of 50 ºC.min-1. The sample was under pure nitrogen
were calibrated using Curie points of nickel standard, while the mass reading was calibrated using a balance tare weights from TA.
2.8 Attenuated Total Reflectance Fourier Transform Infrared Spectroscopy
(ATR-FTIR)
The device used was a PerkinElmer Two IR Spectrometer. A small quantity of the samples, each at a time was placed onto the diamond crystal area and the pressure arm of the device was positioned over the sample. Pressure was applied pushing the sample
onto the diamond surface to achieve the best resolution possible. The spectra were obtained by Spectrum 10 software, also from PerkinElmer. The samples were analyzed
in the 400 to 4000 cm-1 spectrum range with 16 scans of resolution.
2.9 Nuclear Magnetic Resonance (NMR)
Solid state 13C MAS and 29Si MAS NMR spectra were acquired in a 7 T (300 MHz)
AVANCE III Bruker spectrometer operating respectively at 75 MHz (13C)
and 60 MHz (29Si), equipped with a BBO probehead. The samples were spun at the
magic angle at a frequency of 10 kHz in 4 mm-diameter rotors at room temperature. The 13C MAS NMR experiments were acquired with proton cross
polarization (CPMAS) with a contact time of 1.2 ms, and a recycle delay of 2.0 s.
The 29Si MAS NMR spectra were obtained using a single pulse sequence with a 90°
pulse of 4.5 μs at a power of 40 W, and a relaxation delay of 10.0 s.
2.10 Different Scanning Calorimetry (DSC)
All the samples were analysed by DSC: native naproxen, both empty matrixes, MCM-41 and MCM-41_Func and the respective composites. In a precision balance (Sartorius
Research M-power), an aluminium pan and lid (TA Tzero Hermertic Lid and Tzero Pan) were weighed for each sample. The average of the mass samples should be about 2-5
mg. All pans are sealed before the analysis. The masses of pans, and samples were noted for future calculus.
Before the analysis in the DSC, the pans are perforated with a pin to ease water/ solvent
24
(thermal procedure) and the respective masses (pan, reference pan and sample) era introduced in the software that controls the equipment. Data is analysed using the Universal Analysis 2000 software provided by TA Instruments Inc. The software
calculates the values of enthalpy change and respective temperatures, heat capacity change and glass transition temperatures (all of this are collected in triplicate to decrease
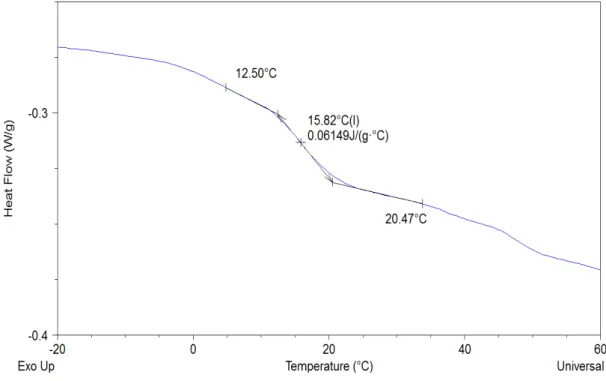
operator’s error). An example of how the glass transition temperatures are collected, is
shown in figure 16.
Figure 16. Illustration of how the temperatures are extracted at onset, midpoint
and endset of glass transition.
Thermal treatments applied to the samples being studied are shown below:
0 10 20 30 40 50 60 70 80 90 100
-100 -50 0 50 100 150 200
Te
mperatu
re (ºC)
Time (min) b)
Figure 17. Thermal treatment applied to a) native naproxen and b) both silicas, in red
heating cycles and in blue cooling cycles.
0 20 40 60 80 100 120 140
-100 0 100 200
Te
mperatu
re (ºC)
2.11 Dielectric Relaxation Spectroscopy (DRS)
A sample of both composites, MCM-41 and MCM-41_Functionalized, loaded with
naproxen was placed between two gold-plated electrodes of parallel plate capacitors,
BDS 1200 with two silica spacers (50 m of thickness). The sample cell was placed on
a cryostat, BDS 1100. The enclosed sample was submitted to a gas stream that came from the evaporation of liquid nitrogen, causing it to change temperature. Temperature
control was ensured by Quarto Cryosystem and performed with 0.5 K. The software NovoControl Technologies GmbH supplied all the modules.
0 100 200 300
-100 -50 0 50 100 150 200 Te mperatu re (ºC) Time (min)
Figure 18. First Thermal treatment applied to both loaded composites in red
heating cycles, in blue cooling cycles and in green annealing cycle.
Figure 19. Thermal treatment applied to a) MCM-41 loaded with naproxen, b)
MCM-41_Func loaded with naproxen, in red heating cycles, in blue cooling cycles
and in green annealing cycles.
0 50 100 150 200 250 300 350
-100 -50 0 50 100 150 200 Te mperatu re (ºC) Time (min) b)
26
The measurements of dielectric relaxation were carried out using the Alpha-N independence analyzer from NovoControl technologies GmbH, covering a frequency range from 10-1 to 106 Hz.
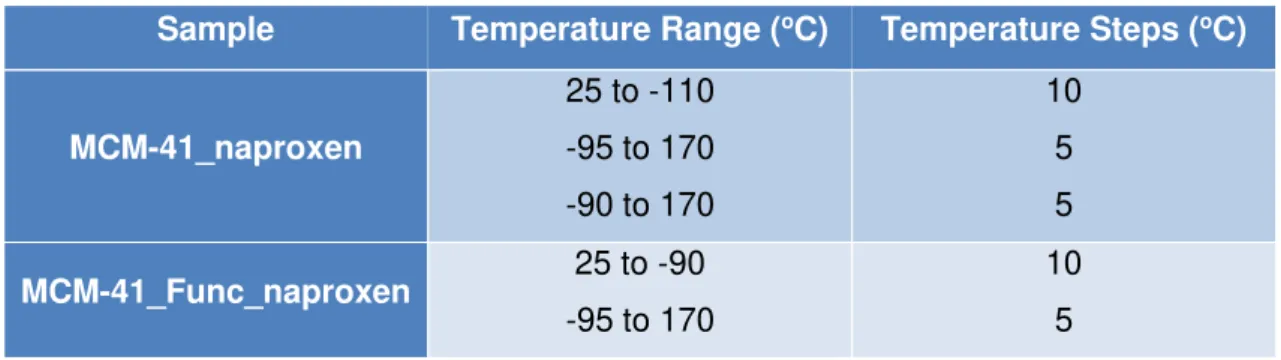
Both samples were submitted to a range of temperatures between -95 ºC to 170 ºC. To
remove water/solvent evaporation from the sample, the last temperature for each first cycle was collected five times, ensuring that in the second heating the sample was
completely dry.
Table 3. Temperature steps and range of dielectric measurements at which
isothermal spectra were collected for both composites.
Data was analyzed and treated using WinFit and OriginPro Software using VFTH equation (see equation 7).
2.12 Control Release Experiments
Before all dissolution and control release trials were realized, a calibration curve is
needed to quantify naproxen’s concentration. Ten different naproxen’s concentrations
(0.1, 0.25, 0.5, 1, 2, 4, 5, 6, 8 and 10 mg L-1) in buffer solution were prepared and
measured over a wavelength range from 190 to 400 nm. Calibration curves were constructed by choosing 6 different wavelengths: 262, 272, 282, 330, 331 and 333 nm
(see calibration curves in annex). The obtained linearity (r2 > 0.99 for all the 6 chosen
wavelengths) confirms the applicability of the Beer’s law in the studied concentration
range.
To simulate naproxen’s dissolution rate, trials were realized by placing 1.0 mg of
naproxen in 200 mL of phosphate buffer solution (concentration of 5 mg L-1) at a pH= 6.8
Sample Temperature Range (oC) Temperature Steps (oC)
MCM-41_naproxen
25 to -110 -95 to 170
-90 to 170
10 5
5
MCM-41_Func_naproxen 25 to -90
-95 to 170
(this is to simulate intestinal fluid, where naproxen is absorbed). The assays were performed in glass flasks in an Optic Ivymen System constant temperature incubator shaker (Comecta SA) regulated to 37 ºC (human body temperature) and 100 rpm.
In naproxen release experiments, calculi were done, to assure that the quantity of
composite had the same amount of naproxen as the dissolution trials. Therefore, 1.0 mg of naproxen plus the mass of silica was placed in the phosphate buffer solution (200 ml).
For every sample being analyzed (native naproxen, 41_Naproxen and MCM-41_Func_Naproxen), the experiment was repeated three times, to decrease operators
error.
An average of the concentration values obtained from the 6 calibration curves were used to estimate the concentration in the dissolution process.
2.13 Ultraviolet-Visible Spectroscopy (UV-VIS Spectroscopy)
The sample absorptions were measured by UV-Vis at the wavelength range between
400 and 190 nm in quartz cells. The spectrometer was a Thermo Scientif Evolution.
150 200 250 300 350 400
-0.25 0.00 0.25 0.50 0.75 1.00 1.25
A
bs
o
rva
nce
Wavelength(nm)
3 Results and Discussion
3.1 Scanning Electron Microscopy (SEM)
From scanning electron microscopy, information about MCM-41, unloaded and loaded
samples morphology was obtained.
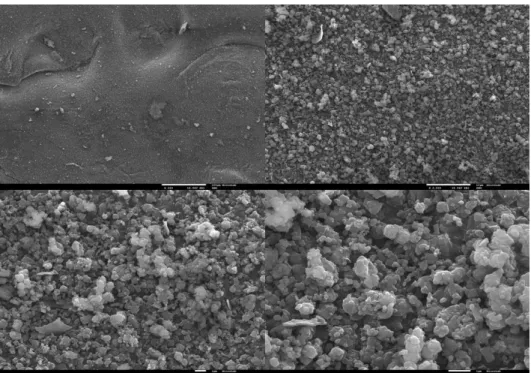
Figure 21. SEM Images of unloaded MCM-41. On the left, the image with an
amplification of 200x and on right with 10.000x.
Figure 22. SEM images of loaded MCM-41. Top left 200x, top right 2.000x, bottom left
30
As expected, the morphology of the MCM-41 silica is nearly spherical shaped, as is observed in the figures above (20 and 21). The aggregates formed from the silica particles are composed from regular particles and irregular ones.22
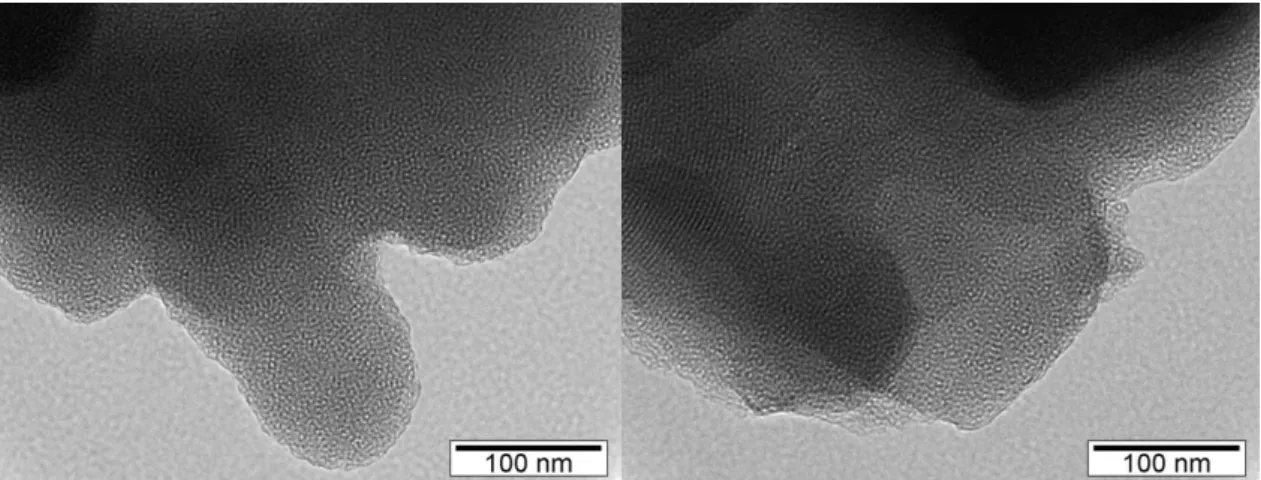
3.2 Transmission Electron Microscopy (TEM)
TEM images with textural characteristics of MCM-41 unloaded and loaded with naproxen are
shown below:
Figure 23. TEM micrographs of unloaded MCM-41.
Figure 24.TEM micrographs of loaded MCM-41 with naproxen.
In the micrographs exposed above (figures 23 and 24), the order of mesoporous material is apparent. Also, it is perceptible the hexagonal shaped mesoporous with alternating
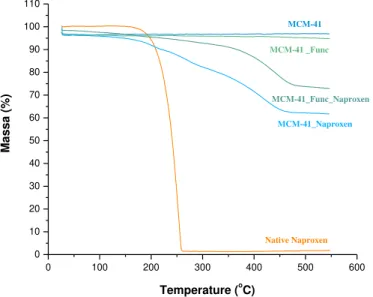
3.3 Thermogravimetric Analysis (TGA)
TGA analysis for both matrixes, unloaded and loaded and for native naproxen is presented below figure 25.
The unloaded matrixes MCM-41 and functionalized MCM-41 are thermally stable in the
range of temperatures set in the apparatus; the small variances in both masses are due to water/solvent evaporation. In the modified silica, a small decomposition is observed ~350 ºC, due to the degradation of the organic functional groups.46 The values for water
content in both silica and respective composites, were obtained by subtracting the mass percentage at 150 ºC from the initial mass percentage.46 For the organic functional
groups in MCM-41_Func determination, the mass percentage loss was obtained in the range of 150 ºC and 550 ºC.46 To calculate the loading percentages, equation 9 was
used. These values are shown in table 4.
As the matrixes are stable in the programmed temperature, the only mass variation
observed for the composite belongs to naproxen. Native naproxen is stable up to ~165 ºC (orange solid line 24), after starts do degrade in a single step, ending before ~275 ºC.
From the thermogram of loaded matrices, naproxen becomes more thermal resistant when incorporated in the silica. The mass loss occurs in a multiple-step profile for the
0 100 200 300 400 500 600
0 10 20 30 40 50 60 70 80 90 100 110
MCM-41 _Func
MCM-41_Func_Naproxen
Massa (%)
Temperature (oC)
MCM-41_Naproxen
MCM-41
Native Naproxen
Figure 25. TGA plots for native naproxen (orange), both unloaded MCM-41(dark blue)
and MCM-41_Func (light green) and the respective composites (light blue and dark
32
one. The derivative plot shown in figure 25, demonstrates this multiple-step profile,
giving evidence that the decomposition of naproxen is not linear.
4This behaviour is
attributed to bulk-like molecules (lower temperatures), and naproxen molecules which
interact with pore walls (higher temperatures).
4Using the equation 1 already mentioned before, the loading percentages of naproxen in
the composite for MCM-41 and functionalized MCM-41, are 38.32 % and 27.09 % respectively. The percentage of naproxen in the silica for MCM-41 is 62.13 % and for
functionalized MCM-41 is 37.16 %. The loadings for the MCM-41 are more compatible with the initial mass weight (80 %) used for loading, while the results for the functionalized
MCM-41 are lower. This is probably due to a lower vacuum applied during the loading experiments for the latter.
Figure 26. Derivative plot of native naproxen (orange), both loaded MCM-41 (bluw)
and MCM-41_Func (green).
0 100 200 300 400 500 600
-3,5 -3,0 -2,5 -2,0 -1,5 -1,0 -0,5 0,0 0,5 1,0
Native Naproxen (Y1)
Temperature oC
Derivative (Y1)
MCM-41_Func_Naproxen (Y2) MCM-41_Naproxen (Y2)
-3,0 -2,5 -2,0 -1,5 -1,0 -0,5 0,0 0,5