i
Marisa Raquel Martins de Brito Ferreira
Licenciatura em Bioquímica
Characterization and interaction studies of
triheme cytochromes from Geobacter: a
contribution to the elucidation of extracellular
electron transfer pathways
Dissertação para obtenção do Grau de Mestre em Bioquímica
Orientador: Prof. Doutor Carlos A. Salgueiro, Professor Auxiliar com Agregação
Faculdade de Ciências e Tecnologia, Universidade Nova de Lisboa
Júri:
Arguente: Prof. Doutor Eurico José da Silva Cabrita Vogal: Prof. Doutor Carlos A. Salgueiro
iii
Universidade Nova de Lisboa
Marisa Raquel Martins de Brito Ferreira
Licenciatura em Bioquímica
Characterization and interaction studies of
triheme cytochromes from Geobacter: a
contribution to the elucidation of extracellular
electron transfer pathways
Dissertação para obtenção do Grau de Mestre em Bioquímica
Orientador: Prof. Doutor Carlos A. Salgueiro, Professor Auxiliar com Agregação, Faculdade de Ciências e Tecnologia, Universidade Nova de Lisboa
v
Characterization and interaction studies of
triheme cytochromes from Geobacter: a
contribution to the elucidation of extracellular
electron transfer pathways
“Copyright”
Marisa Raquel Martins de Brito Ferreira Faculdade de Ciências e Tecnologia Universidade Nova de Lisboa
A Faculdade de Ciências e Tecnologia e a Universidade Nova de Lisboa têm o direito, perpétuo e sem limites geográficos, de arquivar e publicar esta dissertação através de exemplares impressos reproduzidos em papel ou de forma digital, ou por qualquer outro meio conhecido ou que venha a ser inventado, e de a divulgar através de repositórios científicos e de admitir a sua cópia e distribuição com objetivos educacionais ou de investigação, não comerciais, desde que seja dado crédito ao autor e editor.
vii
The results obtained under the scope of this thesis are under review in the Dalton Transactions Journal 1. Additionally, the results were presented as oral communication2 in the national congress MicroBiotec 2015 and were already accepted for oral communication3 in the XIX National Congress of Biochemistry SPB 2016.
1 Marisa R. Ferreira, Joana M. Dantas and Carlos A. Salgueiro, Molecular interactions between Geobacter sulfurreducens triheme cytochromes and the electron acceptor Fe(III) citrate studied by NMR, 2016
2 Marisa R. Ferreira, Joana M. Dantas, Teresa Catarino, David L. Turner and Carlos A. Salgueiro, Interactions studies between a redox active component of humic substances and a family of cytochromes from Geobacter sulfurreducens involved in extracellular electron transfer, VI MicroBiotec 2015
3 Marisa R. Ferreira, Joana M. Dantas and Carlos A. Salgueiro, First evidence for molecular interactions between Geobacter sulfurreducens triheme cytochromes and the terminal electron acceptor Fe(III) citrate, XIX National Congress of Biochemistry SPB 2016
ix
A G R A D E C I M E N T O S
Em primeiro lugar, quero agradecer ao Prof. Doutor Carlos Salgueiro, por todo o apoio, disponibilidade, amizade e ensinamentos que me proporcionou ao longo deste trabalho. Agradeço também a sua dedicação, por ter acreditado nas minhas capacidades, pelas longas conversas e por toda a motivação que sempre me deu quando mais precisei.
Quero também agradecer à Joana Dantas pela disponibilidade e ajuda, por partilhar comigo os seus conhecimentos e pela boa disposição e gargalhadas diárias.
Aos meus colegas de laboratório, Ana Fernandes, Marta Silva, Liliana Teixeira, Tomás Fernandes e Tiago Nunes pelo bom ambiente e dinamismo proporcionado e que sempre se mostraram prontos a ajudar.
Um especial obrigado às minhas febras, Carina Figueiredo, Patrícia Reis, Cindy Soares, Cindy Oliveira e Filipa Trovão por todo o apoio que sempre me deram ao longo não só deste trabalho, mas nos últimos 5 anos. Nada seria o mesmo sem a vossa presença. Obrigada pelas conversas, pelos almoços, jantares, festas, choros, desabafos, abraços, os bons e maus momentos, tudo. Sem dúvida que vos levarei sempre comigo.
À Helena Portela, Décio Resendes e Filipa Belchior por todos os momentos e motivação que sempre me deram ao longo desta etapa da minha vida. Obrigada por sempre terem acreditado em mim.
Por fim gostaria de agradecer à minha mãe pelo apoio, compreensão, paciência e por sempre ter acreditado nas minhas capacidades. Sem ti nada disto seria alguma vez possível.
O trabalho desenvolvido no âmbito desta tese foi financiado pelos seguintes projetos: PTDC/BBB-BQB/3554/2014 e UID/Multi/04378/2013 da Fundação para a Ciência e a Tecnologia, Portugal. Os espectrómetros de NMR fazem parte da National NMR Facility, financiada pela Fundação para a Ciência e a Tecnologia (RECI/BBB-BQB/0230/2012).
xi
A B S T R A C T
Geobacter species are frequently the most abundant Fe(III)-reducing microorganism in soils and sediments. They can also reduce other metals in the same type of environments and, in addition, make electrical connections with electrodes to produce electricity from waste organic matter or to drive anaerobic process with electrical energy. Proteomic and genetic studies have identified several multiheme cytochromes as essential for Fe(III) reduction. From all the cytochromes that were shown to be involved in the reduction of Fe(III), the best characterized to date are five periplasmic triheme cytochromes from Geobacter sulfurreducens, which constitute the so-called PpcA-family. The members of this family are designated PpcA, PpcB, PpcC, PpcD, PpcE. A similar family was found in Geobacter metallireducens (PpcA, PpcB, PpcC, PpcE and PpcF) but none of these proteins was characterized to date. When compared to the other homologs found in G. sulfurreducens, PpcF differs the most and for this reason was targeted in the present work. To characterize this cytochrome, PpcF was firstly expressed and purified. The yield obtained was approximately 1 mg/L of cell culture. The molecular mass of the protein was confirmed by mass spectroscopy (9737.13 Da). The molar extinction coefficient was determined (87.4 mM-1cm-1). The UV-visible spectral characteristics of PpcF are consistent with low-spin heme groups with His-His axial coordination, a feature that was further confirmed by Nuclear Magnetic Resonance spectroscopy. The assignment of the heme substituent signals of PpcF in both reduced and oxidized states together with the analysis of their NOE connectivities showed that the heme core structure is similar to those of the PpcA family cytochromes in G. sulfurreducens. The reduction potentials of PpcF were determined at pH 7 and 8 (-56 mV and – 64 mV versus the standard hydrogen electrode, respectively). Lastly 2D-1H NMR exchange spectroscopy was used to determine the order of oxidation of the heme groups in PpcF: IV-I-III.
In the second part of this thesis it was analyzed the possible molecular interaction between cytochromes PpcA, PpcB and PpcE from G. sulfurreducens and Fe(III) citrate. This molecule can be utilized as terminal electron acceptor by this bacterium and PpcA, PpcB and PpcE were shown to be crucial in this electron transfer pathway. For these purpose isotopic 15N-labeled cytochromes were expressed and purified. NMR spectroscopy enabled us to assign the protein NH backbone and heme methyl proton signals, as well as to probe the interaction regions between each cytochrome and
xii
Fe(III) citrate. The chemical shift perturbation studies showed that in all cytochromes the interaction region is located in the vicinity of heme IV.
xiii
R E S U M O
Os microrganismos redutores de Fe(III) da espécie Geobacter são frequentemente os mais abundantes em solos e sedimentos. Estes podem também reduzir outros metais no mesmo meio de crescimento sendo ainda capazes de transferir eletrões para superfícies de elétrodos com concomitante produção de corrente elétrica a partir de matéria orgânica. Estudos genéticos e proteómicos mostraram que alguns citocromos multihémicos são fundamentais nas cadeias respiratórias envolvidas na redução de Fe(III). Destes, os melhor caracterizados até à data são cinco citocromos trihémicos periplasmáticos de Geobacter sulfurreducens. Estes citocromos são designados PpcA, PpcB, PpcC, PpcD e PpcE. Uma família semelhante foi encontrada em Geobacter metallireducens (PpcA, PpcB, PpcC, PpcE e PpcF). Nenhum destes citocromos foi caraterizado até ao momento. PpcF é o citocromo que mais difere em homologia quando comparado com os membros da família PpcA em G. sulfurreducens e por essa razão foi escolhido para ser estudado neste trabalho. De forma a caracterizar este citocromo, a proteína foi primeiramente expressa e purificada. O rendimento desta expressão foi de aproximadamente 1 mg por litro de cultura celular. A massa molecular desta proteína foi confirmada por espectrometria de massa (9737.13 Da). O coeficiente de extinção molar foi determinado (87.4 mM-1cm-1). O espectro UV-visível deste citocromo apresenta as características espectrais típicas de grupos hemo de baixo spin com coordenação axial His-His, uma particularidade que foi confirmada por espectroscopia de Ressonância Magnética Nuclear. A atribuição dos sinais dos substituintes hémicos do PpcF no estado reduzido e oxidado, em conjunto com a análise das suas conectividades NOE, mostrou que a disposição espacial dos grupos hemo é semelhante à dos citocromos da família PpcA de G. sulfurreducens. Os potenciais de redução do PpcF foram determinados a pH 7 e 8 (-56 mV e -64 mV versus o elétrodo padrão de hidrogénio, respetivamente). Por último, experiências de RMN de permuta química foram efetuadas para determinar a ordem de oxidação dos grupos hemo nesta proteína: IV-I-III.
Na segunda parte desta tese foi analisada a possível interação entre os citocromos PpcA, PpcB e PpcE de G. sulfurreducens e o citrato de Fe(III). Esta molécula pode ser utilizada como aceitador final de eletrões nesta bactéria, tendo sido demostrado que os citocromos PpcA, PpcB e PpcE desempenham um papel crucial nesta via respiratória. Para este propósito os referidos citocromos foram expressos e purificados marcados isotopicamente em 15N. A espectroscopia de RMN permitiu atribuir os sinais NH da cadeia principal da proteína e dos protões dos grupos metilo hémicos. Em conjunto, as perturbações observadas nestes sinais permitiram determinar as regiões de interação entre cada citocromo e o citrato de Fe(III). O estudo das perturbações nos desvios químicos demonstrou que em todos os citocromos a região de interação está localizada na vizinhança do hemo IV.
xv L I S T O F C O N T E N T S Agradecimentos ... ix Abstract ... xi Resumo ... xiii List of Contents ... xv
List of Figures ... xvii
List of Tables ... xix
List of Appendix ... xxi
List of abbreviations and symbols ... xxiii
Chapter 1: Introduction ... 1
1.1 Main features of the Geobacter bacteria ... 3
1.2 Geobacter sulfurreducens... 3
1.3 Extracellular electron transfer ... 4
1.4 Geobacter metallireducens ... 5
1.5 Periplasmic triheme cytochromes from G. sulfurreducens and G. metallireducens ... 5
1.6 NMR basic principles ... 10
1.7 Functional and structural characterization of a triheme cytochrome: an overview ... 12
Chapter 2: Characterization of triheme cytochrome PpcF from G. metallireducens ... 15
Contextualization ... 17
2.1 Materials and Methods ... 19
2.1.1 Protein expression ... 19
2.1.2 Protein purification ... 19
2.1.3 UV-visible analysis, quantification and molar extinction coefficient determination ... 20
2.1.4 Molecular mass determination ... 20
2.1.5 Heme quantification ... 21
2.1.6 Redox titrations followed by visible spectroscopy and determination of reduction potentials ... 21
2.1.7 NMR studies... 22
2.1.7.1 Determination of the heme core architecture ... 22
2.1.7.2 Assignment of the heme substituents in the reduced and oxidized states ... 23
xvi
2.2 Results and Discussion ... 27
2.2.1 Purification of PpcF from G. metallireducens ... 27
2.2.2 Molecular weight determination... 29
2.2.3 Molar extinction coefficient determination ... 30
2.2.4 Heme quantification ... 31
2.2.5 Redox titrations of cytochrome PpcF followed by UV-visible spectroscopy ... 31
2.2.6 1D-1H NMR spectral features of PpcF ... 35
2.2.7 Assignment of the heme substituents of cytochrome PpcF in the reduced state ... 36
2.2.8 Assignment of the heme substituents of cytochrome PpcF in the oxidized state ... 38
2.2.9 Order of oxidation of the heme groups ... 40
2.3 Conclusions ... 45
Chapter 3: Molecular interacions between G. sulfurreducens triheme cytochromes and the electron acceptor Fe(III) citrate studied by NMR ... 47
Contextualization ... 49
3.1 Materials and Methods ... 51
3.1.1 Protein expression ... 51
3.1.2 Protein purification ... 51
3.1.3 Protein expression yield ... 52
3.1.4 NMR studies... 52
3.1.4.1 Determination of interacting sites ... 52
3.1.4.2 NH backbone signals assignment methodology ... 53
3.2 Results and Discussion ... 59
3.2.1 Protein expression ... 59
3.2.2 NH backbone signals assignment of PpcB and PpcE ... 61
3.2.3 Interaction between the triheme cytochromes PpcA, PpcB and PpE and Fe(III) citrate .. 63
3.3 Conclusions ... 75
Chapter 4: Future perspectives ... 77
Chapter 5: References ... 81
5. References ... 83
xvii
L I S T O F F I G U R E S
Figure 1. Proposed model for extracellular electron transfer pathway to Fe(III) oxides in G. sulfurreducens.. ... 4 Figure 2. Representative structure of the c-type heme group accordingly to the IUPAC nomenclature. ... 6 Figure 3. Alignment of the amino acid sequences and NMR and crystal structures of triheme cytochromes PpcA-E from G. sulfurreducens ... 7 Figure 4. Electronic and spectroscopic properties of the heme iron in triheme cytochromes from G. sulfurreducens ... 8 Figure 5. Electronic distribution scheme for monoheme and triheme cytochromes, showing the possible microstates in solution ... 13 Figure 6. Diagram of heme c numbered according to the IUPAC-IUB nomenclature... 24 Figure 7. Elution profile for the cation exchange chromatography of PpcF from G. metallireducens ... 27 Figure 8. Elution profile for the molecular exclusion chromatography of PpcF from G. metallireducens ... 28 Figure 9. Purity analysis by SDS-PAGE gel electrophoresis of PpcF from G. metallireducens ... 29 Figure 10. Mass spectrum obtained by MALDI-TOF method of PpcF from G. metallireducens ... 30 Figure 11. Calibration curve obtained for cytochrome PpcA from G. sulfurreducens using the BCA method ... 31 Figure 12. UV-visible absorption spectra of triheme cytochrome PpcF ... 32 Figure 13. Redox titration curves for PpcF from G. metallireducens (15 ᵒC and pH 7 and 8) ... 33 Figure 14. 1D-1H NMR spectra of cytochrome PpcF from G. metallireducens (15 ᵒC and pH 7) in the reduced and oxidized states. ... 36 Figure 15. NOE connectivities observed between the heme proton signals of PpcF from G. metallireducens ... 38 Figure 16. 2D-1H EXSY NMR spectrum of PpcF obtained at intermediated oxidation levels (15 ᵒC and pH 7) ... 41 Figure 17. Scheme representing magnetization transfer in HSQC NMR experiment. ... 53 Figure 18. Schemes representing magnetization transfer in HNCA and HN(CO)CA NMR experiments ... 54 Figure 19. Schemes representing magnetization transfer in HNCACB and HN(CO)CACB NMR experiments. ... 55 Figure 20. Scheme of the observable signals in HNCA, HNCACB, HNCOCA and 3D-HNCOCACB NMR spectra in 1H and 13C coordinates for a given 15N chemical shift ... 57
xviii
Figure 21. Elution profile for the cation exchange chromatography of PpcE from G. sulfurreducens ... 59 Figure 22. Elution profile for the molecular exclusion chromatography of PpcE from G. sulfurreducens ... 60 Figure 23. Purity analysis by SDS-PAGE gel electrophoresis of PpcE from G. sulfurreducens ... 61 Figure 24. Overlay of the 2D-1H,15N HSQC NMR spectra of 15N-enriched PpcA, PpcB and PpcE samples obtained in the absence and in the presence of Fe(III) citrate ... 63 Figure 25. Selected spectral regions of 2D-1H,15N HSQC NMR spectra acquired for 15N-enriched PpcA, PpcB and PpcEin the absence and in the presence of Fe(III) citrate ... 65 Figure 26. Line width broadening effects on the PpcA, PpcB and PpcE backbone NH signals and respective surface mapping ... 66 Figure 27. Line broadening effects on heme methyl 1H signals of PpcA, PpcB and PpcE cytochromes ... 68 Figure 28. Selected regions of 2D-1H,13C HMQC and 2D-1H NOESY NMR spectra of PpcA, PpcB and PpcE cytochromes in the absence and presence of Fe(III) citrate ... 71 Figure 29. Structural map of the most affected lysine residues in PpcA, PpcB and PpcE in the presence of Fe(III) citrate ... 73
xix
L I S T O F T A B L E S
Table 1. Midpoint heme reduction potentials of PpcA, PpcB, PpcD and PpcE from G. sulfurreducens at pH 7.5 ... 9 Table 2. Sequence identity (%) between PpcA-family cytochromes from G. sulfurreducens and G. metallireducens. ... 9 Table 3. Macroscopic reduction potentials (versus SHE) and apparent midpoint potentials for PpcF from G. metallireducens and for PpcA family cytochromes from G. sulfurreducens ... 34 Table 4. Chemical shifts of PpcF heme protons in the reduced state (15 ᵒC and pH 7) ... 37 Table 5. 1H and 13C chemical shifts of the heme propionate and methyl groups of PpcF in the oxidized state (pH 7 at 25 ᵒC and 15 ᵒC) ... 39 Table 6. Chemical shifts of the heme methyl 21CH
3I, 121CH3III and 121CH3IV of PpcF in the four oxidation stages (15 ᵒC and pH 7) ... 42 Table 7. Oxidation fractions of the PpcF heme groups (16 ᵒC and pH 7) ... 42
xxi
L I S T O F A P P E N D I X
Appendix 1. Molecular weight marker used in the different electrophoresis performed throughout this work. ... 89 Appendix 2. Deduction of the equation used to fit the variation of the experimental reduced fraction with to solution potential in the redox titrations followed by UV-visible spectroscopy ... 89 Appendix 3. Amino acid structures and designations. ... 91
xxiii
L I S T O F A B B R E V I A T I O N S A N D S Y M B O L S
1D – One dimensional 2D – Two dimensional
2xYT – 2x yeast extract - tryptone medium 3D – Three dimensional
13C – Carbon proton 15N – Nitrogen proton Å - Angstroms
AMP – Ampicillin
BCA – Bicinchoninic acid assay Cα – Alpha carbon
Cβ – Beta carbon CLO – Chloramphenicol D2O – Deuterium oxide Da – Dalton
Eapp – Apparent midpoint potential value EDTA – Ethylenediamine tetra-acetic acid EXSY – Exchange spectroscopy
F – Faraday’s constant FID – Free induction decay g - grams
g – g-force
Gm – Geobacter metallireducens Gs – Geobacter sulfurreducens
xxiv HSQC – Heteronuclear single-quantum coherence Hz - Hertz
IPTG – Isopropyl β-D-1-thiogalactopyranoside
IUPAC-IUB – International union of pure and applied chemistry and international union of biochemistry K – Kelvin L – Liter(s) M - Molar min – Minute(s) ms – Milliseconds mV – Millivolts MW – Molecular weight
NaPi – Sodium phosphate buffer NH – Amine hydrogen proton nm - Nanometers
NMR – Nuclear magnetic resonance spectroscopy NOE – Nuclear Overhauser effect
NOESY - Nuclear Overhauser effect spectroscopy OD600 – Optical density at 600 nm
PDB – Protein data bank pI – Isoelectric point
Ppc(x) – Periplasmic cytochrome (x) ppm – Parts per million
R – Gas constant
rpm – rotation per minute S – Spin angular momentum
xxv SHE – Standard Hydrogen Electrode
TCI – Triple-resonance cryoprobe TOCSY – Total correlation spectroscopy Tris – Tris(hydroxymethyl)aminomethane UV-visible – Ultraviolet-visible
δ – Chemical shift ᵒC – Degrees Celsius
ε552 – Extinction absorption coefficient at 552 nm
3
1 . I N T R O D U C T I O N
1.1 Main features of the Geobacter bacteria
Geobacter species are Gram-negative bacteria that are capable to sustain their growth by using extracellular compounds as terminal electron acceptors, such as Fe(III), U(VI) or Mn(IV) oxides [1]. This contrasts with the more frequent bacterial respiratory processes that utilize both soluble electron donors (e.g. acetate) and acceptors (e.g. fumarate). Some of the referred extracellular compounds are toxic or radioactive, which makes Geobacter bacteria very appealing for biotechnological and bioremediation applications. The bioremediation strategies where these bacteria are involved include, for example (i) the stimulation of Geobacter growth by addition of an electron donor to the groundwater surfaces and encompasses, for example, the reduction of soluble U(VI) to insoluble U(IV) for the immobilization of uranium in contaminated ground waters [2, 3] or (ii) the anaerobic benzene degradation in petroleum-contaminated aquifers [4].
Furthermore, Geobacter species are highly effective in completely oxidizing organic compounds from aquatic sediments and waste organic matter to carbon dioxide under anaerobic conditions with the concomitant electron transfer to metals or to graphite electrodes in microbial fuel cells from which electricity can be harvested [2–4, 16]. Geobacter species produce higher current densities than any other known organism [1, 6]. However, at present, the power output of Geobacter-based microbial fuel cells is too low for most envisioned applications. Therefore, efforts toward the understanding of the Geobacter respiratory chain are expected to provide valuable information to improve the current-production by these bacteria [10].
1.2 Geobacter sulfurreducens
The genome of Geobacter sulfurreducens was fully sequenced and a genetic system developed [8, 9]. For these reasons G. sulfurreducens serves as a model to study the extracellular electron transfer mechanism in Geobacter spp [12, 13]. It was demonstrated by genetic studies that G. sulfurreducens synthesize a large number of c-type cytochromes, most of which are multiheme [6– 8, 19]. These metalloproteins are involved in the control and coordination of important chemical events in cellular metabolism in bacteria and are particularly abundant in Geobacter species, suggesting that the electron transport pathways in these bacteria are extremely versatile, allowing
4
a precise and adequate physiological response to the diverse metal ions in the natural environments [17].
1.3 Extracellular electron transfer
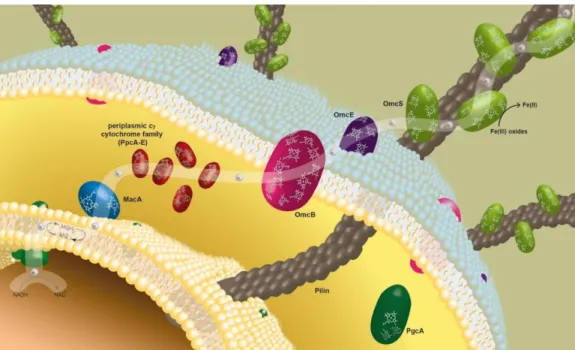
Many of the terminal electron acceptors that can be used by G. sulfurreducens are insoluble and, thus, unable to diffuse inside the cells. Also, since these bacteria requires direct contact for reduction of the insoluble electron acceptors [18], it is not surprising that some of the most important proteins are located on the outer surface of the G. sulfurreducens cells and that electron transfer across the outer membrane is required once it cannot occur in the periplasm as in the case of soluble acceptors [13, 14]. In fact, besides the presence of multiheme cytochromes in the inner membrane and in the periplasm space, as in the majority of the microorganisms, multiheme cytochromes in G. sulfurreducens were also identified in the outer membrane [21]. Combining all this information, a model for the electron transfer to the extracellular acceptor Fe(III) in G. sulfurreducens was proposed (Figure 1).
Figure 1. Proposed model for extracellular electron transfer pathway to Fe(III) oxides in G. sulfurreducens.
The white path represents the proposed electron transfer pathway. The membrane associated cytochrome MacA receives electrons from the menaquinol (MQH2)/menaquinone (MQ) pool at the inner membrane and
reduces the periplasmic triheme cytochromes (PpcA-E). These cytochromes mediate the electron transfer from the periplasm to the outer membrane associated cytochromes (OmcB, OmcE and OmcS) that are likely to be directly involved in the reduction of insoluble Fe(III) oxides. OmcS was shown to be localized along the pili when G. sulfurreducens. Adapted from [22].
5
Although some of the cytochromes involved in the extracellular electron transfer in G. sulfurreducens were already identified, it is essential to obtain detailed characterization on such electron transfer components in order to not only elucidate these electron transfer mechanisms but also to promote new strategies to be explored in the improvement of the electricity production and in the design of optimal biotechnological applications [23].
1.4 Geobacter metallireducens
The bacterium Geobacter metallireducens was the first Geobacter species to be isolated and identified. This bacterium is capable of using different electron acceptors and donors, as described for G. sulfurreducens. It is an obligate anaerobic Fe(III)-respiring bacterium and was the first organism identified to be capable of: (i) conserve energy in order to support growth from the oxidation of organic compounds coupled with the reduction of Fe(III), Mn(IV) or U(VI); (ii) utilize humic substances as electron acceptors; (iii) remediate environments contaminated with aromatic compounds; (iv) more efficient Fe(III) reduction rates compared to G. sulfurreducens [24]. In contrast with G. sulfurreducens, G. metallireducens do not use fumarate as final electron acceptor. This latter is also able to convert nitrate to ammonia and to metabolize aromatic compounds [25]. Furthermore, the motility of G. metallireducens is one of the reasons that explain their high efficiency in the reduction of Fe (III) oxides compared to G. sulfurreducens. Nonetheless, as in G. sulfurreducens, the c-type cytochromes are important players in all these respiratory pathways [26].
1.5 Periplasmic triheme cytochromes from G. sulfurreducens and G. metallireducens
Despite the lack of information regarding the precise extracellular electron transfer mechanisms in both G. sulfurreducens and G. metallireducens, it is consensual that c-type cytochromes play a crucial role in those processes. These cytochromes contain at least one heme group, which is formed by a tetrapyrrole porphyrin ring coordinated to an iron atom. Cytochromes can be classified as type a, b, c or d according to the type of substituents at the periphery of the porphyrin ring [27]. In a c-type cytochrome the heme group, is covalently bound through thioether bonds to cysteine residues of the polypeptide chain arranged in a typical CXXCH motif (where X corresponds to any amino acid) and is composed by 20 proton-containing groups (four methyl groups, four meso proton, two thioether protons, two thioether methyl and two propionate groups – see Figure 2) [20, 21].
6
Figure 2. Representative structure of the c-type heme group accordingly to the IUPAC nomenclature [29].
The thioether bonds with the sulfur atom of cysteine residues in the heme binding motif are established with the carbons atoms harboring 31H and 81H groups. Adapted from [30].
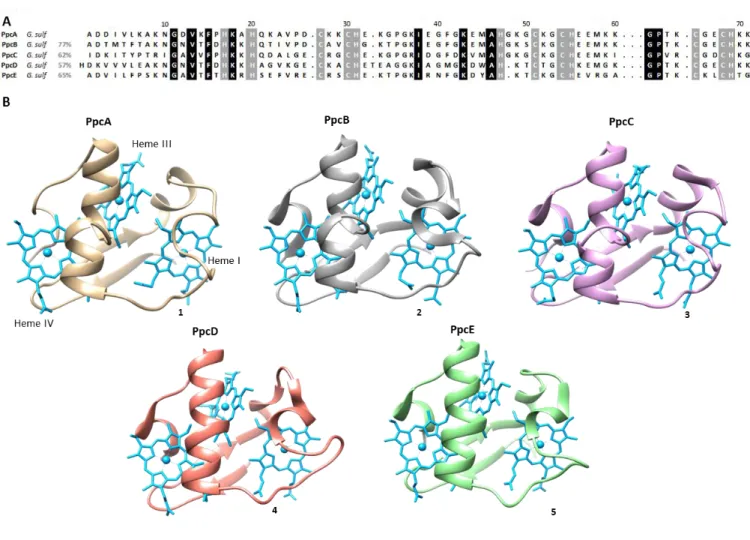
A family composed by five triheme periplasmic c-type cytochromes with approximately 10 kDa each, designated by PpcA, PpcB, PpcC, PpcD, and PpcE was identified in G. sulfurreducens. It is believed that these five periplasmic proteins play an important role in the reduction of extracellular acceptors by bridging the electron transfer between the cytoplasm and cell exterior [23]. These periplasmic proteins, containing approximately 70 residues, show a high structural homology and share 77% (PpcB), 62% (PpcC), 57% (PpcD) and 65% (PpcE) amino acid sequence identity with PpcA [31]. A sequence alignment of these proteins is depicted in Figure 3A and shows that of the 21 highly conserved residues, only nine are not cysteine or histidine residues directly involved in heme binding. The five cytochromes have high isoelectric points (pI ≥ 9), due to the considerable content in lysine residues and all the heme groups are covalently linked to the polypeptide chain by two cysteine residues in a conserved CXXH binding motif.
7
Figure 3. Alignment of the amino acid sequences and NMR (1) and crystal (2-5) structures of triheme cytochromes PpcA-E from G. sulfurreducens. (A) Sequence identity for each cytochrome of PpcA family from
G. sulfurreducens in relation to PpcA. The conserved residues in the proteins are boxed: heme attached (gray) and non-heme attached residues (black). The specific heme and the respective attached residues are indicated on the bottom of the last cytochrome amino acid sequence. (B) 1) PpcA (PDB code 2LDO [32]); 2) PpcB (PDB 3BXU [33]); 3) PpcC (PDB 3H33 [34]); 4) PpcD (PDB 3H4N [34]); 5) PpcE (PDB 3H34 [34]). The molecules are all in the same orientation.
The crystal structures of these cytochromes have been determined and are indicated in Figure 3B. As depicted, the tertiary structure of all the proteins is similar, although local variations were observed. The spatial arrangement of the hemes in triheme cytochromes is superimposable with those of the structurally homologous tetraheme cytochromes c3, with the sole difference being the absence of heme II and the corresponding polypeptide segment. For this reason, the heme groups have been numbered as I, III and IV. In these cytochromes all heme groups are axially coordinated by two histidine residues and are low-spin in both the reduced and oxidized forms. Therefore, they
8
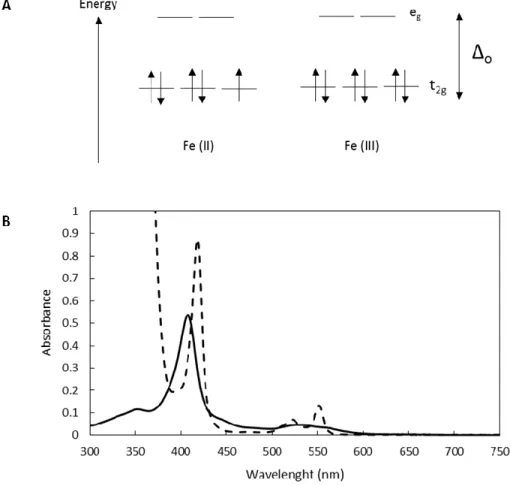
are diamagnetic (Fe(II) and S = 0) and paramagnetic (Fe(III) and S = ½) in the reduced and oxidized states, respectively (Figure 4A). This feature is reflected in their UV-visible spectrum, here exemplified for PpcA in Figure 4B.
Figure 4. Electronic and spectroscopic properties of the heme iron in triheme cytochromes from G. sulfurreducens. (A) Spin-states of octahedral F(III) and Fe(II) at low spin state, where crystal field, Δo, is higher
than the energy repaired to pair electrons in the same orbital, P (Δo>P). (B) Typical UV-visible absorption
spectra. The oxidized form is represented by a solid line and is characterized by the Soret band with a maximum at 406 nm. In the reduced form (dashed line), three bands are observed: Soret band at 417 nm, β band at 522 nm and α band at 552 nm [35].
The thermodynamic properties of G. sulfurreducens PpcA family members, except for PpcC, have been determined showing that the redox potentials are negative and different for each cytochrome [26, 27]. A summary of these properties is indicated in Table 1.
9
Table 1. Midpoint heme reduction potentials (eapp) of PpcA, PpcB, PpcD and PpcE from G. sulfurreducens at pH 7.5 [26, 27]. Microscopic potentials are determined for each heme (I, III and IV). The redox potential values
are relative to the standard hydrogen electrode (SHE).
Cytochrome
Reduction potentials (mV) Heme I Heme III Heme IV PpcA -152 -108 -126
PpcB -150 -155 -130
PpcD -156 -102 -162
PpcE -158 -158 -100
Similarly to the G. sulfurreducens, a family of five triheme periplasmic cytochromes, designated PpcA, PpB, PpcC, PpcE and PpcF was also found in G. metallireducens [24]. As depicted in Table 2, PpcF has relative little homology with PpcD, in fact it has the highest identity percentage with PpcA from G. sulfurreducens. For this reason, a new designation for this cytochrome was needed - PpcF. It was suggested that, as the PpcA family from G. sulfurreducens, the family of triheme cytochromes found in G. metallireducens is also involved in extracellular electron transfer [24]. However, none of these cytochromes were functional or structurally characterized to date.
Table 2. Sequence identity (%) between PpcA-family cytochromes from G. sulfurreducens and G. metallireducens [38]. G. sulfurreducens G . meta lli red u ce n s A B C D E A 80 73 64 68 62 B 68 72 57 68 63 C 59 56 79 42 51 E 54 61 52 55 69 F 62 58 57 55 57
10 1.6 NMR basic principles
In general terms nuclear magnetic resonance spectroscopy (NMR) studies the absorption of electromagnetic radiation of a specific frequency by an atomic nucleus placed in a strong magnetic field. In fact, nuclei have positive charges and many behave as little spin bars. As known, anything that is charged and moves has a magnetic moment (µ) and produces a magnetic field (B). Therefore, a spinning nucleus acts as a magnet oriented along the spin rotation axis, called nuclear spin. In the presence of a much larger magnetic field the orientation of the spin will be no longer random, but the most favorable would be the low-energy state and the less favorable orientation the high-energy state.
Nuclei are characterized by a quantum spin number (I), which can be determined by its atomic mass. When I = 0, there is no nuclear spin and it is NMR silent. Most nuclei of biologic interest (e.g. 1H, 13C, 15N, 19F and 31P) have nuclear spin quantum I = ½. The value of the quantum spin number determines the number of energy spin states that a nucleus may assume in presence of an external uniform magnetic field in accordance with the formula 2I+1. For a nuclei with I = ½, in the absence of an applied magnetic field (B0) the two energy states are degenerated and the number of atoms in each state will be equal to the thermal equilibrium. On the other hand, in the presence of an external magnetic field the energy difference (ΔE) between the energy states α (mI=+1/2, with the field) and β (mI=-½, against the field) gives rise to the frequency of the spectra, whereas intensities of the signals are proportional to the population difference between α and β states. The ratio of the populations in the states is quantitatively described by the Boltzmann equation (Equation 1):
𝑁∝ 𝑁𝛽
= 𝑒∆𝐸/𝑘𝐵𝑇
where Nα and Nβ represents the number of nuclei in each possible spin orientation, kB the Boltzmann constant and T the temperature.
The energy needed to induce the mentioned transitions between the states is the energy difference between the two states and depends of the magnetic field that is applied to the nuclei (Equation 2):
∆𝐸 = 𝛾ℎ𝐵0 2𝜋
(Equation 1)
11
where γ represents the gyromagnetic constant, which is constant to each nuclei and h represents the Planks constant.
Furthermore, in the presence of an external magnetic field, nuclei have an intrinsic frequency, which is known as the Larmor frequency (ν0), which is given by Equation 3. For instance, in a molecule, all protons have the same Larmor frequency. However, the signals of interest are those processing at frequencies slightly different from the Larmor frequency, an effect caused by the electron density surrounding each individual proton.
𝑣0= 𝛾𝐵0
2𝜋
In a sample, not all the nuclei are subject to the same chemical environment and that is reflected in a different chemical shift (δ), expressed in ppm (parts per million). The resonance frequencies are expressed in terms of an empirical quantity called chemical shift, which is related to the difference between the resonance frequency (ν) of a nucleus in question and that of a reference standard (νref), Equation 4:
𝛿 = 𝑣 − 𝑣𝑟𝑒𝑓 𝑣𝑟𝑒𝑓
106
The approach to any structural or mechanistic problem will invariably start with the acquisition of one dimensional (1D) spectra, since these provide the foundations for further work. In a 1D experiment, the FID (free induction decay) is acquired after a radio frequency pulse or pulses, called the preparation period. A plot of the frequencies of the nuclei versus the signal intensities constitutes the 1D NMR spectrum. In the case of small molecules, the 1D spectrum can be sufficient to obtain the required information. Although, for a macromolecule this kind of spectra are too complex to be interpreted. In order to improve the spectral resolution for further studies, an additional dimension can be introduced to disperse the signals over two frequency dimensions, forming a multi-dimensional NMR spectrum. In the case of 2D NMR spectra, which were the most used in the current work, they include one additional period called the evolution time, which contains a variable time delay t1, and is introduced between the preparation and acquisition periods. Moreover, the second dimension can be frequency for 1H, which results in a square spectrum with diagonal peaks, or a heteronuclear acquisition, which gives asymmetric spectra. 2D experiments can also contain other periods in addition to the evolution time, such as a mixing time, tm.
(Equation 3)
12
Finally, at the end of each experiment, all the FIDs are transformed with the same phase parameters followed by the calibration of the spectra. In the case of biological samples, it is common to calibrate the NMR spectra through the proton signal of the water (Equation 5):
𝛿𝐻2𝑂= 5.11 − 0.012 𝑇
where T represents the temperature of the experiment in degrees Celsius. The calibration of the other nuclei, such as 13C and 15N, is obtained by indirect referencing as described by Wishart and co-workers [39].
1.7 Functional and structural characterization of a triheme cytochrome: an overview
NMR is powerful technique in what concerns to the structural and functional characterization of a protein. However, in the particular case of multiheme cytochromes, the assignment of the protein signals is not a straightforward task, namely in the oxidized state. In fact, the paramagnetic effect of the unpaired electrons at the heme iron causes the spread and broadening of the signals of the heme groups, as well as those of the amino acid residues located in their neighborhoods, all over large spectral widths. In order to assist the solution structure determination and identification of molecular interactions the assignment of the protein signals, including those of the heme substituents is crucial.
The functional characterization of multiheme cytochromes typically encompasses the determination of their macro and microscopic redox properties, a task that benefits from the assignment of the heme methyl proton signals in the fully reduced and oxidized states. Therefore, the determination of the redox properties is also much more complex in multiheme cytochromes. In fact, in a monoheme cytochrome the variation of the protein reduced fraction with the solution potential can be calculated by the direct application of the Nernst equation (Equation 6)
𝐸 = 𝐸0+𝑅𝑇
𝑛𝐹𝑙𝑛
[𝑜𝑥] [𝑟𝑒𝑑]
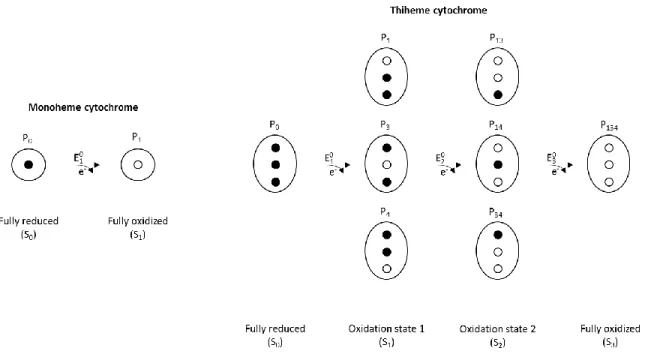
This is possible because only two states co-exist in solution, the fully reduced and the fully oxidized (Figure 5). In this case, the solution redox potential for which the reduced and oxidized fractions of the protein are equal corresponds to the Eapp value and therefore, to the reduction potential of the heme group.
(Equation 5)
13
Figure 5. Electronic distribution scheme for monoheme and triheme cytochromes, showing the possible microstates in solution. The elliptic forms represent the cytochrome and the inner circles the heme groups,
which can be either reduced (black circles) or oxidized (white circles). P represent the microstates and the followed number the hemes that are oxidized in that particular microstate.
In contrast, in the case of a triheme cytochrome, three consecutive reversible steps with the transfer of one electron convert the fully reduced state to the fully oxidized state (Figure 5). Therefore, four macroscopic redox stages are defined, and the relative populations of the four stages at equilibrium and three macroscopic reduction potentials (E1o, E2o and E3o) can be defined. These parameters can also be obtained by fitting the experimental variation of the total reduced fraction of the protein with the solution potential, as described below. It is worth noting that the macroscopic reduction potential values do not necessarily correspond to any of the heme groups.
17
C O N T E X T U A L I Z A T I O N
G. metallireducens is a dissimilatory iron reducing bacterium that has the ability to utilize extracellular electron transfer acceptors, a feature that is shared by G. sulfurreducens. Tremblay and co-workers [26] identified a very important role for pili in the Fe(III) reduction and in the transfer of electrons to electrodes in G. metallireducens. The motility is one of the reasons why these bacteria are more efficient in the reduction of Fe (III) oxides compared to G. sulfurreducens. However the c-type cytochromes are important to this process as well [26]. To date, the components and mechanisms underlying the extracellular electron transfer in G. metallireducens are not yet fully elucidated [40]. This is a crucial step to contribute to the development of future applications in biofuel production and bioremediation.
Genetic and proteomic studies revealed that some c-type cytochromes appear to be overexpressed when the cells utilize nitrate as terminal electron acceptor. Such respiratory process was not observed for G. sulfurreducens. The nitrate reductase activity of G. metallireducens is attributed to the narGYJI genes. The gene ppcF (annotation number Gmet0335) of nar operon encodes a periplasmic triheme c-type cytochrome, designated PpcF, which is involved in this electron transfer pathway [24]. In fact, PpcF may permit the transfer of electrons to the nitrate reductase from extracellular electron donors such as humic substances or graphite electrodes [24]. As previously mentioned, PpcF is the one in the PpcA family from G. metallireducens that has little homology with the cytochrome PpcD from G. sulfurreducens the reason why it is not denominated PpcD. The lack of a homologous protein to PpcF in G. sulfurreducens makes PpcF more appealing to be studied. In order to contribute to the understanding of PpcF role we performed for the first time a biochemical characterization of this cytochrome.
19
2 . 1 M A T E R I A L S A N D M E T H O D S
2.1.1 Protein expression
Escherichia coli BL21(DE3) cells were used to express the triheme cytochrome PpcF from G. metallireducens. E. coli cells, harboring the plasmid pEC86, which is a derivative from the pACYC184 containing the gene cluster needed to the cytochrome c, ccmABCDEFGH, [41] were transformed with the plasmid pCS0335, the expression vector containing the gene sequence encoding for PpcF. Transformed E. coli cells were grown aerobically in 2xYT rich media supplemented with 34 µg/mL chloramphenicol (CLO) and 100 µg/mL ampicillin (AMP), both from NZYTech. Colonies were selected and grown in 50mL 2xYT medium (also supplemented with 34 µg/mL CLO and 100 µg/mL AMP) to a 1.8<OD600nm<2, at 30 C, 200 rmp, overnight. 20% of this culture was transferred to 1L of 2xYT media (34 µg/mL CLO and 100 µg/mL AMP) and grown till they reach an OD600nm>1.5, at 30 C and 200 rpm. At this stage, protein expression was induced with 10 µM isopropyl β-D-1-thiogalactopyranoside (IPTG) from NZYTech and incubated overnight at 30 C and 160 rpm. Then, cells were harvested and centrifuged at 6400 g for 20 min at 4 C, to isolate the periplasmic fraction. The cell pellet was gently resuspended in 30 mL of lysis buffer, per liter of initial cell culture, constituted by: 20 % sucrose (VWR), 100 mM Tris-HCl (NZYTech) pH 8, 0.5 mM EDTA (Amresco) and 0.5 mg/mL lysozyme (Fluka). The suspension was incubated at room temperature during 15 min, then 15 min on ice with gently shaking and finally centrifuged at 14700 g, 20 min, at 4 C. The resulting supernatant was ultracentrifuged at 44000 g, 1 h, at 30 C. The resulting supernatant was dialyzed (MWCO 3500) against 10 mM Tris-HCl pH 8.
2.1.2 Protein purification
PpcF was purified using first a cation exchange chromatography and then a molecular exclusion chromatography. Dialyzed protein was injected in a cation exchange 2x5 mL GE Healthcare HiTrap SP HP column equilibrated with 10 mM Tris-HCl pH 8 and the cytochrome was eluted with a 0-300 mM NaCl, 150 mL length, gradient in 10 mM Tris-HCl, at a flow rate of 1 mL/min. The collected red fractions were concentrated to 1 mL and injected in a Superdex 75 molecular exclusion column (GE Healthcare) of 120 cm, equilibrated with 100 mM sodium phosphate buffer, pH 8, and eluted at a flow rate of 0.5 mL/min. Both chromatography steps were performed on an ÄKTA Prime Plus FPLC
20
System (GE, Amersham). Protein purity was evaluated by sodium dodecyl sulfate polyacrylamide gel electrophoresis (15%), stained with Coomassie brilliant blue (Sigma).
2.1.3 UV-visible analysis, quantification and molar extinction coefficient determination
visible absorption spectra were acquired for the obtained purified cytochrome on a UV-visible scanning spectrometer Thermo scientific Evolution 201 with quartz cuvettes with 1 cm path length (Helma), at room temperature. Fully sample reduction was achieved by adding sodium dithionite (Sigma) in small increments. Protein concentration was determined by measuring the absorbance of the reduced PpcF α-band at 552 nm, using the extinction coefficient of 87.4 mM-1cm -1 determined in this work by the Pierce BCA Protein Assay Kit (Thermo Scientific). This method consists in a detergent-compatible formulation based on bicinchoninic acid (BCA) for the colorimetric detection and quantification of total protein. It combines the well-known reduction of Cu+2 to Cu+ by protein in an alkaline medium, known as the biuret reaction, with the highly sensitive and selective colorimetric detection of the cuprous cation (Cu+). Then the chelation of two molecules of BCA with one cuprous ion results in purple-colored reaction product. This water-soluble complex exhibits a strong absorbance at 562nm that is nearly linear with increasing protein concentrations over a broad working range (20-2000µg/mL). As standard it was used PpcA from G. sulfurreducens. Afterwards UV-visible spectra of PpcF was recorded in the range 350-700 nm, at room temperature for both oxidized and reduced samples and used to determine the molar extinction coefficient of the cytochrome.
2.1.4 Molecular mass determination
The theoretical molecular mass of cytochrome PpcF was calculated taking into account the amino acid composition of the mature protein and the molecular mass of three heme c groups. The experimental mass of cytochrome PpcF was determined by matrix-assisted laser desorption-ionization time-of-flight mass spectrometry (MALDI-TOF-MS) using a Voyager-DETM PRO Biospectrometry Workstation equipped with a nitrogen laser radiating at 337 nm from Applied Biosystems (Analysis laboratory Requimte – LAQV/UCIBIO). A matrix solution of sinapinic acid in 70:30 water/acetonitrile with 0.1% TFA (final concentration) was used. The measurements were
21
performed in triplicated in positive ion mode using ProteoMassTM cytochrome c MALDI-MS from Sigma-Aldrich (MW 12361.96 Da) as internal calibration.
2.1.5 Heme quantification
Heme quantification of cytochrome PpcF was performed using the pyridine hemochrome method described by Berry and Trumpower [42]. 5 µM of purified PpcF in aqueous solution was incubated with 50mM NaOH and 20% v/v pyridine at room temperature for 15 minutes. The solution was separated in two fractions. One fraction was reduced with sodium dithionite (pyridine ferrohemochrome form) whereas the other was oxidized with potassium ferricyanide (pyridine ferrihemochrome form). UV-visible spectra were acquired between 350-700 nm for both fractions. The number of hemes was calculated using the absorption coefficient of 21.84 mM-1cm-1 for the α-band in the pyridine ferrohemochrome sample, using Equation 7 [42],
𝐴 = [𝐻𝑒𝑚𝑒] × 𝑙 × 𝜀550𝑛𝑚
𝑁𝑢𝑚𝑏𝑒𝑟 𝑜𝑓 ℎ𝑒𝑚𝑒 = [𝐻𝑒𝑚𝑒] [𝑃𝑝𝑐𝐹]
where A represents the visible absorption, l the length of the light path in cm and ε the absorption coefficient.
2.1.6 Redox titrations followed by visible spectroscopy and determination of reduction potentials Redox titrations of PpcF were followed by visible spectroscopy at 15 ᵒC inside an anaerobic glove box (MBraun) with oxygen conditions <1 ppm. 30 µM samples of the protein in 20 mM NaCl were prepared in 80 mM sodium phosphate with NaCl (250 mM final ionic strength). Each redox titration was performed in the reductive and in the oxidative direction, allowing inferring about the occurrence of hysteresis. Sodium dithionite and potassium ferricyanide solutions were used to reduce and oxidize the samples, respectively. The following mixture of redox mediators was added to the solution with a final concentration of approximately 1.5 µM, as described in the literature [43], to ensure the equilibrium between the redox center of the protein and the working electrode: methylene blue, gallocyanine, indigo trisulfonate, indigo tetrasulfonate, indigo disulfonate, anthraquinone-2,6-disulfonate, 2-hydroxy-1,4-naphthoquinone, safranine O, diquat, benzyl viologen, neutral red and methyl viologen. These mediators cover the potential range of 280 to -120
22
mV (relative to standard hydrogen electrode, SHE). A combined Pt/Ag/AgCl electrode was used for measuring the solution potential. The redox potential of the solution was measured after each addition of reductant or oxidant agent, and once stable, a visible spectrum was recorded.
The experiments were performed at least twice at each pH value, and the reduction potentials were found to be reproducible within +/- 5 mV. The reduced fraction of the protein was determined by integrating the area of the α-peak (552 nm) above the line connecting the flanking isosbestic points (545 and 559 nm) to subtract the optical contribution of the redox mediators, as described previously [33]. Each measured solution redox potential value were corrected to the standard hydrogen electrode reference by the addition of 207 mV. The macroscopic reduction potential values for cytochrome PpcF were determined by fitting the observed reduced fraction to the Equation 8 (section 2.2.5).
2.1.7 NMR studies
NMR spectra were acquired in a Bruker Avance III 600 spectrometer equipped with a triple-ressonance cryoprobe (TCI). All NMR spectra were processed using TOPSPIN (BrukerBiospin, Karlsruhe, Germany) and analyzed with Sparky (TD Goddard and DG Kneller, Sparky 3, University of California, San Francisco, USA). 1H chemical shifts were calibrated using the water signal as internal reference and the 15N and 13C chemical sifts were calibrated through indirect referencing [39].
2.1.7.1 Determination of the heme core architecture
Cytochrome PpcF samples with approximately 0.5 mM for 2D NMR studies were prepared in 80 mM sodium phosphate pH 8 and pH 7 buffer with NaCl (250 mM final ionic strength) in 2H
2O. To assist the heme signal resonance assignments 2D-1H NOESY (nuclear overhauser effect spectroscopy) with 80 ms mixing time and spectral width of 14 kHz and 2D-1H TOCSY NMR spectra with 60 ms mixing time and spectral width of 14 kHz, were acquired for the fully reduced cytochrome (pH 7 and 8, 15 ᵒC). The fully reduction of cytochrome PpcF was achieved by first flushing out the air from the oxidized sample with argon. NMR sample was reduced directly in the NMR tube with gaseous hydrogen in the presence of catalytic amounts of hydrogenase from Desulfovibrio vulgaris, as previously described [33]. For the fully oxidized cytochrome 2D-1H NOESY
23
with 80 ms mixing time and spectral width of 41 kHz, 2D-1H TOCSY (total correlation spectroscopy) with 45 ms mixing time and spectral width of 41 kHz and 2D-1H,13C HMQC (heteronuclear multiple quantum coherence) with spectral width of 41 kHz in F2 and 250 in F1 NMR spectra were acquired (pH7, 15 and 25 ᵒC). The spectra were acquired by collecting at 4k and at least 256 scans per increment.
2.1.7.2 Assignment of the heme substituents in the reduced and oxidized states
In the reduced state, the first step to assign the heme substituents signals is the analysis of the connectivities between a thioether methine (31H or 81H) and a thioether methyl group (32CH
3 or 82CH
3) in the 2D-1H TOCSY NMR spectrum, as depicted in Figure 6. Indeed, these are the only protons that are part of the same spin system and, therefore can be easily detected in such NMR experiments.
On the other hand, 2D-1H NOESY experiments allow detecting spatial correlation between nuclei that are typically closer than 5 Å. Thus, as also depicted in Figure 6, meso protons present a characteristic pattern of short-range intraheme connectivities: protons H15 are not connected to either methyl groups or thioether substituents; protons H20 are connected to two heme methyls (21CH
3 and 181CH3); and the only ambiguity arises from H5 and H10 protons, which both present connectivities with a thioether methine, a thioether methyl and one heme methyl group. This ambiguity was solved by observing the connectivities between one of the heme methyls near the H20 protons (21CH
3 and 181CH3) with the closest tioether methyl (32CH3), which were unequivocally assign in the 2D-1H TOCSY. This allowed connecting H20 and H5 faces of each heme. The heme methyls 71CH
3 are part of H5 faces and also show connectivities with thioether groups (81H and 82CH
3), which are in H10 faces. After the identification of these three heme faces, H15 protons were identified by observing the connectivities between cross-peaks that connect H15 and 121CH
3 or 181CH
24
Figure 6. Diagram of heme c numbered according to the IUPAC-IUB nomenclature [29]. The typical through
bond connectivities are indicated by solid arrows, whereas the dashed ones indicate the typical NOE connectivities used to assign the heme substituents. Adapted from [30].
In the paramagnetic oxidized state, in addition to the ring-current effects, the intrinsic (from own heme) and the extrinsic (from neighboring hemes) paramagnetic contribution due to the presence of unpaired electrons strongly contributes to the final observed chemical shift of the heme substituents, making their assignment more complex. In fact, in the oxidized form the same type of signals are differently affected by the paramagnetic centers, show different levels of broadness and are spread all over the entire NMR spectral width. Therefore, the chemical shifts of the heme substituents in the oxidized form are completely different in comparison with those observed in the fully reduced proteins. Consequently, a different NMR assignment strategy was used to assign the heme signals in the oxidized form. In this case, 2D-1H,13C HMQC NMR experiment is very useful to map some of the heme substituent signals because typical 1H,13C regions can be identified. The propionates CH2 protons (171CH2 and 131CH2) are identified in 1H,13C HMQC NMR spectrum, whereas the intraheme connectivities with the propionates βCH2 (172CH2 and 132CH2) are obtained from the analysis of 2D-1H TOCSY spectrum and then confirmed in 2D-1H,13C HMQC NMR spectra at the typical region of propionates βCH2. Afterwards, in 2D-1H NOESY spectra we identified the cross peaks of each propionate proton with those of the closest heme methyl (181CH
25
2.1.7.3 Identification of the order of oxidation of the heme groups
The oxidation patterns of the heme groups of PpcF in 80 mM sodium phosphate with NaCl (250 mM final ionic strength) in 2H
2O were monitored by acquiring a series of 2D-1H EXSY (exchange spectroscopy) NMR experiment at pH 7 and 16 ᵒC, with the sample poised at several degrees of oxidation. All spectra were acquired with a mixing time of 25 ms and 256 scans per increment.
In a triheme cytochrome, three consecutive reversible steps of one-electron transfer convert the fully reduced state (stage S0) in the fully oxidized state (stage S3), as described in Figure 5. Therefore, four different redox stages can be defined that comprise 8 microstates. When the intramolecular electron transfer exchange (between microstates within the same oxidation stage) is fast on the NMR time scale and the intermolecular exchange (between microstates belonging to different oxidation stages) is slow, on the NMR time scale, the individual heme NMR signals can be discriminated [33, 34]. In this case, the heme oxidation fractions can be determined from the chemical shifts of their heme substituents in the different oxidation stages. In fact, the distribution of paramagnetic shifts observed for each oxidation stage is governed by the relative microscopic reduction potentials of the heme groups, and thus provides information on the relative order of oxidation of the hemes.
The heme methyl resonances are the easiest identifiable NMR signals amongst the heme substituents, making them ideal candidates to monitor the stepwise oxidation of the hemes. Indeed, as show below in sections 2.2.7 and 2.2.8, the chemical shift of the heme signals are considerably different in the reduced and oxidized states, shifting from crowded regions in the fully reduced to relatively empty regions in the fully oxidized spectra. Therefore, as the oxidation of the multiheme cytochrome proceeds, the heme methyl signals become much shifted from the diamagnetic region of the spectra and the signals can be followed during a redox titration monitored by 2D-1H EXSY NMR spectra.
27
2 . 2 R E S U L T S A N D D I S C U S S I O N
2.2.1 Purification of PpcF from G. metallireducens
After the expression of PpcF, the protein was sequentially purified by cation exchange chromatography and molecular exclusion chromatography. The elution profiles obtained for both chromatographic steps are represented in Figures 7 and 8, respectively.
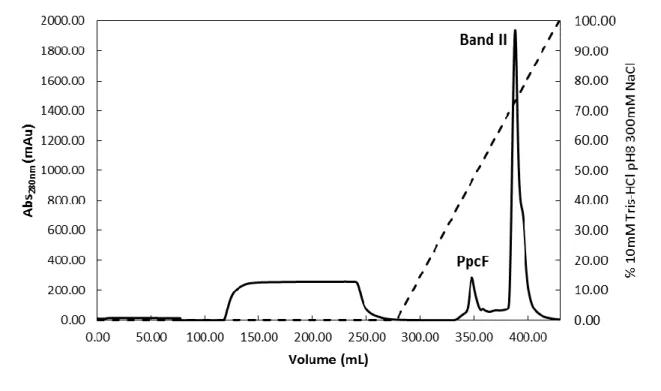
Figure 7. Elution profile for the cation exchange chromatography of PpcF from G. metallireducens. Cation
exchange chromatography column equilibrated with 10 mM Tris-HCl pH 8. Elution at 1 mL/min flow rate. Solid line corresponds to the variation of absorbance at 280 nm. Dashed line reports the NaCl gradient profile.
Based on the amino acid sequence of PpcF an isoelectric point of 8.96 was determined using the pI/Mw tool program on the ExPASy Server. Taking into consideration this value, the cytochrome was purified using a cation exchange chromatography column previously equilibrated with 10 mM Tris-HCl pH 8. In these conditions the cytochrome binds to the column and was eluted by the linear increase of the buffer ionic strength. As indicated in the Figure 7, the protein of interest, which presents a red characteristic color typical for proteins containing heme groups, was eluted at approximately 46% (138.9 mM) of the ionic strength gradient.
28
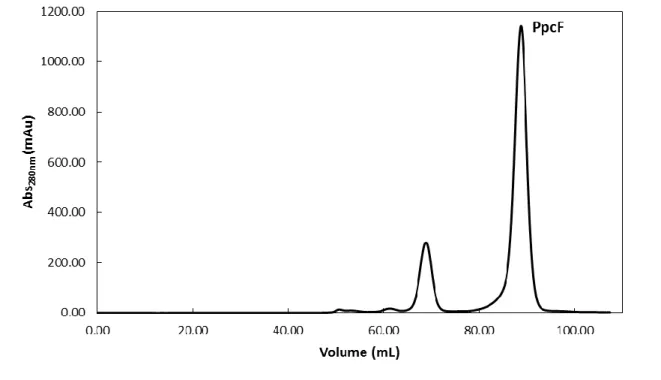
With this first purification step the majority of the contaminants were removed. However it was necessary to complement it with a molecular exclusion chromatographic step. The elution profile obtained in the molecular exclusion chromatography is represented in Figure 8. PpcF was eluted at approximately 88 mL.
Figure 8. Elution profile for the molecular exclusion chromatography of PpcF from G. metallireducens.
Molecular exclusion chromatography column equilibrated with 100 mM sodium phosphate buffer, pH 8, with a flow rate of 0.5 mL/min.
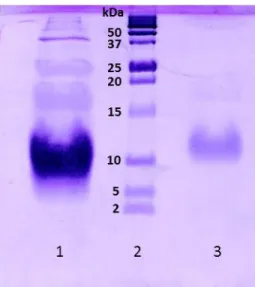
The fraction corresponding to the PpcF band were analyzed by SDS-PAGE electrophoresis (Figure 9) and MALDI-TOF-MS (Figure 10) to infer about its purity. The SDS-PAGE electrophoresis gel (Figure 9) shows one intense band in the expected MW region (≈10 kDa), after the final purification step. Also, the second and highest band observed in the cation exchange chromatography (Band II, see Figure 7) which presents a brownish color was analyzed by SDS-PAGE electrophoresis and corresponds to proteins with lower molecular weight compared to PpcF.
29
Figure 9. Purity analysis by SDS-PAG electrophoresis of PpcF from G. metallireducens. Obtained results of
SDS-PAGE gel, 15% acrylamide, stained with Coomassie brilliant blue. Lane 1) Band II obtained in the cation exchange chromatography; Lane 2) Protein marker (Protein Plus Protein Dual Xtra Standards, Bio-Rad, appendix A1; Lane 3) Purified fraction after molecular exclusion chromatography. The molecular weights of the protein markers are in indicated on the left of lane 2.
2.2.2 Molecular weight determination
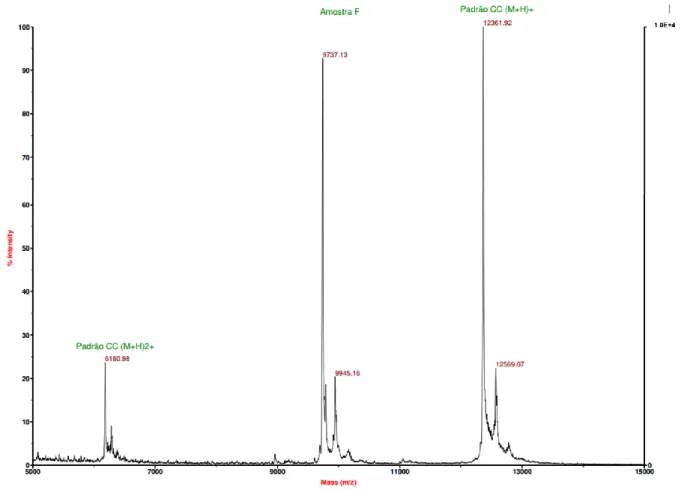
The mass spectrum obtained for the purified fraction of PpcF (Figure 10) indicates a molecular mass of 9737.13 ± 0.002 Da, which is in excellent agreement with the calculated one using the Compute pI/Mw tool [46] (7886.21 Da from the mature protein plus three times 616.5 Da from the three heme groups, yielding a total molecular mass of 9735.71 Da). This result also confirms that PpcF has three heme groups.
30
Figure 10. Mass spectrum obtained by MALDI-TOF method of PpcF from G. metallireducens. Analysis of the
sample was performed in a Voyager-DETM Pro Workstation, with positive ionization mode, using sinapinic acid
as matrix. Pattern CC (M+H)+ represents a sample of horse cytochrome c that was used as internal calibration.
2.2.3 Molar extinction coefficient determination
The molar extinction coefficient of cytochrome PpcF was determined with the BCA Protein Assay (Thermo Scientific Piece). The calibration curve obtained is indicated in Figure 11, using cytochrome PpcA from G. sulfurreducens as standard. The value of ε552nm = 97.5 mM-1cm-1 [36] was used to calculate the concentration of PpcF samples in the reduced form. From this study it was possible to determine a value of ε552nm = 87.4 mM-1cm-1 for the PpcF molar extinction coefficient.
31
Figure 11. Calibration curve obtained for cytochrome PpcA from G. sulfurreducens using the BCA method.
The parameters correspondent to the calibration line are indicated as an inset together with its accuracy (R2).
2.2.4 Heme quantification
Pyridine hemochrome method was used to further confirm the number of hemes present in PpcF cytochrome. An absorbance of 0.330 at 550 nm was obtained in presence of sodium dithionite. Based on the molar extinction coefficient correspondent to this wavelength (30.27 mM-1cm-1 [42]) it was possible to determine a heme content of 3.1 per cytochrome and confirm that PpcF has three heme groups.
2.2.5 Redox titrations of cytochrome PpcF followed by UV-visible spectroscopy
The redox titrations followed by UV-visible take advantage of the spectroscopic properties of heme proteins. In Figure 12, the UV-visible spectra of PpcF in both oxidized and reduced states are shown. In the oxidized state only a prominent band is observed at 410 nm, whereas in the reduced state three bands 419 nm (Soret), 523 nm (β) and 553 nm (α) are observed. For this reason the α-band was selected to monitor the reduction fraction of the protein in the redox titrations.
32
Figure 12. UV-visible absorption spectra of triheme cytochrome PpcF. The oxidized spectrum is represented
by a solid line and the Soret band appears at 410nm. In the reduced spectrum (dashed line), three bands are observed: Soret at 419nm, β at 523nm and α at 553nm.
The redox titrations of PpcF from G. metallireducens were performed at two different pH values (pH 7 and 8) and are indicated in Figure 13.
Soret
33
Figure 13. Redox titration curves for PpcF from G. metallireducens (15 ᵒC and pH 7 and 8). The circles and
triangles represent the oxidation and reduction directions, respectively. The grey line represents the fitting curve resulting from Equation 8. The insets represent an expansion of the α-band region. In these insets each line represents a different experimental measurement. The isosbestic points were 559 and 544 nm for pH 7 and 560 and 545 nm for pH 8.
![Figure 2. Representative structure of the c-type heme group accordingly to the IUPAC nomenclature [29]](https://thumb-eu.123doks.com/thumbv2/123dok_br/19195738.951706/32.918.331.587.102.383/figure-representative-structure-type-group-accordingly-iupac-nomenclature.webp)
![Figure 6. Diagram of heme c numbered according to the IUPAC-IUB nomenclature [29]. The typical through bond connectivities are indicated by solid arrows, whereas the dashed ones indicate the typical NOE connectivities used to assign the hem](https://thumb-eu.123doks.com/thumbv2/123dok_br/19195738.951706/50.918.330.590.105.417/diagram-numbered-according-nomenclature-connectivities-indicated-indicate-connectivities.webp)