Carlos Pestana Barros & Nicolas Peypoch
A Comparative Analysis of Productivity Change in Italian and Portuguese Airports
WP 006/2007/DE _________________________________________________________
Paulo Trigo Pereira & João Andrade e Silva
Citizens’ Freedom to Choose Representatives: Ballot Structure, Proportionality and “Fragmented” Parliaments
WP 013/2007/DE/UECE/CEMAPRE _________________________________________________________
Departament of Economics
WORKING PAPERS
ISSN Nº0874-4548
School of Economics and Management
Citizens’ Freedom to Choose Representatives: Ballot Structure, Proportionality and “Fragmented” Parliaments
Paulo Trigo Pereira and João Andrade e Silva
ISEG – Technical University of Lisbon UECE and CEMAPRE
Rua Miguel Lúpi 20, 1200 Lisboa, PORTUGAL
Abstract
The analysis of the political consequences of electoral laws has emphasized how individual characteristics of the electoral system (electoral formulas, district magnitude, ballot structure) affect the degree of parliament “fragmentation” and proportionality. This paper argues that the personal attributes of representatives are also an important consequence of electoral laws, and that they are in part determined by citizens’ freedom to choose representatives. We clarify this concept and develop an index of citizens’ freedom to choose members of parliament as a function of the ballot structure, district size and electoral formulae. Using data from twenty nine countries, we find that neither proportionality nor the effective number of parties is significantly affected by voters’ freedom of choice. This result has important normative implications for electoral reform.
Keywords: Ballot structure, Electoral index, Freedom to choose, Personal vote.
1. Introduction
Electoral systems are perhaps the most powerful set of rules in representative
democracies. There is widespread agreement that elements of electoral systems –
electoral formulas, district magnitude, and electoral thresholds - influence, although not
mechanically, political outcomes such as the number of political parties in parliament,
the internal structure of these parties, the political stability, and the proportionality of
vote shares and seat shares. In short, electoral laws have political consequences (Rae
1971, Lijphart 1990, Mueller 1996). To analyze these consequences the relevant
variables must be measurable. District magnitude and electoral thresholds are measured
quantitatively and electoral formulas are measured qualitatively. Both variables impact
the political outcomes measured by indexes such as the disproportionality index1 and
the effective number of parties in parliament.2 Such indeces are very important to
understand the likely effects of electoral reforms; namely how changes in certain
variables of the electoral systems affect objectives like political stability or the fairness
of representation.
The effect of electoral systems, and more specifically the effect of ballot
structures, on the type of members of parliament elected did not receive much attention
during the twentieth century. However, in the nineteenth century John Stuart Mill
(1861), Thomas Hare (1859) and other prominent social reformers were perfectly aware
that electoral systems were crucial in determining the personality, intelligence and
1
In this paper we will use the disproportionality index of Loosemore-Hanby (1971) which divides by two the sum of the module of differences between each party’s seat share and vote share. Michael Gallagher (1991) suggested another index, and Bernie Grofman and others suggested that instead of scaling by one half the vote-seat deviation, it should be scaled by the effective number of parties. We agree that for some purposes of empirical analysis it is more accurate to use the effective number of parties. However, if it is necessary to disentangle the effect of an electoral system variable on proportionality and the effective number of parties, it should not be included. This is one of the reasons why we develop in this paper two freedom of choice indices, one that does not depend on the number of parties (FC1) and another that does depend on the number of parties(FC2).
2
interests of those elected to serve as members of parliament. Mill (1861, p. 256) states
that “It has been seen that the dangers incident to a representative democracy are of two
kinds: danger of a low grade of intelligence in the representative body, and in the
popular opinion which controls it; and danger of class legislation on the part of the
numerical majority.” He was conscious that a critical issue in determining “intelligence
in the representative body” was the extent of political competition to access parliament,
and that the level of political competition is influenced by the ballot structure and the
electoral formula. In a certain sense Mill and Hare were calling for attention to the
personal consequences of electoral laws.3
To date, the research on the importance of ballot structures is somewhat
inconclusive and it is target to the political (not personal) consequences of electoral
laws. Rae (1971) formulated the hypothesis that “ordinal” ballots, where voters can
choose more than one party (candidate), are more favorable to a fragmented parliament
(greater effective number of parties in parliament) than a “categorical” vote, where
voters have to vote just for one party (or candidate). However, he rejected the
hypothesis. Subsequently, Lijphart (1990) replicated Rae’s work with more data and
different methodology and reached a similar conclusion; ballot structure is not a very
relevant variable in electoral systems. Lijphart only found evidence of the importance
of ballot structures in plurality rule systems where the Australian “alternative” vote
produces more parties than the UK plurality rule. Few authors have recently addressed
the importance of the information given in the ballot (Bowler and Grofman (2000),
Carey and Shughart (1995), Farrell and McAllister (2006), Norris (2003)). The
3
disregard of this issue may be associated with the difficulty to capture the diversity of
ballot structures within a single measure.
In this paper we focus on voters’ freedom of choice. Implicitly we assume that
the personal attributes of members of parliament are, in a large measure, a function of
the degree of competition for a seat in parliament. This competition can arise from two
different processes: internal party competition independent of voters’ preferences or
party competition driven (in a greater or lesser extent) by voters’ preferences. Voters’
freedom of choice is greater when voters have more candidates and political platforms
to choose from, more possibility to express their preferences, and more information
about the candidates.
Therefore, one aim of this paper is to make the case that it is worth measuring
freedom of choice because of its intrinsic and instrumental values. Freedom of choice is
one of the criteria that should be considered in electoral reform. A second aim is to
indirectly test Rae and Lijphart’s hypothesis of a quasi nonexistent relationship between
ballot structure and either proportionality or party fragmentation. A third aim is to
develop a synoptic index that captures different degrees of “freedom of choice” in
different democracies and clarify the possible applications of such an index in testing
new hypotheses. Therefore, Section 2 clarifies the concept of “freedom of choice” from
the perspective of social choice theory. Section 3 builds the index from three
dimensions: choices available to voters, effective preferences they can express in the
ballot, and information concerning candidates. Section 4 presents the empirical evidence
on “freedom of choice” and how it relates to proportionality and the effective number of
parties. Finally, section 5 discusses the implications for electoral reform of our analysis
2. Freedom and choice: concept and measures.
Liberty and freedom of choice have been extensively discussed by eminent
scholars in quite different perspectives (e.g. Isaiah Berlin (1969) and Amartya Sen
(1988, 1991)). The most useful approach for our purposes here is the axiomatic
approach that has been developed in social choice literature.
In some sense, what distinguishes democracy from authoritarian regimes is
freedom of choice. Consider a case where a ruler unilaterally transfers his power to his
son, and the alternative case where his son obtains the power through winning a
competitive and deliberatively fair struggle to obtain popular support in a democratic
election. Although the ultimate ruling person is the same, the democratic process is
associated with citizens’ freedom to “choose” (directly or indirectly) the new leader.
This example also highlights an important point that has been emphasized
particularly by Amartya Sen (1991), concerning the “instrumental” and “intrinsic”
values of freedom of choice. The value of freedom of choice in democracy is not just
that there is a higher probability that better leaders are selected (or incompetent leaders
dismissed), but also the intrinsic value associated with participation in the political
process.
Consider an individual who eats a “pastel de nata” with an espresso everyday,
which he selects from a menu (or opportunity set) of many cakes and diverse
beverages.4 If he was forced to eat that meal, he would not stand it. The fact that people
value outcomes and procedures (the way those outcomes are reached) show two
different dimensions of freedom of choice.
4
Most people agree that the “intrinsic” value of freedom of choice increases (even
at a diminishing rate) with the augmentation of the opportunity set. If she has more
cakes to choose from, her freedom of choice increases, even if she still chooses to eat
the same “pastel de nata,” because she prefers this cake to any other that was added to
the set.5 Conversely, if her opportunity set decreases, her freedom to choose decreases.
In this paper we will assume that freedom of choice increases (decreases) when
the elements in the opportunity set increase (decrease). One simple measure for ranking
opportunity sets according to freedom of choice is the cardinality of the sets.6 If one has
three cakes one has more freedom than if one has only two.
In markets choice is over private goods and it is a real choice. However, in
politics, we are in the realm of collective or social choices. The information citizens
express through the ballot is aggregated and transformed through the rules of the
electoral system into a social choice. Each citizen does not “choose” anything, but
instead he has a greater or smaller freedom to express his preferences concerning the
opportunity set that is presented to him.
Apart from the cardinality of the opportunity set there are three additional
dimensions that could be considered in order to measure freedom of choice. The first
dimension is the number of items that can be selected from the “menu.” If just one item
can be selected from a given set, the freedom to choose is less than if the choice is
between two items of the same set. Alternatively, the same number of available choices
(e.g. 2) in menus of different sizes (e.g. 3 and 6 items) is also associated with different
5
There is, however, an objection to that assertion. From a cognitive perspective some authors have been arguing that, after some point, to have more elements in the opportunity set create cognitive dissonance so that less is better than more.
6
degrees of freedom.7 The second dimension is the information associated with each
item in the menu. If she does not have any information concerning the characteristics of
the items she is choosing from, her freedom is in some sense virtual. She could just
select a random number to make her “choice”. Ceteris paribus, the more information
associated with each item in the menu, the greater the freedom to choose.89 Finally,
freedom and liberty, in a positive sense, are also a function of an individual’s capability
of knowing what is best for him and processing the relevant information in order to
choose accordingly.
The index developed in this paper considers the first three dimensions discussed
above: the cardinality of the opportunity set, the number of effective revealed
preferences, and information concerning the candidates. The former two will be labelled
as “options” and “choices.” However, the capabilities dimension is not introduced for
simplicity reasons.
3. Freedom of Choice : options, “choices” and information.
The first critical issue we need to address is the options voters face to assess the
cardinality of the opportunity set (the “menu” of choices).10 We assume that, if given
the chance, citizens will vote for political parties and for candidates (the “personal vote”
7
The more complicated issue is how to rank different size menus with different number of choices. The “freedom of choice” index developed in this paper, satisfies both conditions mentioned in the text, and has an implicit trade off between having more items to choose and more possibility to choose.
8
Again, there are simple cases and more complicated cases. From a no information menu, to a menu where I have information on one item, there is an increasing freedom. This is the simplest case. Complicated cases are those where it is possible to have more information on some items and less in others.
9
Information on political candidates can arise from different sources: the candidates themselves, the political parties, interest groups and the media. What this dimension says is that we consider more information and more diversified information as better than less information. Taking into account cognitive limitations, the marginal benefit of increasing information should be decreasing.
10
on the characteristics of the candidates). Since each political party has a distinct
platform, when the effective number of parties increases, the citizens’ freedom to
express political preferences in different ways also increases. This measure has been
used widely in the literature and we also use it in the effective freedom of choice index
(FC2).
However, there is a problem with using the effective number of parties. Among
other things, we want to analyze the possible causal effect of “freedom of choice” on the
fragmentation of parliament (given by the effective number of parties). So in a simple
freedom of choice index (FC1) we assume that opportunities to express political
preferences must be independent of the actual effective number of political parties. We
consider three parties, a Left Party (L), a Center Party (C) and a Right Party (R), as the
opportunities to express political preferences.11
Apart from ideology, we assume citizens care about candidates’ personal
characteristics and that these are independent of political platforms.12 If given the
opportunity, citizens would vote for particular candidates as well as for political
platforms.
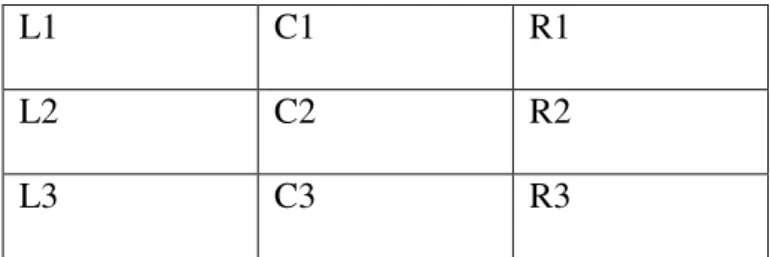
To analyze the cardinality of different electoral systems, it is easiest to start with
the simple index (FC1), looking at the following matrix, where each column refers to a
different party (L, C, R) and each row is a candidate (1, 2, 3) belonging to the party’s
list (when applicable).
11
The average effective number of parties in our sample of 29 countries is 3.81. However, we have chosen 3 for reasons of symmetry that can be justified to simultaneously treat ideological diversity and personal characteristics.
12
L1 C1 R1
L2 C2 R2
L3 C3 R3
Table 1. Citizens’ opportunities to select candidates
In the simple index we establish an upper limit for voters’ “options” given by the
product of three parties and three candidates. This can be considered as an unnecessary
constraint on voters’ available choices because some ballots allow for more options.
However, the concept of freedom, as we want to measure it, is not just the input
information that the voter introduces in the ballot, but it is also related to the
effectiveness of this information in the final selection of candidates. This suggests a
limitation in the available choices in the relevant opportunity set. Moreover, all citizens
have cognitive limitations so that, even from the strict point of view of the voter input in
the ballot, a limitation on available “choices” should be considered.
The “menus” (opportunity sets) of the main ballot structures and electoral
systems in the simple index (FC1) are the following:
- PR, Plurality Rule with nominal vote in one candidate (e.g. UK) or AV, the
“alternative” vote with ordinal vote (e.g. Australia):
#Xplr=#Xpr_av=#{L, C, R }=3
- AM – Absolute Majority rule in runoff elections (e.g. France)
#Xam=#{L, C, R }=3
- CLPR - Closed List Proportional Representation (e.g. Portugal)
- OLPR - Open List Proportional Representation (Preferential Voting) (e.g. Czech
Republic)
#Xolp=#{L1, L2, L3, C1, C2, C3, R1, R2, R3}=9
- STV - Single Transferable Vote (e.g. Ireland)
#Xstv=#{L1, L2, L3, C1, C2, C3, R1, R2, R3}=9
- MS Mixed systems using dual Ballot (e.g. Germany)
#Xdb=#{L, C, R, Li, Ci, Ri}=6
Turning now to the revealed preferences of the voters it is important to define an
upper boundary for the relevant number of revealed preferences, i.e. those which have
an impact on candidate selection. Now we are addressing the issue of determining the
number of items available for a voter to “select” to have an effective impact on
candidates’ choice. We establish this number as three, since for the reasons stated below,
the practical importance of citizens’ fourth preference is rather low and should be
disregarded.
A main distinction between the different ballot systems is whether voters can
reveal their first preference alone, or more. In plurality rule with a candidate ballot or in
closed list proportional representation with a party ballot, voters can vote for one
candidate or one party respectively, so that only the first preference counts. This has
been labelled a “categorical” ballot in the literature. In all other systems voters can
reveal more than one preference (ordinal or not) in what has been labelled “ordinal”
balloting following Rae (1971).
In the French electoral system (party ballot with runoff), if a party has an
absolute majority the candidate of that party is elected. If not, there is a second round.
So the second preference of the voter only is necessary in some districts. Therefore, we
In dual ballots, where voters have the single member district to vote for
candidates and regional or national district to vote for parties, voters have two
“choices”.13
Some literature considers the rank ballot has giving the greatest amount of
“choice” to the voter. In fact, the voter is able to fully or partially rank order the
candidates across political parties. This is an input oriented interpretation of the ballot.
However, what is relevant is not the maximum information the voter can express
through the ballot, but the individual “choices” that are relevant for the collective choice
of candidates. Taking into account that the fourth preference onwards has a minor
impact on candidate selection, we assign the maximum value of three “choices” to STV,
but also to the candidate-preference ballot of Australia, although here the choice set
(number of candidates) is much smaller.
Given its diversity, the preferential system poses more difficulty in determining
the available ballot “choices.” In preferential systems voters select the party in which to
vote and then can order (or mark) the candidates within that party list. In “strong”
preferential systems there is no minimum percentage below which the candidate does
not get elected. In “weak” systems, there is a minimum percentage which functions as a
party “screen” on voters’ preferences. If he can not reach it, and if proportional
representation suggests that a candidate of that party must be elected, it is the first
candidate of the party list who takes office. It also happens that the number of votes for
the candidates from the party list can be restricted. 14 This of course has an impact on
13
Lijphart (1990) correctly points out that the mixed systems should not be included in the “categorical” category as Rae (1971) did. We always use the term ordinal ballot within brackets because we can not say that voters rank a party with a candidate in mixed systems. However, we can say that they express preferences for a party and a candidate.
14
citizens’ effective freedom to choose. Clearly, the “choices” available in open list
proportional representation systems are smaller than in the STV, particularly in the
“weak” systems.
Ballot type Electoral
System
Votes Vote in
Party,
Candidate
(or both)
Voters’
Options*
( c )
Voters’
“choices”**
( p )
Single Member districts (SMD) or/and Multi-member (MMD) 1 Candidate- ballot Plurality
1 C 3 1 SMD
2
Party ballot
PR (close
list) 1 P 3 1
MMD
3 Candidate ballot
(runoff)
Majority 1 or
2 P 3 1,5
SMD
4
Preference-ballot
PR (Open
list) 1 C,P 9 2 MMD
5
Rank Ballot
Single
Transf.
System
(STV) 1 C, P 9 3
MMD 6 Cand-pref. Ballot Plurality (“Alternative
vote”) 1 C 3 3
SMD
1 C 3 1 SMD
7
Dual ballot
Mixed
system 1 P 3 6 1 2 MMD
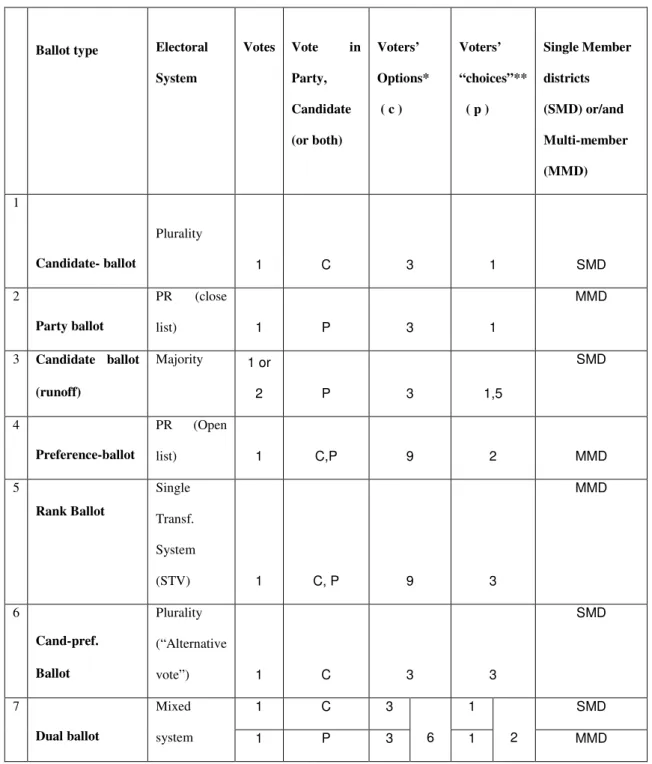
* Available set of candidates/parties to choose from (in index FC1 below).
** Number of relevant candidates/parties “chosen” by the voter in her ballot. [Insert Table 2 here]
Table 2. Electoral systems, ballot structures, and voters’ options and “choices”.
Therefore, we consider two choices to be relevant in this type of electoral
system.15 Table 2 summarizes the conclusions concerning available “options” and
“choices”.
Finally, the last issue to address is the information available to the voter about
the candidates. We assume that information on each candidate is a decreasing function
of average district magnitude (M =S D), with S the size of the assembly and D total
number of districts (upper and lower tier).16 In single member districts, opportunities for
interaction between candidates and voters are greater. This is important mainly for the
knowledge of the personal attributes of particular candidates. Information on each
candidate decreases as the size of the district increases. This can arise from two
different factors: the average number of mandates per district (in multi-member districts)
increases or the electorate per mandate (in single member districts) increases. It is
important to understand how M takes into account this second factor in mixed systems.
Let S l refer to seats allocated in the lower tier and Sh seats allocated at upper tiers.
Therefore,
D S D S D S
M h l
+ =
= (1)
In plurality rule with candidate ballot, M =1. In dual ballot systems the average district
size (electors per mandate) is higher if, for a given number of electors, the number of
single member districts decreases. This effect is captured by M as the following
example illustrates. Korea has 253 single member districts (and respectively the same
number of MPs) out of a total of 299 (85%). On the other hand, Germany has only 50%
15
It is clearly the case that in a set of k candidates, a partial ordering of n<k candidates is associated with more "freedom" than purely giving "approval" to the same subset of n candidates. In the former case there are factorial n (n!) different ways to express preferences, while in the latter just one (e.g. with n=3, 3!=6 as opposed to 1). Our index is a function of approved candidates in the ballot because this is the essential information that is transformed through the electoral formula.
16
of MPs elected through single member districts. This means that, disregarding the
absolute assembly size, Korea (Mk =1.18) is much closer to the UK average district
magnitude (MUK =1), than Germany (MG =1.99). Thus, taking the overall average
district size, enables to distinguish between mixed systems with different proportion of
MPs elected in single member districts.17
Amongst different possibilities we adopt this function for a proxy of the
information that citizens have on the personal characteristics of candidates:18
M I
log 1
1
+
= (2)
where logM stands for the decimal logarithm of M .
Therefore, the simple index of freedom of choice is a combination of these three
characteristics. It is an increasing function of voters’ available “options” (the cardinality
of the opportunity sets), voters’ “choices” (the number of relevant revealed preferences),
and the information about the chosen candidate. To combine the first two aspects we
use the geometric mean19 and we multiply this value by the information value, assumed
as a function ofM . Consequently the index is based on c.p/(1+logM), where c
stands for the “options” available to the voters, p for the “choices”. Finally we
17
There are different approaches to district magnitude. Rae (1971) considers average district size. Taagepera and Shugart (1989) and Taagepera (2002) use an “effective district magnitude” which is an implicit function of the assembly size and the number of seat winning parties. There is always a loss of information when using an average instead of the distribution of district magnitude, namely we loose the variation of the distribution (see Monroe and Rose (2002)). We agree with Taagepera’s criticisms to the average district magnitude, namely that it does not take into account neither effective thresholds nor the effects of nationwide compensation in a national district (when it applies). However, the effective district magnitude is an output based measure and since we want to built an input based index we follow Rae’s approach. Moreover, the aim of our analysis here is to measure how much information is provided by candidates to voters. As explained in the text, even when district magnitude is an average of several single member districts and one national district, district magnitude changes with the proportion of seats allocated in single-member districts. The implicit assumption is that for a given assembly size and electorate, as the number of single member districts decreases, the size of each district increases and therefore the “information distance” between candidates and voters increase, i.e. there is an information loss.
18
Since it is a convex and decreasing function of M, we implicitly assume that information about candidates decreases at a diminishing rate (negative sign of second derivative). It means that when the district size increases from one to two, the information loss is greater than when it increases from 20 to 21.
19
standardize the formula in such a way that the index value for the candidate-ballot (UK,
USA) is 1, i.e. for the country i the index is given by:
3 ) log 1 ( 1 i i i i M p c FC + = (3)
This index has an advantage of not being a function of the effective number of
parties and will be used to analyze the relationship between the two variables.20
The effective freedom of choice index (FC2) is similar but we substitute c* for c,
indicating that available political “choices” take into account now the effective number
of parties in parliament. Therefore the index is based on the expression
) log 1 ( * M p c + .
To standardize the index we use as normalizing constant 1/ * us
c , where * us
c is
the effective number of parties in the USA (cus* =1.99), so that the index assumes the
unitary value in this country. For country j the index is given by:
* , ) log 1 ( 2 us j us j c M p c FC +
= (4)
4. Empirical results: freedom of choice indices
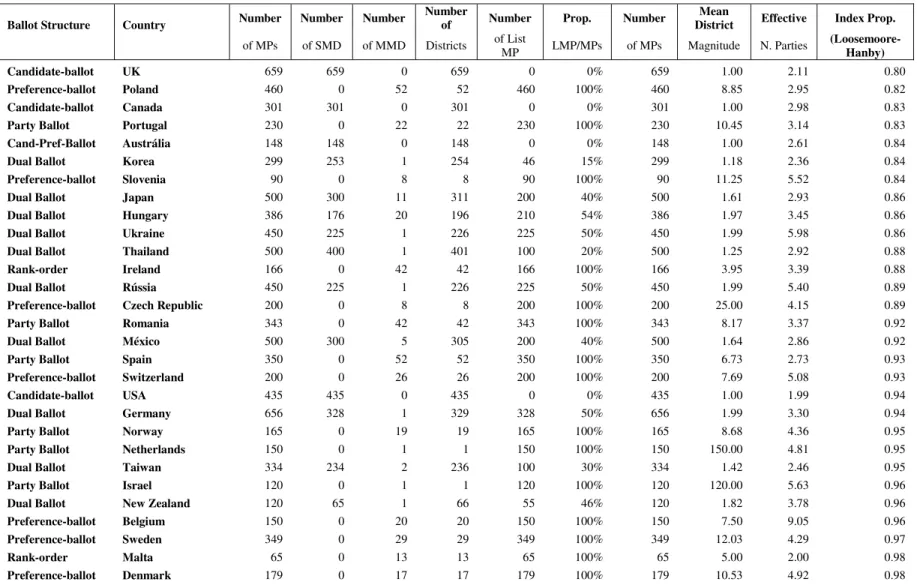
Table A1 (in the Appendix) shows the characteristics of electoral systems in the
29 democracies we are analyzing. The mean district magnitudes, the effective number
of parties and the Loosemore-Hanby proportionality index enables some comparison
between the electoral systems.
20
Note that although it may seem that the index is asymmetric with respect to c and p, since the range of c
Ballot
Structure Country
Effective number of parties Mean district magnitude LH-index FC2-Index FC1-Index Party Ballot The
Netherlands 4,81 150,00 0,95 0,49 0,31 Party Ballot Israel 5,63 120,00 0,96 0,55 0,32 Party Ballot Portugal 3,14 10,45 0,83 0,62 0,50 Party Ballot Norway 4,36 8,68 0,95 0,76 0,52 Party Ballot Romania 3,37 8,17 0,92 0,68 0,52 Party Ballot Spain 2,73 6,73 0,93 0,64 0,55
Candidate-Ballot USA 1,99 1,00 0,94 1,00 1,00
Candidate-Ballot UK 2,11 1,00 0,80 1,03 1,00
Candidate-Ballot Canada 2,98 1,00 0,83 1,22 1,00
Preference-ballot Czech Republic 4,15 25,00 0,89 1,48 1,02
Preference-ballot Sweden 4,29 12,03 0,97 1,73 1,18
Preference-ballot Slovenia 5,52 11,25 0,84 1,99 1,19
Preference-ballot Denmark 4,92 10,53 0,98 1,90 1,21
Preference-ballot Poland 2,95 8,85 0,82 1,53 1,26
Preference-ballot Switzerland 5,08 7,69 0,93 2,08 1,30
Preference-ballot Belgium 9,05 7,50 0,96 2,79 1,31 Dual Ballot Germany 3,30 1,99 0,94 1,98 1,54 Dual Ballot Russia 5,40 1,99 0,89 2,54 1,54 Dual Ballot Ukraine 5,98 1,99 0,86 2,67 1,54 Dual Ballot Hungary 3,45 1,97 0,86 2,03 1,55 Dual Ballot New Zealand 3,78 1,82 0,96 2,19 1,59 Dual Ballot Mexico 2,86 1,64 0,92 1,97 1,65 Dual Ballot Japan 2,93 1,61 0,86 2,01 1,66
Cand-Pref-Ballot Australia 2,61 1,00 0,84 1,98 1,73 Dual Ballot Taiwan 2,46 1,42 0,95 1,93 1,74 Rank-order Malta 2,00 5,00 0,98 1,77 1,77 Dual Ballot Thailand 2,92 1,25 0,88 2,21 1,82 Dual Ballot Korea 2,36 1,18 0,84 2,03 1,87 Rank-order Ireland 3,39 3,95 0,88 2,45 1,88
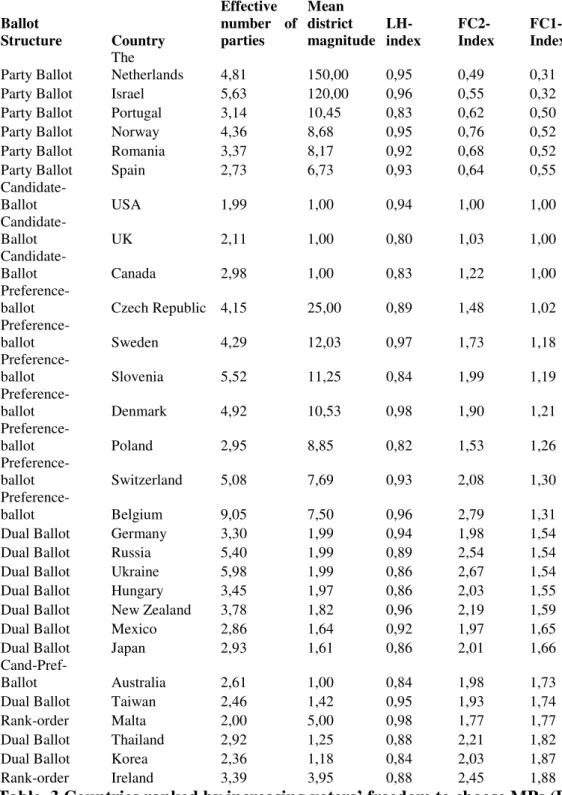
Table 3 Countries ranked by increasing voters’ freedom to choose MPs (FC1)
An application of the “freedom of choice” indices to several types of ballot
structures and electoral systems is shown in Table 3. The two indices give a similar
The simple one (FC1) should be used to test hypotheses concerning the political
consequences of electoral laws and to discuss electoral reforms, since it only depends on
variables from the electoral system. The second one (FC2) gives more importance to
freedom to express political preferences but is calculated taking into account electoral
results.
The interpretation of the FC1 index is straightforward as seen in section 3.
Values can be directly compared with the reference value given by the candidate ballot
system. Consequently, in The Netherlands or Israel, the freedom of choice is
approximately one third of the level existing in the UK or the U.S., while in Ireland the
level is almost twice the reference value. This is due mainly to the dimension of
(reduced) information on candidates in the former countries given that they just have
one electoral district. On the other hand, Ireland has relatively small districts (for a
proportional representation system) and benefits from a greater menu of voter choices.
Several conclusions can be drawn from the index of freedom to choose (FC1).
First, we can derive a rough ranking of the different ballot structures: Party ballot,
Candidate ballot, Preference ballot, Dual ballot, Candidate preference ballot and Rank
order ballot, in ascending order. However, some countries have higher (smaller) values
in the index than was previously supposed by the type of ballot they use.21
It is not surprising that the party ballot index is below the reference value given
by the candidate ballot system. The options available to the voters and the possible
“choices” are the same in both systems, yet in the party ballot, the voter has much less
information concerning the personal characteristics of candidates.
The dual ballot systems are associated with quite different positions in the
ranking given the fact that mean district magnitude is significantly different from
21
country to country (e.g. Germany (1.54) has a lower degree of freedom of choice than
Korea (1.87)).
It is interesting to note how the proportionality index, such as the Loosemore-
Hanby, and the freedom to choose index give different types of information on electoral
systems. Australia and Slovenia have the same degree of proportionality (0.84), but
voters’ freedom to choose in Australia is much higher. Norway (party ballot) and
Taiwan (dual ballot) also share the same high degree of proportionality (0.95) but voters
in Taiwan have more possibilities to express their preferences.
A similar situation occurs when we compare the effective number of political
parties using the FC1 index. The USA and Malta have a similar effective number of
political parties, but the FC1 index is much higher for Malta than for the USA.
If we consider a more aggregated analysis of the averages of “categorical”
ballots (Party and Candidate ballots) and the averages of “ordinal” ballots (all the
others) it is possible to test Rae’s hypothesis. Table 4 shows that, for each type of ballot,
the averages of the effective number of parties and the degree of proportionality are
similar. This gives support to the rejection of the hypothesis that the ballot structure has
an effect either on the fragmentation of parliaments or on proportionality. On the other
hand, as expected, ordinal ballots are associated with significant larger voters’ freedom
of choice.22
22
Effective Number Parties Average District Magnitude Proport. LH Freed. Choice (FC2) Freed. Choice (FC1)
Candidate and Party
Ballot
(“Categorical”)
3.46 34.11 0.90 0.78 0.64
Other Ballots
(“Ordinal”)
3.97 5.48 0.90 2.06 1.52
Table 4– “Categorical” and “Ordinal” ballots
It is also worth mentioning that the average district magnitude of ordinal ballots
is relatively small, while it is very large in categorical ballots given the weight of party
ballots.23
Finally, to analyze how the freedom to choose index can be related to other
characteristics of an electoral system, such as proportionality or the effective number of
political parties, we estimate a linear regression where the dependent variable is the
effective number of parties and the covariates are the freedom of choice index (FC1)
and the decimal logarithm of average district size. The estimated values are (standard
errors below the estimated coefficients)
(0.7232) (0.6072) 1 7456 . 0 ) log( 6651 . 1 8105 . 1 ^ FC M
NParties= + +
252 . 0
2 =
R , n=29, F −Statistic=4.380, p−value=0.023
where NParties stands for the effective number of parties.
We confirm that district magnitude is relevant for the effective number of parties
but “freedom of choice” has no significant effect.24
23
An important consequence of this result is that changes in electoral systems that
increase voters’ “freedom of choice” do not have a significant negative impact, as could
be expected, on a more fragmented parliament and therefore they do not stimulate
increased instability in parliamentary regimes.
We also estimate the possible effect of “freedom of choice” on proportionality
and reach a similar conclusion. The FC1 index is not statistically significant but the
district magnitude is, now, marginally significant.
(0.0273) (0.0229) 1 0213 . 0 ) log( 0476 . 0 8448 . 0 ^ FC M
LHindex= + +
162 . 0
2 =
R , n=29, F−Statistic=2.524, p−value=0.100
where LHindex is the Loosemore-Hanby index of proportionality.
The finding that “freedom of choice” does not affect these variables does not
lead to the conclusion that it should be considered a “weak” variable. The arguments
presented in section 2 that “freedom of choice” has an intrinsic value apart from an
instrumental value implies that increasing freedom is valued positively on its own. In
the next section, we will discuss some empirical evidence that suggests it can also have
24
Since FC1 is also a function of M, there is some correlation between the independent variables.
Although this introduces some multicollinearity into the model, the conclusions about the dependency
between the effective number of parties and each variable are not affected. We can verify that “freedom
of choice” has no impact on the effective number of parties estimating the regression
(0.5943) 1 5938 . 0 549 . 4 ^ FC
NParties= −
0357 . 0
2
=
R , n=29, F−Statistic=0.9982, p−value=0.3266.
We can also observe the dependency between the effective number of parties and logM
(0.4483) ) log( 242 . 1 010 . 3 ^ M
NParties= +
221 . 0 2
=
an instrumental value concerning variables other then fragmentation of parliament and
proportionality.
5. Discussion
The freedom citizens have to express their political preferences and their
preferences concerning relevant characteristics of representatives to parliament
(congress) depend on the structure of polity. More decentralized structures of
government (in unitary or federal countries) are, ceteris paribus, associated with overall
greater freedom of choice. This means that the results of this paper should be interpreted
with some caution, since we only apply the index to national legislatures (lower
house).25 It is necessary to bear in mind that the role of the lower house is different in
parliamentary and presidential regimes and also in unicameral and bicameral regimes.26
Moreover, we have not considered an obvious important factor, the internal competition
within parties in organizing lists (when applicable).
Having these provisos in mind, this paper developed an index of freedom of
choice of members of parliament that takes into account three distinct dimensions:
voters’ “options” (the cardinality of the choice domain), “choices” (the number of
revealed preferences on candidates/parties), and “information” (on candidates
characteristics). Empirical evidence shows that the index can not be univocally
associated either with electoral systems, proportionality indices, effective number of
parties or other measures of electoral systems. In fact, one of the aims of developing
25
The index can also be applied to parliaments of States, Provinces or Lander in Federations. In those federations where there are significant linguistic, religious, ethnic, or other divisions and citizens are segregated in part according to these divisions, it is natural that if the electoral system is the same at national and regional levels, the effective number of parties is slightly higher at national level. Therefore, the average regional FC2 index should be smaller than the national FC2 index.
26
such an index is to be able to discriminate between electoral systems having similar
degrees of proportionality or similarly “fragmented” parliaments, as measured by the
effective number of parties.
The debate around the reform of electoral systems - namely the possible shifts
from majoritarian to mixed systems, or changes within proportional representation
regimes – arises from the fact that there are several relevant normative criteria (political
stability, fair representation, freedom of choice) and there are frequently tradeoffs
between them.27 For example, there is a possible tradeoff between political stability and
fair representation in parliamentary regimes: increased fairness of representation may
lead to a more “fragmented” parliament and more unstable coalition governments 28
The empirical analysis developed in this paper shows that there seems to be no
tradeoff between greater voter participation in the political process and either political
stability or fair representation. The conclusion that greater “freedom of choice” does not
have implications for proportionality or the effective number of parties has an important
normative implication for electoral reform. It shows that it is possible to design systems
with a greater role for voters’ participation in the political process without negative side
effects. Though, it does not follow that greater citizens’ freedom-of-choice is always
beneficial. Political parties’ role in screening candidates when selection follows a
competitive procedure may be important. Also, citizens have limited cognitive abilities
so that expanding freedom-of-choice after some point may have no significant
advantage.
27
See, among others, Boix (1999), Norris (2004), Rae (1995), Schugart (2001) and Sen (1995).
28
We have also shown that some ballot structures give more power to the voters
and less to the party elites in selecting representatives. Other ballot structures give
exclusive selection privileges to political parties, and still others aim for a more
balanced weight of voters and parties in the selection process. The importance of
measuring voters’ “freedom to choose” is precisely to weight the relative importance of
voters and political parties in selecting candidates.
The hypothesis, implicitly formulated by Stuart Mill, that the quality of
representatives, as measured by voters’ standards, will depend on voters’ freedom of
choice, can be tested controlling for the fact that it will also be a function of party
selection procedures. Intuition suggests that the worst situation is low competition
within parties, low freedom of choice and a presidential regime.
There is some evidence that the degree of voter satisfaction is higher in countries
where “freedom of choice is higher.”29 Other hypotheses that have been tested and that
deserve further research are the relationship between electoral systems and corruption,30
or the effects of freedom of choice on voter turnout, on the participation of women in
politics or the intertemporal consistency of electoral promises by elected representatives.
Acknowledgements
Paulo Pereira thanks the Leitner Program in International and Comparative Political
Economy at MacMillan Center for International and Area Studies, Yale University, for
its generous hospitality and also the financial support from the Calouste Gulbenkian
Foundation, the Technical University of Lisbon, and the research unit UECE/ISEG.
João Andrade e Silva thanks the research Unit CEMAPRE/ISEG. This research was
29
See Farrell and MacAllister (2006). An experiment in British Columbia (Canada) also reveals that one highly valued criterion for electoral reform is freedom-of-choice.
30
also partially supported by Fundação para a Ciência e a Tecnologia (program
FEDER/POCI 2010). The authors would like to thank Gerald Baier, Steve Brams,
Roman Davis, Bernie Grofman, Johanna Lacoe, Jerry Mashaw, Frank Neher, Susan
Rose-Ackerman, Mariano Tommasi and Rein Taagepera, and participants at a seminar
at Yale Law School and the meeting of the European Public Choice Society (Paris) for
References
Berlin, I., 1969. Four Essays on Liberty, Oxford University Press, Oxford.
Boix, C., 1999. Setting the Rules of the Game: the Choice of Electoral Systems in Advanced
Democracies. American Political Science Review 93 (3) 609-624.
Bowler, S. and Grofman, B. (eds.), 2000. Elections in Australia, Ireland and Malta under the Single
Transferable Vote: Reflections on an Embedded Institution. University of Michigan Press. Ann Arbor MI
Brams, S. and Fishburn, P., 1983. Approval Voting. Birkhauser Boston. Cambridge MA.
Chin, M. and Taylor-Robinson, M., 2005. The rules matter: an experimental study of the effects of
electoral systems on shifts in voters’ attention. Electoral Studies 24, 465-483
Carey, J. and Shugart, M., 1995. Incentives to Cultivate a Personal Vote: a Rank-ordering of Electoral
Formulas. Electoral Studies 14, 417-439
Farrell, D. and McAllister, I., 2006. Voter Satisfaction and Electoral Systems: Does Preferential Voting in
Candidate-Centered Systems Make a Difference?. European Journal of Political Research, 45, 723-749
Gallagher, M., 1991. Proportionality, Disproportionality and Electoral Systems. Electoral Studies 10,
52-59
Hare, T., 1859. The Election of Representatives: Parliamentary and Municipal. Longmans Green. London
Kuniková, J. and Rose-Ackerman, S., 2005. Electoral Rules and Constitutional Structures as Constraints
on Corruption. British Journal of Political Science, 35, 573-606.
Laakso, M. and Taagepera, R., 1979. Effective Number of Parties: a Measure With Application to West
Europe. Comparative Political Studies 12, 3-7
Lijphart, A., 1990. Political Consequences of Electoral Laws 1945-1985 American Political Science
Review, 84, 481-496.
Lijphart, A., 1994. Electoral Systems and Party Systems: a study of twenty seven democracies. Oxford
University Press. Oxford.
Loosemore, J. and Hanby, V., 1971. The Theoretical Limits of Maximum Distortion: Some Analytical
Mill, J, S., 1861., Considerations on Representative Government in Utilitarianism, Liberty and
Representative Government. L. M. Dent (Everyman ed. 1910). London.
Monroe, B. and Rose, A. 2002. Electoral Systems and Unimagined Consequences: Partisan Effects of
Districted Prportional Representation, American Journal of Political Science, 46(1), 67-89
Mueller, D., 1996. Constitutional Democracy. Oxford University Press. New York
Norris, P., 2004., Electoral Engineering, Voting Rules and Political Behavior. Cambridge University
Press. Cambridge.
Pattanaik, P. and Xu, Y., 1990. On Ranking Opportunity Sets in Terms of Freedom of Choice.
Recherches Economiques de Louvain, 56, 383-390
Rae, D., 1971. The Political Consequences of Electoral Laws (2nd edition), Yale University Press, New
Haven
Rae, D., 1995. Using District Magnitude to Regulate Political Party Competition. Journal of Economic
Perspectives, 9 (1), 65-75
Schugart, M., 2001. Electoral Efficiency and the Move to Mixed Member Systems. Electoral Studies 20,
173-193
Sen, A., 1988. Freedom of Choice: Concept and Content. European Economic Review 32, 269-294
Sen, A., 1991. Welfare, Preference and Freedom. Journal of Econometrics 50, 15-29
Sen, A., 1995. How to Judge Voting Systems. Journal of Economic Perspectives, 9 (1), 91-98
Spiller, P. and Tommasi, M., 2007. The Institutional Foundations of Public Policy in Argentina.
Cambridge University Press. Cambridge.
Taagepera, R., 2002. Nationwide Threshold of Representation. Electoral Studies, 21, 383-401
Taagepera, R. and Shugart, M., 1989., Seats and Votes: The Effects and Determinants of Electoral
Systems. Yale University Press. New Haven.
Taagepera, R. and Shugart, M., 1993. Predicting the Number of Parties: a Quantitative Model of
Table A1 Countries ranked by increasing degree of proportionality of electoral systems
Ballot Structure Country Number Number Number
Number
of Number Prop. Number
Mean
District Effective Index Prop.
of MPs of SMD of MMD Districts
of List
MP LMP/MPs of MPs Magnitude N. Parties
(Loosemoore-Hanby) Candidate-ballot UK 659 659 0 659 0 0% 659 1.00 2.11 0.80
Preference-ballot Poland 460 0 52 52 460 100% 460 8.85 2.95 0.82
Candidate-ballot Canada 301 301 0 301 0 0% 301 1.00 2.98 0.83
Party Ballot Portugal 230 0 22 22 230 100% 230 10.45 3.14 0.83
Cand-Pref-Ballot Austrália 148 148 0 148 0 0% 148 1.00 2.61 0.84
Dual Ballot Korea 299 253 1 254 46 15% 299 1.18 2.36 0.84
Preference-ballot Slovenia 90 0 8 8 90 100% 90 11.25 5.52 0.84
Dual Ballot Japan 500 300 11 311 200 40% 500 1.61 2.93 0.86
Dual Ballot Hungary 386 176 20 196 210 54% 386 1.97 3.45 0.86
Dual Ballot Ukraine 450 225 1 226 225 50% 450 1.99 5.98 0.86
Dual Ballot Thailand 500 400 1 401 100 20% 500 1.25 2.92 0.88
Rank-order Ireland 166 0 42 42 166 100% 166 3.95 3.39 0.88
Dual Ballot Rússia 450 225 1 226 225 50% 450 1.99 5.40 0.89
Preference-ballot Czech Republic 200 0 8 8 200 100% 200 25.00 4.15 0.89
Party Ballot Romania 343 0 42 42 343 100% 343 8.17 3.37 0.92
Dual Ballot México 500 300 5 305 200 40% 500 1.64 2.86 0.92
Party Ballot Spain 350 0 52 52 350 100% 350 6.73 2.73 0.93
Preference-ballot Switzerland 200 0 26 26 200 100% 200 7.69 5.08 0.93
Candidate-ballot USA 435 435 0 435 0 0% 435 1.00 1.99 0.94
Dual Ballot Germany 656 328 1 329 328 50% 656 1.99 3.30 0.94
Party Ballot Norway 165 0 19 19 165 100% 165 8.68 4.36 0.95
Party Ballot Netherlands 150 0 1 1 150 100% 150 150.00 4.81 0.95
Dual Ballot Taiwan 334 234 2 236 100 30% 334 1.42 2.46 0.95
Party Ballot Israel 120 0 1 1 120 100% 120 120.00 5.63 0.96
Dual Ballot New Zealand 120 65 1 66 55 46% 120 1.82 3.78 0.96
Preference-ballot Belgium 150 0 20 20 150 100% 150 7.50 9.05 0.96
Preference-ballot Sweden 349 0 29 29 349 100% 349 12.03 4.29 0.97
Rank-order Malta 65 0 13 13 65 100% 65 5.00 2.00 0.98
Preference-ballot Denmark 179 0 17 17 179 100% 179 10.53 4.92 0.98