Arq. Bras. Med. Vet. Zootec., v.67, n.2, p.535-546, 2015
Lipid profile and cholesterol of pork with the use of glycerin in feeding
[Perfil lipídico e colesterol da carne de suínos com uso de glicerina na alimentação]
P.B. Faria1, V.S. Cantarelli1, E.T. Fialho1, A.M.B.G. Pinto1, J.H. Faria1, M.F.M. Rocha1, M.C. Guerreiro1, M.C. Bressan2
1Universidade Federal de Lavras – UFLA Lavras, MG 2Instituto Nacional de Recursos Biológicos – INRB Santarém, Portugal
ABSTRACT
The aim of this work was to evaluate the effects of adding different levels of glycerin in the feeding on the lipid profile and cholesterol of the meat of finishing pigs. The experiment was arranged in a completely randomized design (CRD) with factorial 5x2, being five levels of glycerin in the diet and two genders. Sixty (60) swine of the Topigs genetics (30 barrows and 30 gilts) were used; they presented initial average weight of 79.3+4.0kg and were finished with the weight of 106.2+4.5kg. The levels of glycerin utilized were 0, 50, 100, 150 and 200g/kg in the natural matter. The analyses of lipid and cholesterol profile were conducted in the muscles longissimus dorsi (loin) and semimembranosus (ham) on the left side of the carcasses. Interaction occurred between the levels of crude glycerin in the diet and the sexual category for the profile of fatty acids and cholesterol. On the loin the meat of the barrows presented higher means of C16:0, C16:1, C20:3ω3, C18:1ω9c, Total of saturated (SFA) and monounsaturated (MUFA) fatty acids. On the ham, increased means were found for the fatty acids C18:1ω9c, MUFA, activity of ∆9-desaturaseC18 and ElongaseC16-18 in barrows. The sows’ meat presented higher proportions of polyunsaturated fatty acids and of the series ω6 for both the cuts. The amount of cholesterol in the sows’ meat presented increase according to the level of glycerin in the meat. The barrows’ meat presented indices of atherogenicity greater than the gilts. The levels of glycerin altered the lipid profile and cholesterol content according to the sexual category, promoting a distinct effect on the loin and ham.
Keywords: biofuel, fatty acids, nutritional composition
RESUMO
O objetivo deste trabalho foi avaliar os efeitos do fornecimento de diferentes níveis de glicerina na alimentação sobre o perfil lipídico e colesterol da carne de suínos em terminação. O delineamento experimental foi organizado inteiramente ao acaso (DIC), com fatorial 5x2, sendo: cinco níveis de glicerina na dieta e dois sexos. Foram utilizados 60 suínos da genética Topigs (30 machos castrados e 30 fêmeas), apresentando peso médio inicial de 79,3+4,0kg, e foram terminados com peso de 106,2+4,5kg. Os níveis de glicerina utilizados foram de 0, 50, 100, 150 e 200g/kg na matéria natural. As análises de perfil lipídico e de colesterol foram realizadas nos músculos longissimus dorsi (lombo) e semimembranosus (pernil) do lado esquerdo das carcaças. Ocorreu interação entre os níveis de glicerina bruta na dieta e a categoria sexual para o perfil de ácidos graxos e colesterol. A carne dos machos castrados apresentou no lombo maiores médias de C16:0, C16:1, C20:3ω3, C18:1ω9c, Total de ácidos graxos Saturados (SFA) e Monoinsaturados (MUFA). No pernil, maiores médias foram verificadas para os ácidos graxos C18:1ω9c, MUFA, atividade da ∆9 -desaturaseC18 e ElongaseC16-C18 em machos castrados. A carne das fêmeas suínas apresentou maiores proporções de ácidos graxos poli-insaturados e da série ω6 para ambos os cortes. A quantidade de colesterol na carne das fêmeas suínas apresentou aumento em função do nível de glicerina na dieta. A carne dos machos castrados apresentou maiores índices de aterogenicidade que das fêmeas. Os níveis de glicerina alteraram o perfil lipídico e teor de colesterol em função da categoria sexual, promovendo efeito diferenciado no lombo e pernil.
Palavras-chave: biocombustível, ácidos graxos, composição nutricional
Recebido em 6 de agosto de 2013 Aceito em 7 de agosto de 2014 E-mail: peterbfvet@yahoo.com.br
INTRODUCTION
Crude glycerin is one of the by-products of biodiesel production, its use has been growing in animal feeding as a way of reducing the costs of the diets of the several meat-producing species. Crude glycerin contains glycerol contents ranging from 80 to 95 %, this being a precursor for triacylglycerol and phospholipids synthesis in the liver and adipose tissue (Boyle, 2005; Cerrate et al., 2006).
In general pork presents a predominance of the fatty acids oleic (C18:1ω9), palmitic (C16:0), linoleic (C18:2ω6), stearic (C18:0) and arachidonic (C20:4ω6) (Wood et al., 2003; Nuernberg et al., 2005; Teye et al., 2006). Nevertheless, one of the main factors which lead to the deposition of fatty acids as well as their profiles, is the feeding that the animals receive (Mitchaothai et al., 2007).
However, the increase in the level of information of the world population as to the importance of a diet with lower levels of saturated fat has led to increased search for meats which present, in their characteristics, better balance between saturated, monounsaturated and polyunsaturated fatty acids and low ratio ω6/ω3. The content in essential fatty acids plays an outstanding role in human nutrition, since they are integrant of cell structures and precursors of the synthesis of several substances essential to the maintenance of the physiological processes (Perini et al., 2010).
In this way, studies should be conducted on crude glycerin, since glycerol is utilized in lipogenesis and even in gluconeogenesis, which could contribute towards the increase in the lipid contents and modification of the lipid profile in pork.
MATERIAL AND METHODS
The animals were reared in the Finishing House of the Swine Culture Sector of the Animal Science Department of the Federal University of Lavras (UFLA) in the municipality of Lavras - MG. Thirty barrows and 30 gilts of the genetics Topigs, with initial average weight of 79.3+4.00kg and finished with weight of
106.2+4.5kg were utilized. This study was approved by the Ethics Committee on Animal Use UFLA with protocol number 011/2010. The experiment was arranged in a completely randomized design (CRD) with factorial 5x2, being five levels of glycerin in the diet (0, 50, 100, 150 and 200g/kg) and two genders (male (barrow) and female (gilt)), with 6 replicates per treatment and each experimental unit consisted of one animal, totaling 60 pigs. The experimental diets were formulated on the basis of corn and soybean meal, supplemented with vitamins, minerals and aminoacids to meet the minimum requirements for barrows of high genetic potential from 70 to 100kg (Table 1) with the utilization of different levels of crude glycerin.
The treatments were carried out in the following way: Treatment 1 – basal diet without the addition of glycerin; Treatment 2 – 50g/kg of glycerin instead of corn in the basal diet in the natural matter; Treatment 3 – 100g/kg of glycerin instead of corn in the basal diet in the natural matter; Treatment 4 - 150g/kg of glycerin instead of corn in the basal diet in the natural matter and, Treatment 5 - 200g/kg of glycerin instead of corn in the basal diet in the natural matter. The animals were given water and feed ad libitum during the experimental period of 30 days.
At the end of the experiment, after fasting and water diets for 12 hours’ time, the animals were slaughtered under humanitarian conditions through electric insensibilization (electronarcosis) with later bleeding and evisceration.
Table 1. Centesimal composition and values calculated in the experimental diets
Ingredients 0 Levels of glycerin50 1 (g/kg of natural matter) 100 150 200
Ground corn 707 654.5 603.0 551.0 499.0
Soybean meal 229 238 247 258 266
Crude glycerin 0 50 100 150 200
Soybean oil 20.0 16.8 13.3 9.0 5.9
Bicalcium phosphate 11.2 11.2 11.2 11.2 11.2
Calcitic limestone 7.7 7.7 7.7 7.7 7.7
Salt (NaCl) 3.6 1.35 0 0 0
Mineral Premix 2 1.0 1.0 1.0 1.0 1.0
Vitamin Premix 3 1.0 1.0 1.0 1.0 1.0
DL-Metionina 99 0.09 0.1 0.1 0.1 0.15
L-Lysine 99 1.5 1.35 1.2 1.0 0.9
L-Threonine 98 0.07 0.07 0.07 0.07 0.07
Tylan4 0.2 0.2 0.2 0.2 0.2
Caulim 17.64 16.73 14.23 9.73 6.88
Calculated Values
Metabolizabale Energy (KCal/kg) 3.250 3.250 3.250 3.250 3.250
Digestible Lysin (g/kg) 8.19 8.21 8.23 8.27 8.31
Digestible Methionine (g/kg) 2.50 2.50 2.50 2.50 2.50
Crude protein (g/kg) 160,2 160.2 160.2 160.2 160.2
Digestible threonine (g/kg) 5.50 5.50 5.50 5.50 5.50
Available phosphosrus (g/kg) 3.00 3.00 3.00 3.00 3.00
Calcium (g/kg) 6.50 6.50 6.50 6.50 6.50
1 Glycerin composition: Sodium chloride, 36.8g/kg; Sodium, 25,1g/kg; Methanol, 0,2g/kg; Organic Residues, <0,1g/kg;
Moisture,111.2g/kg; Ashes, 60,6g/kg; Density, 1,264g/ml; Glycerol, 831,2g/kg; Color: Light yellow; 2 Composition, per kg of the product: calcium, 98.800mg; cobalt, 185mg; copper, 15.750mg; iron, 26.250mg; iodine, 1.470mg; manganese, 41.850mg; zinc, 77.999mg. 3 Composition, per kg of the product: folic acid, 116.55mg; panthotenic acid, 2.333,5mg; biotin, 5,28 mg; niacin, 5.600mg; pyridoxine, 175mg; riboflavin, 933,3mg; thiamine, 175mg; Vit. A, 1.225.000U.I.; Vit. D3, 315.000U.I.; Vit. E, 1.400mg; Vit. K3, 700mg; Vit B12, 6.825mg; Selenium, 105mg; Antioxidant: 1.500mg.; 4 Antibiotic on the basis of granulated tylosin.
For the analysis of cholesterol and fatty acids (FA), lipids were extracted according to the procedures described by Folch et al. (1957) being esterified and separated (Hartman and Lago, 1973). Cholesterol was quantified by colorimetry, with a modification of the method of Bohac et al. (1988), as described by Bragagnolo and Rodriguez-Amaya (2002) and the results were expressed in mg/100g of meat.
The analysis of fatty acids was done by gas chromatography in a chromatograph Shimatzu CG 2010 (Agilent Technologies Inc., Palo Alto, CA, USA), equipped with a flame ionization detector, split injector at the rate of 1:50 and capillary column of Supelco SPTM-2560, 100m X 0.25mm X 0.20 μm (Supelco Inc., Bellefonte, PA, USA). The chromatographic conditions were initial temperature of the column of 140ºC/5 minutes; increased 4ºC/minute to 240ºC and kept for 30 minutes, amounting to 60 minutes. The injector temperature was 260ºC and that of the detector 260ºC. The carrier gas utilized was helium. The fatty acids were identified by
comparison with the retention times presented by the chromatographic standard SupelcoTM37 standard FAME Mix (Supelco Inc., Bellefonte, PA, USA) and expressed in percentage (%) of the total of fatty acids identified and afterwards grouped together into: Total of Saturated Fatty Acids (SFA), Total of Monounsaturated Fatty Acids (MUFA) and Total of Polyunsaturated Fatty Acids (PUFA).
The activity of enzyme ∆9 desaturase and elongase was estimated according to Malau-Aduli et al. (1998) and Kazala et al. (1999). The indices of atherogenicity and thrombogenicity, considered as a health indicator related to the risk of cardiovascular disease, were computed according to Ulbricht and Southgate (1991).
RESULTS AND DISCUSSION
The use of different levels of crude glycerin showed distinct efficiency in the lipid profile of the loin for the sexual categories utilized, an interaction among these factors being found for the following fatty acids: pentadecanoic (C15:0); stearic (C18:0); Oleic (C18:1ω9); Linoleic (C18:2ω6); Arachidonic
(C20:4ω6); Total of Monounsaturated acids (MUFA); Total of Polyunsaturated acids (PUFA); Total of ω6; Ratio Polyunsaturated/Saturated acids (PUFA/SFA); Activity of ∆9-desaturaseC16; Activity of ∆ 9-desaturaseC18; Activity of Elongase C16-C18 (Table 2).
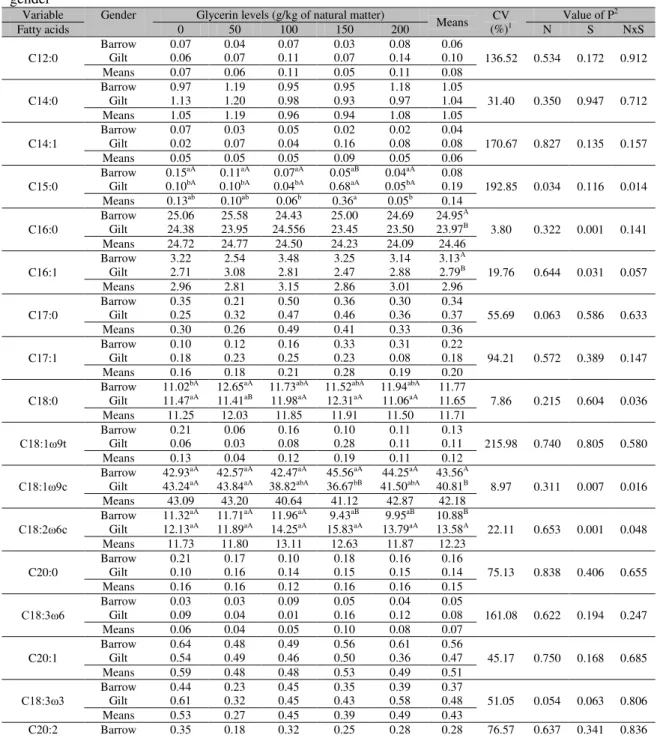
Table 2. Composition of the fatty acids of the loin of pigs depending on the glycerine level of feeding and gender
Variable Gender Glycerin levels (g/kg of natural matter)
Means (%)CV 1 Value of P 2
Fatty acids 0 50 100 150 200 N S NxS
C12:0
Barrow 0.07 0.04 0.07 0.03 0.08 0.06
136.52 0.534 0.172 0.912
Gilt 0.06 0.07 0.11 0.07 0.14 0.10
Means 0.07 0.06 0.11 0.05 0.11 0.08
C14:0
Barrow 0.97 1.19 0.95 0.95 1.18 1.05
31.40 0.350 0.947 0.712
Gilt 1.13 1.20 0.98 0.93 0.97 1.04
Means 1.05 1.19 0.96 0.94 1.08 1.05
C14:1
Barrow 0.07 0.03 0.05 0.02 0.02 0.04
170.67 0.827 0.135 0.157
Gilt 0.02 0.07 0.04 0.16 0.08 0.08
Means 0.05 0.05 0.05 0.09 0.05 0.06
C15:0
Barrow 0.15aA 0.11aA 0.07aA 0.05aB 0.04aA 0.08
192.85 0.034 0.116 0.014 Gilt 0.10bA 0.10bA 0.04bA 0.68aA 0.05bA 0.19
Means 0.13ab 0.10ab 0.06b 0.36a 0.05b 0.14
C16:0
Barrow 25.06 25.58 24.43 25.00 24.69 24.95A
3.80 0.322 0.001 0.141 Gilt 24.38 23.95 24.556 23.45 23.50 23.97B
Means 24.72 24.77 24.50 24.23 24.09 24.46
C16:1
Barrow 3.22 2.54 3.48 3.25 3.14 3.13A
19.76 0.644 0.031 0.057
Gilt 2.71 3.08 2.81 2.47 2.88 2.79B
Means 2.96 2.81 3.15 2.86 3.01 2.96
C17:0
Barrow 0.35 0.21 0.50 0.36 0.30 0.34
55.69 0.063 0.586 0.633
Gilt 0.25 0.32 0.47 0.46 0.36 0.37
Means 0.30 0.26 0.49 0.41 0.33 0.36
C17:1
Barrow 0.10 0.12 0.16 0.33 0.31 0.22
94.21 0.572 0.389 0.147
Gilt 0.18 0.23 0.25 0.23 0.08 0.18
Means 0.16 0.18 0.21 0.28 0.19 0.20
C18:0
Barrow 11.02bA 12.65aA 11.73abA 11.52abA 11.94abA 11.77
7.86 0.215 0.604 0.036 Gilt 11.47aA 11.41aB 11.98aA 12.31aA 11.06aA 11.65
Means 11.25 12.03 11.85 11.91 11.50 11.71
C18:1ω9t Barrow Gilt 0.21 0.06 0.06 0.03 0.08 0.16 0.10 0.28 0.11 0.11 0.11 0.13 215.98 0.740 0.805 0.580
Means 0.13 0.04 0.12 0.19 0.11 0.12
C18:1ω9c Barrow 42.93
aA 42.57aA 42.47aA 45.56aA 44.25aA 43.56A
8.97 0.311 0.007 0.016 Gilt 43.24aA 43.84aA 38.82abA 36.67bB 41.50abA 40.81B
Means 43.09 43.20 40.64 41.12 42.87 42.18
C18:2ω6c Barrow 11.32
aA 11.71aA 11.96aA 9.43aB 9.95aB 10.88B
22.11 0.653 0.001 0.048 Gilt 12.13aA 11.89aA 14.25aA 15.83aA 13.79aA 13.58A
Means 11.73 11.80 13.11 12.63 11.87 12.23
C20:0
Barrow 0.21 0.17 0.10 0.18 0.16 0.16
75.13 0.838 0.406 0.655
Gilt 0.10 0.16 0.14 0.15 0.15 0.14
Means 0.16 0.16 0.12 0.16 0.16 0.15
C18:3ω6 Barrow Gilt 0.03 0.09 0.03 0.04 0.01 0.09 0.05 0.16 0.04 0.12 0.08 0.05 161.08 0.622 0.194 0.247
Means 0.06 0.04 0.05 0.10 0.08 0.07
C20:1
Barrow 0.64 0.48 0.49 0.56 0.61 0.56
45.17 0.750 0.168 0.685
Gilt 0.54 0.49 0.46 0.50 0.36 0.47
Means 0.59 0.48 0.48 0.53 0.49 0.51
C18:3ω3 Barrow Gilt 0.44 0.61 0.32 0.23 0.45 0.45 0.35 0.43 0.39 0.58 0.48 0.37 51.05 0.054 0.063 0.806
Means 0.53 0.27 0.45 0.39 0.49 0.43
Variable Gender Glycerin levels (g/kg of natural matter) Means CV
(%)1 Value of P
2
Fatty acids 0 50 100 150 200 N S NxS
Gilt 0.29 0.29 0.40 0.28 0.43 0.34
Means 0.32 0.24 0.36 0.27 0.36 0.31
C20:3ω6 Barrow Gilt 0.28 0.21 0.27 0.15 0.23 0.33 0.15 0.27 0.23 0.27 0.27 0.21 92.09 0.924 0.288 0.823
Means 0.25 0.21 0.28 0.21 0.25 0.24
C22:1ω9 Barrow Gilt 0.10 0.02 0.01 0.17 0.10 0.08 0.12 0.09 0.04 0.15 0.10 0.07 222.29 0.981 0.478 0.544
Means 0.06 0.09 0.09 0.10 0.09 0.09
C20:3ω3 Barrow 0.04 0.09 0.03 0.05 0.04 0.05
A
244.37 0.586 0.036 0.993
Gilt 0.00 0.03 0.00 0.01 0.01 0.01B
Means 0.02 0.06 0.01 0.03 0.02 0.03
C20:4ω6 Barrow 2.24
aA 1.71aA 2.06aB 1.62aB 2.12aA 1.95B
40.94 0.082 0.001 0.025 Gilt 2.41bA 2.04bA 3.48abA 4.40aA 3.28abA 3.12A
Means 2.32 1.87 2.77 3.01 2.70 2.54
C20:5ω3 Barrow Gilt 0.02 0.03 0.08 0.01 0.10 0.05 0.07 0.01 0.02 0.05 0.04 0.05 178.51 0.606 0.683 0.209
Means 0.03 0.04 0.07 0.04 0.03 0.04
C22:6ω3 Barrow Gilt 0.08 0.05 0.07 0.01 0.10 0.07 0.03 0.14 0.05 0.08 0.07 0.06 125.34 0.609 0.566 0.143
Means 0.06 0.04 0.09 0.09 0.06 0.07
aSFA Barrow 37.83 39.95 37.84 38.08 38.39 38.42
A
4.10 0.350 0.021 0.056
Gilt 37.50 37.20 38.32 38.06 36.24 37.46B
Means 37.66 38.58 38.08 38.07 37.31 37.94
bMUFA Barrow 47.37
aA 45.79aA 46.89aA 49.93aA 48.48aA 47.69A
8.83 0.499 0.004 0.014 Gilt 46.69aA 47.91aA 42.57abA 40.41bB 45.17abA 44.55B
Means 47.03 46.85 44.73 45.17 46.82 46.12
cPUFA Barrow 14.80
aA 14.25aA 15.27aA 11.99aB 13.13aB 13.89B
23.49 0.432 0.001 0.033 Gilt 15.82abA 14.88bA 19.12abA 21.53aA 18.60abA 17.99A
Means 15.31 14.57 17.19 16.76 15.86 15.94
dΣω3 Barrow Gilt 0.58 0.69 0.34 0.47 0.60 0.65 0.49 0.59 0.50 0.71 0.60 0.53 44.28 0.183 0.269 0.631
Means 0.63 0.41 0.62 0.54 0.61 0.56
eΣω6 Barrow 13.87
aA 13.60aA 14.35aA 11.25aB 12.35aB 13.08B
23.83 0.461 0.001 0.027 Gilt 14.84bA 14.23bA 18.07abA 20.66aA 17.45abA 17.05A
Means 14.36 13.92 16.21 15.95 14.90 15.07
fΣω6/Σω3 Barrow Gilt 28.90 23.69 64.16 32.90 36.58 30.16 27.41 51.43 25.62 26.04 39.10 30.28 86.55 0.316 0.260 0.402
Means 26.29 48.53 33.37 39.42 25.83 34.69
gPUFA/SFA Barrow 0.39
aA 0.36aA 0.40aA 0.32aB 0.34aB 0.36B
23.76 0.399 0.001 0.046 Gilt 0.42abA 0.40bA 0.50abA 0.57aA 0.52abA 0.48A
Means 0.41 0.38 0.45 0.44 0.43 0.42
h∆
9-desaturaseC16
Barrow 11.31abA 8.98bB 12.47aA 11.49abA 11.27abA 11.10
18.25 0.617 0.181 0.037 Gilt 10.02aA 11.40aA 10.23aA 9.51aA 10.93aA 10.42
Means 10.66 10.19 11.35 10.50 11.10 10.76
i∆
9-desaturaseC18
Barrow 79.54aA 76.91aA 78.20aA 79.81aA 78.67aA 78.62
3.40 0.250 0.141 0.020 Gilt 78.95aA 79.23aA 76.15abA 74.79bB 78.89aA 77.60
Means 79.24 78.07 77.17 77.29 78.78 78.11
jElongase
C16-C18
Barrow 52.18aA 50.98aA 51.61aA 53.39aA 52.61aA 52.15
5.31 0.298 0.274 0.041 Gilt 52.81aA 53.20aA 49.46aA 48.89aB 52.50aA 51.37
Means 52.50 52.09 50.54 51.14 52.55 51.76
lThioesterase
C16-14
Barrow 96.30 95.57 96.31 96.35 95.42 95.99
1.30 0.394 0.652 0.743
Gilt 95.55 95.23 96.16 96.23 96.04 95.84
Means 95.93 95.40 96.23 96.29 95.73 95.92
Means followed by different letters (ab) in the line indicate difference between glycerin level; (AB) columna indicate difference
between sex by SNK test (α = 0,05). 1Coefficient of variation; 2N, S, N x S: effect of the supplementation with glycerin level, sex
Only the influence of the glycerin levels on the values in the loin of fatty acids C15:0 with highter means for 150g/kg (Table 2) were isolated. The gender influence on the values of fatty acids palmitic (C16:0); palmitoleic (C16:1); 11,14,17-eicosatrienoic (C20:3ω3), oleic (C18:1ω9c), Total of saturated fatty (SFA) and monounsaturated (MUFA) acids, with higher means for the barrows, were similar to that reported by Nuernberg et al. (2005), Tikk et al. (2007), Zhang et al. (2007), Alonso et al. (2009) and Mas et al. (2010).
The barrows had higher values of palmitic fatty acids (C16:0), palmitoleic (C16:1), C20:3ω3 and Total of Saturated Faty acids (SFA) in the loin, ham here while in the more meas of MUFA, activity of ∆9-desaturaseC18 and Elongase C16-C18.
For the loin, there was distinct behavior of the glycerin levels according to the gender, revealing that effect in the barrows for the fatty acid oleic (C18:0) and activity of enzyme Δ9-desaturaseC16 with 50g/kg and 100g/kg glicerin levels, respectively. In the gilts, poorer amounts of oleic acid (C18:1ω9) were found, which showed a decrease along with the activity of the enzyme Δ9-desaturaseC18 and ElongaseC16-C18 according to the levels of glycerin of 150g/kg in the diet, which brought about similar behavior and the reduction of the total of monounsaturated fatty acids (MUFA) compared to barrows and glicerin levels.
Interaction was verified between the glycerin levels and gender, which revealed the C15:0, PUFA, Σω6, C18:2ω6, C20:4ω6, Ratio PUFA/SFA for the 150g/kg glicerin level means for gilts (Table 2), which showed that dietary levels of glycerin interfered in the fatty acids composition of the meat of gilts in relation to the series w6 fatty acids to increase the amounts of polyunsaturated fatty acids, while in barrows this effect did not occur. In general barrows present increased lipogenesis activity than the gilts. That effect is due to the absence of anabolic stimuli, since androgens exercise a direct effect upon the musculature and estrogens promote a greater release of growth hormone and insulin-like
growth factor (IGF-I), increasing the deposition of aminoacids and glucose into the muscle (Clapper et al., 2000). The results found in this study may be related to the increased rate of intramuscular and subcutaneous deposition of lipids that is supported by emasculation, promoting a greater deposition of saturated fatty acids, whereas in the gilts, higher concentrations of polyunsaturated fatty acids are found in total lipids or triacylglycerols (Alonso et al., 2009; Mas et al., 2010).
There was an influence of the glycerin levels on the values of fatty acids identified in the ham, regardless of gender (Table 3). For the ham, greater means of the fatty acids oleic (C18:1ω9c), MUFA and ∆9-desaturaseC18 activity were found in barrows. These results may be related to a greater activity of the enzymes ElongaseC16-C18 (Table 3) and ∆ 9-desaturases in the barrows meat, since this acts in the removal of hydrogen molecules of the carbonated chains of saturated fatty acids, increasing the formation of monounsaturated fatty acids cis-9, such as palmitoleic and oleic (Hayashi et al., 2007; Metz et al., 2009).
Table 3. Composition of the fatty acids of the swine ham according to the glycerin level of feeding and gender
Variable Gender Glycerin levels (g/kg of natural matter) Means CV1 (%)
Value of P2
Fatty acids 0 50 100 150 200 N S NxS
C12:0
Barrow 0.17 0.08 0.13 0.12 0.09 0.12
124.51 0.161 0.051 0.612
Gilt 0.07 0.02 0.16 0.03 0.02 0.06
Means 0.12 0.05 0.15 0.07 0.06 0.09
C14:0
Barrow 1.09 0.91 1.09 1.09 1.24 1.08
27.39 0.153 0.767 0.105
Gilt 0.93 1.06 1.40 0.91 0.99 1.06
Means 1.01 0.98 1.25 1.00 1.12 1.07
C14:1
Barrow 0.08 0.02 0.02 0.04 0.01 0.03
159.89 0.616 0.390 0.614
Gilt 0.05 0.06 0.04 0.04 0.05 0.05
Means 0.07 0.04 0.03 0.04 0.03 0.04
C15:0
Barrow 0.07 0.07 0.09 0.08 0.09 0.08
89.34 0.220 0.166 0.404
Gilt 0.07 0.07 0.08 0.14 0.19 0.11
Means 0.07 0.07 0.09 0.11 0.14 0.10
C16:0
Barrow 23.44aA 23.66aA 24.16aA 23.64aA 24.40aA 23.86
4.27 0.799 0.267 0.045 Gilt 23.63aA 23.89aA 22.98aB 24.36aA 22.96aB 23.57
Means 23.54 23.77 23.57 24.00 23.68 23.71
C16:1
Barrow 3.33 2.77 3.10 3.01 3.31 3.10
23.02 0.419 0.304 0.718
Gilt 2.94 2.81 3.31 2.59 2.94 2.92
Means 3.13 2.79 3.20 2.80 3.13 3.01
C17:0
Barrow 0.44 0.44 0.32 0.56 0.32 0.42
50.39 0.463 0.791 0.059
Gilt 0.30 0.58 0.41 0.34 0.54 0.43
Means 0.37 0.51 0.37 0.45 0.43 0.42
C17:1
Barrow 0.47 0.35 0.20 0.39 0.34 0.35
90.15 0.955 0.071 0.319
Gilt 0.12 0.30 0.28 0.17 0.26 0.23
Means 0.30 0.32 0.24 0.28 0.30 0.29
C18:0
Barrow 10.00 10.74 11.33 10.54 10.73 10.67
11.83 0.384 0.067 0.256 Gilt 11.07 11.40 11.08 12.38 10.55 11.29
Means 10.53 11.07 11.20 11.46 10.64 10.98
C18:1ω9t Barrow Gilt 0.10 0.04 0.02 0.05 0.02 0.03 0.04 0.01 0.07 0.05 0.03 0.05 185.34 0.477 0.217 0.846
Means 0.07 0.03 0.02 0.02 0.06 0.04
C18:1ω9c Barrow 43.37 43.22 42.87 44.75 45.17 43.88
A
10.79 0.692 0.001 0.961 Gilt 40.44 38.88 39.23 39.19 41.71 39.89B
Means 41.90 41.05 41.05 41.97 43.44 41.88
C18:2ω6c Barrow 12.94 13.36 12.38 11.97 10.15 12.16
B
19.83 0.534 0.001 0.727 Gilt 15.23 15.20 14.88 15.22 14.83 15.07A
Means 14.09 14.28 13.63 13.60 12.49 13.62
C20:0
Barrow 0.18 0.15 0.12 0.12 0.15 0.14
82.14 0.232 0.330 0.248
Gilt 0.13 0.06 0.04 0.21 0.14 0.12
Means 0.16 0.10 0.08 0.16 0.14 0.13
C18:3ω6 Barrow Gilt 0.02 0.08 0.06 0.06 0.04 0.13 0.03 0.03 0.06 0.05 0.07 0.04 160.14 0.701 0.201 0.561
Means 0.05 0.06 0.08 0.03 0.05 0.06
C20:1
Barrow 0.47 0.45 0.65 0.58 0.65 0.56
59.23 0.858 0.947 0.554
Gilt 0.60 0.65 0.59 0.38 0.55 0.55
Means 0.53 0.55 0.62 0.48 0.60 0.56
C18:3ω3 Barrow Gilt 0.29 0.47 0.45 0.45 0.35 0.45 0.30 0.29 0.34 0.30 0.39 0.35 53.57 0.312 0.369 0.617
Means 0.38 0.45 0.40 0.30 0.32 0.37
C20:2
Barrow 0.31 0.27 0.29 0.35 0.27 0.30
66.77 0.912 0.859 0.341
Gilt 0.28 0.35 0.38 0.16 0.36 0.31
Means 0.30 0.31 0.34 0.26 0.31 0.30
C20:3ω6 Barrow Gilt 0.32 0.21 0.24 0.19 0.15 0.40 0.27 0.17 0.24 0.44 0.29 0.23 89.86 0.720 0.382 0.209
Means 0.26 0.22 0.27 0.22 0.34 0.26
C22:1ω9 Barrow Gilt 0.08 0.01 0.14 0.04 0.00 0.03 0.00 0.01 0.15 0.02 0.04 0.05 290.53 0.466 0.707 0.287
Means 0.04 0.09 0.02 0.01 0.09 0.05
C20:3ω3 Barrow Gilt 0.12 0.03 0.01 0.06 0.04 0.09 0.04 0.05 0.02 0.02 0.04 0.06 192.24 0.597 0.503 0.461
Variable Gender Glycerin levels (g/kg of natural matter) Means CV1 (%)
Value of P2
Fatty acids 0 50 100 150 200 N S NxS
C20:4ω6 Barrow 2.38 2.30 2.39 1.90 1.40 2.07
B
45.74 0.399 0.001 0.969
Gilt 3.16 3.51 3.71 3.16 2.87 3.28A
Means 2.77 2.91 3.05 2.52 2.13 2.68
C20:5ω3 Barrow Gilt 0.06 0.05 0.07 0.01 0.04 0.10 0.05 0.01 0.02 0.02 0.05 0.03 254.98 0.722 0.552 0.666
Means 0.05 0.04 0.07 0.03 0.02 0.04
C22:6ω3 Barrow Gilt 0.07 0.06 0.02 0.04 0.07 0.14 0.05 0.08 0.05 0.06 0.07 0.06 131.87 0.341 0.421 0.639
Means 0.06 0.03 0.10 0.07 0.06 0.06
aSFA Barrow Gilt 35.39 36.20 37.07 36.04 37.24 36.15 36.15 38.36 37.00 35.41 36.64 36.37 5.16 0.407 0.578 0.094
Means 35.79 36.56 36.70 37.26 36.21 36.50
bMUFA Barrow 47.89 46.89 46.85 48.81 49.70 48.03
A
11.12 0.706 0.002 0.953 Gilt 44.20 42.86 43.50 42.39 45.57 43.70B
Means 46.04 44.88 45.18 45.60 47.64 45.87
cPUFA Barrow 16.50 16.75 15.74 14.96 12.54 15.29
B
21.96 0.458 0.001 0.827 Gilt 19.57 19.92 20.28 19.17 18.94 19.58A
Means 18.03 18.33 18.01 17.06 15.74 17.44
dΣω3 Barrow Gilt 0.53 0.61 0.56 0.57 0.49 0.79 0.44 0.43 0.43 0.39 0.55 0.49 53.96 0.240 0.384 0.586
Means 0.57 0.56 0.64 0.43 0.41 0.52
eΣω6 Barrow 15.66 15.91 14.96 14.16 11.84 14.51
B
22.65 0.524 0.001 0.819 Gilt 18.68 19.02 19.11 18.58 18.19 18.72A
Means 17.17 17.47 17.03 16.37 15.02 16.61
fΣω6/Σω3 Barrow Gilt 40.48 37.30 38.74 28.72 40.08 32.91 37.79 52.98 30.38 59.53 44.29 35.49 60.57 0.702 0.164 0.367
Means 38.89 33.73 36.50 45.39 44.96 39.89
gPUFA/SFA Barrow 0.47 0.46 0.42 0.41 0.34 0.42
B
19.54 0.321 0.001 0.427
Gilt 0.54 0.53 0.56 0.50 0.53 0.53A
Means 0.50 0.50 0.49 0.45 0.43 0.48
h∆9-desaturaseC16 Barrow Gilt 12.42 11.04 10.53 10.47 11.31 12.54 11.28 9.55 11.83 11.33 11.46 11.00 20.98 0.363 0.450 0.559
Means 11.73 10.50 11.93 10.42 11.58 11.23
i∆9-desaturaseC18 Barrow 81.24 79.99 78.93 80.81 80.76 80.34 A
4.53 0.606 0.005 0.631 Gilt 78.17 76.98 77.96 75.75 79.55 77.68B
Means 79.70 78.48 78.45 78.28 80.15 79.01
jElongaseC16-C18 Barrow 54.10 53.67 52.51 54.53 54.02 53.76 A
6.53 0.701 0.005 0.630 Gilt 51.57 50.27 51.18 49.73 53.16 51.18B
Means 52.84 51.97 51.85 52.13 53.59 52.47
lThioesteraseC16-14 Barrow 95.58
aA 96.32aA 96.45aA 95.58aA 95.23aA 95.83
1.34 0.607 0.668 0.028 Gilt 96.21abA 95.74abA 94.26bB 96.42aA 95.82abA 95.69
Means 95.90 96.03 95.35 96.00 95.52 95.76
Means followed by different letters (ab) in the line indicate a difference between glycerin levels; (AB) columns indicate differences between sex by the SNK test (α = 0,05). 1Coefficient of variation; 2N, S, N x S: effect of the supplementation with glycerin level, sex and its interaction, respectively; aSum of SFA (C12:0 + C14:0 + C15:0 + C16:0 + C17:0 + C18:0 + C20:0); bSum of MUFA (C14:1 cis-9+C16:1 cis-9+ C17:1 cis-9+C18:1 cis-9+C20:1 cis-9 + C22:1 cis-9); cSum of PUFA (C18:2ω-6 + C18:3ω-6 + C18:3ω-3 + C20:4ω-6 + C20:3ω6 + C20:3ω3 + C20:5ω3 + C22:6ω-3); dSum of PUFA of the n-6 series (C18:2ω-6 + C18:3ω-6 + C20:4ω-6 + C20:3ω6); eSum of PUFA of the n-3 series (C18:3ω-3+ C20:3ω3 + C20:5ω3 + C22:6ω-3); fRatio PUFA/SFA (C18:2ω-6 + C18:3ω -6 + C18:3ω-3 + C20:4ω-6 + C20:3ω6 + C20:3ω3 + C20:5ω3 + C22:6ω-3)/(C12:0 + C14:0 + C15:0 + C16:0 + C17:0 + C18:0 + C20:0); gRatio ω-6/ω-3 (Σω-6/Σω-3); hIndex of C16 desaturase activity=100 [(C16:1 cis-9)/(C16:1 cis-9+C16:0)]; iIndex of C18 desaturase activity=100 [(C18:1 cis-9)/(C18:1 cis-9+C18:0)]; jIndex of C16 to C18 elongase activity=100 [(C18:0+C18:1 cis-9)/(C16:0+C16:1cis-9+C18:0+C18:1 cis-9)]; lIndex of C16 to C14 thioesterase activity=100 [(C16:0)/(C16:0+C14:0)].
In the metabolism of polyunsaturated fatty acids ω-6 and ω-3 PUFA, the desaturation and elongation reactions are mediated through enzymes desaturase and elongase (Δ4, Δ5, Δ6), resulting in the synthesis of highly unsaturated fatty acids, which afterwards are esterified into phospholipids and will go to constitute the cell membranes, contributing to its fluidity, in
amount of the fatty acids linoleic (C18:2ω6c) and arachidonic (C20:4ω6) (Table 2.3). These results suggest that in the gilts there is possibly a poorer activity of Δ6 desaturase and consequent greater activity of Δ5 desaturase, where as in the Barrows that behavior would be inverse, since smaller amounts of linoleic acid and greater of 11,14,17-Eicosatrienóico (C20:3ω3) were found in these animals.
The sows’ meat presented higher proportions of polyunsaturated fatty acids in relation to the saturated ones (PUFA/SFA) for both the cuts (Table 2.3) according to the glycerin level of 150g/kg in the diets in the loin for the total of polyunsaturated fatty acids, the series ω6, arachidonic acid with an average superior proportion of 1.79 as high as this component in relation to the amount found in the barrows. This
behavior can be related to increased activity of the enzymes desaturase (Δ6) and elongase in gilts, since the increase of the glycerol levels would promote greater synthesis of triglycerides, these being utilized for the production of polyunsaturated fatty acids in this category, while for the barrows there would be greater formation of SFA (Nuernberg et al. (2005).
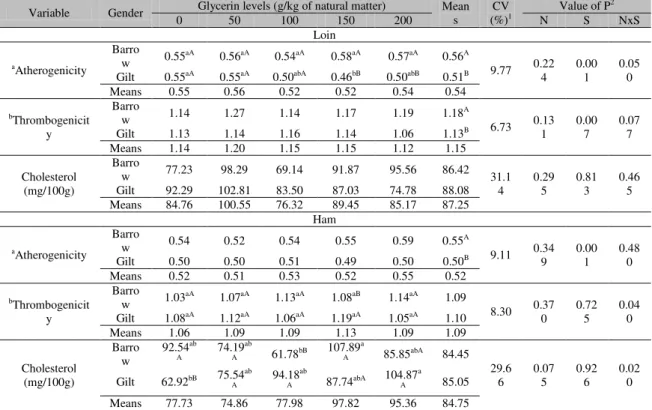
No effect of the use of crude glycerin and sexual category upon the values of cholesterol in the loin of 87.25mg/100g was found (Table 4), while for the ham, there was interaction between these two factors, presenting an average value of 84.75mg/100g. Those results are superior to the ones reported for pork in both the cuts (42mg/100g for loin and 49mg/100g for the ham) by Bragagnolo and Rodrigues-Amaya (2002).
Table 4. Mean of the index and cholesterol according to the level of glycerin and gender in the muscle Longissimus dorsi (loin) and Semimembranosus (ham)
Variable Gender Glycerin levels (g/kg of natural matter) Means (%)CV 1 Value of P 2
0 50 100 150 200 N S NxS
Loin
aAtherogenicity Barro
w 0.55
aA 0.56aA 0.54aA 0.58aA 0.57aA 0.56A
9.77 0.224 0.001 0.050 Gilt 0.55aA 0.55aA 0.50abA 0.46bB 0.50abB 0.51B
Means 0.55 0.56 0.52 0.52 0.54 0.54
bThrombogenicit
y
Barro
w 1.14 1.27 1.14 1.17 1.19 1.18A 6.73 0.13
1 0.007 0.077
Gilt 1.13 1.14 1.16 1.14 1.06 1.13B
Means 1.14 1.20 1.15 1.15 1.12 1.15
Cholesterol (mg/100g)
Barro
w 77.23 98.29 69.14 91.87 95.56 86.42 31.1
4 0.29
5 0.81
3 0.46
5
Gilt 92.29 102.81 83.50 87.03 74.78 88.08
Means 84.76 100.55 76.32 89.45 85.17 87.25 Ham
aAtherogenicity Barro
w 0.54 0.52 0.54 0.55 0.59 0.55A 9.11 0.34
9 0.001 0.480
Gilt 0.50 0.50 0.51 0.49 0.50 0.50B
Means 0.52 0.51 0.53 0.52 0.55 0.52
bThrombogenicit
y
Barro
w 1.03aA 1.07aA 1.13aA 1.08aB 1.14aA 1.09 8.30 0.37 0
0.72 5
0.04 0 Gilt 1.08aA 1.12aA 1.06aA 1.19aA 1.05aA 1.10
Means 1.06 1.09 1.09 1.13 1.09 1.09
Cholesterol (mg/100g)
Barro w
92.54ab
A 74.19
ab
A 61.78bB 107.89 a
A 85.85abA 84.45 29.6
6 0.07
5 0.92
6 0.02
0 Gilt 62.92bB 75.54ab
A 94.18
ab
A 87.74abA 104.87 a
A 85.05
Means 77.73 74.86 77.98 97.82 95.36 84.75
Means followed by different letters (ab) in the line indicate a difference between glycerin level; (AB) columns indicate differences
between sex by SNK test (α = 0,05).1Coefficient of variation; 2N, S, N x S: effect of the supplementation with glycerin level, sex
and its interaction, respectively. aIndex of atherogenicity = [4(C14:0) + C16:0]/(Sum SFA + Sum PUFA); bIndex of thrombogenicity
= (C14:0 + C16:0 +C18:0) / [(0.5xΣMUFA) + (0.5xΣω6) + (3xΣω-3) + (Σω-3/ω-6)].
In the ham there was an interaction between the levels of glycerin and gender for the amount of cholesterol in the meat (Table 4). For the gilts, there was an effect and the amount of cholesterol
This increase in the amount of cholesterol in the meat of the gilts according to the dietary glycerin level may be related to the increased need of synthesis of progesterone and/or estradiol, since from cholesterol sex hormones are synthesized. The process of biosynthesis of cholesterol and triacylglycerols is similar and depends on a source of glicerol-3-phosphate (glicerol-3-P), which is obtained through the action of the enzyme glycerol kinase upon glycerol, with further production of pyruvate, where this is utilized to produce acetyl-coA, which is the precursor for the cholesterol synthesis (Boyle, 2005). As in the barrows, there is no production of steroid hormones, possibly the different amounts of glycerol fed in the diet determine that range since acetyl-coA can be utilized for synthesis of other compounds as lipids, ketone bodies and energy production via the Krebs cycle.
Considering the nutrient allowances of the World Health Organization (World Health Organization, 2003) stating that the PUFA/SFA ratio should be higher than 0.4; it is found in this work that in both the cuts, the gilts presented better results (Table 4) and that only in the loin of barrows no values above that index were found. For human diets, a consumption proportion of 4:1 in relation to the fatty acids ω6/ω3 is desirable. Nevertheless, in the meat of the animals in this study the results showed average values of ω6/ω3 ratio of 34.69 in the loin and of 39.89 in the ham, which stands for 9 to 10 times the recommended, which constitutes a risk factor for the development of certain types of cancer and heart diseases if considering only its consumption (World Health Organization, 2003).
According to Wood et al. (2003), this is one of the undesirable aspects of pork, brought about by the high amount of linoleic acid present in the ingredients of the feeds which are given in the raising system, which has led many workers to seek alternatives such as the supplementation in swine feeding with soil sources rich in w3 (Nuernberg et al., 2005; Tikk et al., 2007), conjugated with linoleic acid (Martin et al., 2008) and monounsaturated fatty acids (Mas et al., 2010, Realini et al., 2010) .
The determination of the indices of atherogenicity and thrombogenicity in the loin
showed the poorest indices for the meat of barrows; while in the ham there was a difference for the index of atherogenicity with best results for the gilts (Table 4). These indices are related to the amounts of saturated, polyunsaturated fatty acids and those of the series ω6, being a health indicator associated with the risk of cardiovascular disease according to the lipid composition of the food (Turan et al., 2007). In that way, the lower the indices of atherogenicity and thrombogenicity of a given products are, the better its consumption will be for one’s health.
The indices of atherogenicity and thrombogenicity found in this work are similar to the results reported by Tonial et al. (2010) for salmon (0.56 and 0.23) and lower than the ones cited by Arruda et al. (2012) for lambs (0.64 and 1.37), demonstrating in that way characteristics intermediary to the meat of the two species.
In general, regardless of the gender and cut, the meat of the pigs fed crude glycerin offered characteristics favorable to its consumption, since gilts presented higher values of polyunsatured fatty acids and barrows presented higher values of monounsaturated fatty acids, mainly oleic acid which aids in the reduction of serum cholesterol, possesses anti-thrombogenic effect and inhibits the platelet aggregation.
CONCLUSION
The use of glycerin in swine feeding promoted modification in relation to the lipid profile, promoting modifications in the deposition of fatty acids, with higher amounts of glycerin in swine feeding promoting modifications regarding the lipid profile, promoting modifications in the fatty acid deposition with greater amounts of saturated and monounsaturated acids in the barrows meat and polyunsaturated acids and cholesterol in the sows.
ACKNOWLEDGMENTS
REFERENCES
ALONSO, V.; MAR CAMPO, M.; ESPAÑOL, S. et al. Effect of crossbreeding and gender on meat quality and fatty acid composition in pork. Meat Sci., v.81, p.209-217, 2009.
ARRUDA, P.C.L.; PEREIRA, E.S.;
PIMENTEL, P.G. et al. Perfil de ácidos graxos no Longissimus dorsi de cordeiros Santa Inês alimentados com diferentes níveis energéticos. Semina ciênc. agrar., v.33, p.1229-1240, 2012.
BOHAC, C.E.; RHEE, K.S.; CROSS, H.R. et al. Assessment of methodologies for colorimetric cholesterol assay of meats. J. Food Sci., v.53, p.1642–1645, 1988.
BOYLE, J. Lehninger principles of biochemistry. 4. ed. NELSON, D.; COX, M.; Biochemistry and Molecular Biology Education, v.33, 2005. 1119p.
BRAGAGNOLO, N.; RODRIGUEZ-AMAYA, D.B. Determinação de colesterol em carne: comparação de um método colorimétrico e um método por cromatografia líquida de alta eficiência. Rev. Inst. Adolfo Lutz, v.22, p.1-13, 2002.
CERRATE, S.; YAN, F.; WANG, Z. et al. Evaluation of glycerine from biodiesel production as a feed ingredient for broilers. Int. J. Poult. Sci., v.5, p.1001–1007, 2006.
CLAPPER, J.A.; CLARK, T.M.; REMPEL, L.A. Serum concentrations of IGF-I, estradiol-17b, testosterone, and relative amounts of IGF binding proteins (IGFBP) in growing boars, barrows, and gilts. J. Anim. Sci., v.78, p.2581- 2588, 2000.
FOLCH, J.; LEES, M.; STANLEY, S.A. A simple method for isolation and purification of total lipids from animal tissues. J. Biol. Chem., v.226, p.479-503, 1957.
HARTMAN, L.; LAGO, R.C.A. Rapid preparation to fatty acids methyl esters. Lab. Practice, v.22, p.475-476, 1973.
HAYASHI, A.; MEDEIROS, S.R.;
CARVALHO, M.H. et al. Conjugated linoleic acid (CLA) effects on pups growth, milk composition and lipogenic enzymes in lactating rats. J. Dairy Sci., v.74, p.160-166, 2007.
KAZALA, E.C.; LOZEMAN, F.J.; MIR, P.S. et al. Relationship of fatty acid composition to intramuscular fat content in beef from crossbred wagyu cattle. J. Anim. Sci., v.77, p.1717-1725, 1999.
MALAU-ADULI, A.E.O.; SIEBERT, B.D.; BOTTEMA, C.D.K. et al. A comparison of the fatty acid composition of triacylglycerols in adipose tissue from Limousin and Jersey cattle. Aust. J. Agric. Res., v.48, p.715-722, 1997.
MARTIN, D.; ANTEQUERA, T.; MURIEL, E. et al. Effect of dietary conjugated linoleic acid in combination with monounsaturated fatty acids on the meat composition and quality traits of dry-cured loin. Meat Sci., v.80, p.1309-1319, 2008. MAS, G.; LLAVALL, M.; COLL, D. et al. Carcass and meat quality characteristics and fatty acid composition of tissues from Pietrain-crossed barrows and gilts fed an elevated monounsaturated fat diet. Meat Sci., v.85, p.707-714, 2010.
METZ, P.A.M.; MENEZES, L.F.G.; SANTOS, A.P. et al. Perfil de ácidos graxos na carne de novilhos de diferentes idades e grupos genéticos terminados em confinamento. Rev. Bras. Zoot., v.38, p.523-531, 2009.
MITCHAOTHAI, J.; YUANGKLANG, C.; WITTAYAKUN, S. et al. Effect of dietary fat type on meat quality and fatty acid composition of various tissues in growing- finishing swine. Meat Sci., v.76, p.95-101, 2007.
NAKAMURA, M.T.; NARA, T.Y. Structure, function, and dietary regulation of delta 6, delta 5, and delta 9 desaturases. Annu. Rev. Nutr., v.24, p.345–376, 2004.
NUERNBERG, K.; FISCHER, K.;
NUERNBERG, G. et al. Effects of dietary olive and linseed oil on lipid composition, meat quality, sensory characteristics and muscle structure in pigs. Meat Sci., v.70, p.63-74, 2005. PALMQUIST, D.L. Omega-3, fatty acids in metabolism, health, and nutrition and for modified animal product foods. Prof. Anim. Scient., v.25, p.207-249, 2009.
REALINI, C.E.; DURAN-MONTGÉ, P.; LIZARDO, R. et al. Effect of source of dietary fat on pig performance, carcass characteristics and carcass fat content, distribution and fatty acid composition. Meat Sci., v.85, p.606-612, 2010.
TEYE, G.A.; SHEARD, P.R.; WHITTINGTON, F.M. et al. Influence of dietary oils and protein level on pork quality. 1. Effects on muscle fatty acid composition, carcass, meat and eating quality. Meat Sci., v.73, p.157-165, 2006. TIKK, K.; TIKK, M.; AASLYNG, M.D. et al. Significance of fat supplemented diets on pork quality –Connections between specific fatty acids and sensory attributes of pork. Meat Sci., v.77, p.276-286, 2007.
TONIAL, I.B.; OLIVEIRA, D.F.; BRAVO, C.E.C. et al. Caracterização físico-quimica e perfil lipídico do salmão (Salmo Salar L.). Alim. e Nutr., v.21, p.93-98, 2010.
TURAN, H.; SÖNMEZ, G.; KAYA, Y. Fatty acid profile and proximate composition of the thornback ray (Raja clavata, L. 1758) from the Sinop coast in the Black Sea. J. Fish Sci., v.1, p.97-103, 2007.
ULBRICHT, T.L.V.; SOUTHGATE, D.A.T. Coronary heart disease:seven dietary factors. Lancet, v.338, p.985-992, 1991.
WOOD, J.D.; RICHARDSON, R.I.; NUTE, G.R. Effects of fatty acids on meat quality: A review. Meat Sci., v.66, p.21-32, 2003.
WORLD HEALTH ORGANIZATION. Diet, nutrition and the prevention of chronic diseases WHO Technical Report Series, Geneva, n. 916, 2003.