Vol.51, n. 1 : pp.143-152, January-February 2008
ISSN 1516-8913 Printed in Brazil
BRAZILIAN ARCHIVES OF
BIOLOGY AND TECHNOLOGY
A N I N T E R N A T I O N A L J O U R N A L
Extraction of Red Cabbage Anthocyanins: Optimization of
the Operation Conditions of the Column Process
Marcelo Fonseca Xavier, Toni Jefferson Lopes, Mara Gabriela Novy Quadri* and
Marintho Bastos Quadri
Departamento de Engenharia Química e de Engenharia de Alimentos; Universidade Federal de Santa Catarina; Campus Universitário Trindade; C. P.: 476; 88040-900; mara@enq.ufsc.br; Florianópolis - SC - Brasil
ABSTRACT
The aim of this work was to extract anthocyanins from the red cabbage. Batch studies under several extraction conditions indicated that acetic acid in aqueous solution (10% V/V) was the best solvent, used in the proportion of 0.25 g of red cabbage mL-1. At this condition, column assays were carried out to evaluate the influence of the ionic force, pH, solvent flow rate, recirculated volume of red cabbage juice and the mass of red cabbage. Results showed that the pH, recirculation and mass of red cabbage had statistically significant effects, where the optimum operation conditions found for the process were pH 2.3, recirculation volume of the solvent 0.83 L and mass of red cabbage 50 g.
Key words: Anthocyanins; extraction; red cabbage; experimental design; optimization
* Author for correspondence
INTRODUCTION
Frequently, food pigments undergo serious degradation during processing, and restoration of the lost color is a way to keep the freshness aspect of foods. The increasing worry with food safety is stimulating the substitution of several synthetic
dyes with natural pigments (Bridle and
Timberlake, 1997).
Anthocyanins are polar molecules with hydroxyl, carboxyl, methoxyl and glycolyl groups bound to aromatic rings. They are more soluble in water than in non polar solvents and this characteristic helps extraction and separation processes, as described by Harbone and Grayer (1988). Hydrochloric acid diluted in methanol is generally used to extract anthocyanins. Since methanol has toxic characteristics, food scientists prefer other extraction systems. A water:ethanol mixture of
80:27 (v/v) is commonly used as a solvent in the food industry, and it is as good as methanol (Lapornik et al., 2005). In aqueous extractions, the most used and efficient acids are acetic, citric, tartaric and hydrochloric. Studies on anthocyanin extraction using these solvents are found in literature (Harbone and Grayer, 1988; Francis, 1989; Bridle and Timberlake, 1997; Montes et al., 2005). Although, most of the literature concerns to the identification of anthocyanins in several vegetable sources (Eichhorn and Winterhalter, 2005; Macz-Pop et al., 2006; Baleiras Couto and Eiras-Dias, 2006), studies are carried out to develop the process and establish good operational conditions (Lopes et al., 2005; Montes et al, 2005; Türker and Erdogdu, 2005).
macerated in contact with the solvent. At the end of the process, the liquid is filtered and purified in order to obtain the extract. In batch procedures, agitation improves the mass transfer and the time needed to achieve a dye concentration that provides an economical viable process (Cacace and Mazza, 2003). The column process is a dynamic batch process where the solid phase (raw material) is stationary in a fixed porous bed, and the liquid phase (solvent) moves through the bed by forced convection. In column extraction, the solvent can be recirculated at different flow rates or operated in one single step. In both the situations, a concentration gradient is established throughout the column due to the contact of the solvent with the raw material. Extraction occurs until the dye concentration in the solvent reaches equilibrium with the raw material. Column extraction in one single step is completed when all colorant is removed from the raw material.
The objective of this work was to investigate the variables influencing the column extraction of red cabbage anthocyanins aiming to determine the optimum operation conditions.
MATERIAL AND METHODS
Static tests
Red cabbage, a widely cultivated vegetable in all the regions of Santa Catarina, south of Brazil, was obtained from the local market. Batch assays were carried out macerating chopped red cabbage in 100 ml of different solvents in a shaker for 24h, followed by the filtration. The filtrate was centrifuged at 5000 rpm for 15 min. The variables chosen to be evaluated in static test were: pH, solvent type and concentration, and the ratio mass cabbage/volume of solvent CM/SV. To evaluate the effect of pH on the bathochromic and hyperchromic behavior of the anthocyanins, 12 values of pH, from 2.4 to 4.2, were tested with a spectrophotometer. The wavelength and the absorbance intensity at the maximum peak of absorption were analyzed in order to obtain a stable absorbance range. The solvents tested in the
extraction process were: McIlvaine buffer
solutions (pH 3, 4 and 5), ethanol-water mixtures (30, 40 and 70% V/V) and acetic acid dilutions (5, 10 and 20% V/V). The influence of red cabbage mass CM was studied varying the CM/SV ratio from 0.05 to 0.50 g mL-1, using 20% acetic acid for the extraction.
Once defined the best proportion of solid and liquid in the static assays considering maximum extraction at a minimal cost, the concentration of acetic acid was evaluated. The concentrations tested were 10, 25, 40, 55, 70, 85 and 100% by volume. Experiments were carried out in triplicate and the dye concentration was expressed as the equivalent concentration of Congo red (mg L-1), as proposed by Sondheimer and Kertesz (1948).
Dynamic tests
Column tests were performed with or without recirculation of the solvent. The column extraction system with no solvent recirculation was comprised of a 20 L tank where a submerged pump pushed the solvent through a cylindrical glass column in an ascendant flow. A good flow distribution at the entrance of the column of 3 cm internal diameter × 30 cm height was guaranteed by a perforated glass plate and a layer of 2 cm height made of glass beads of 4 mm diameter, as shown in Figure 1. The porous bed of 25 cm height was formed of chopped red cabbage particles with the same dimensions used for the static essays, mixed with the glass beads at a mass ratio of 1:1 g g-1.
The column ontained 70 g maximum quantity of
(7.2±2.2×10.4±2.5×3.2±1.9) cm3 red cabbage
particles with bed’s porosity of 0.3190±0.0084. At the top of the column, a 2 cm layer of glass beads was also added to minimize dragging of the cabbage particles. A flow control device was placed after the column and 5 mL samples of the eluted solutions were collected over 48 hours to determine the dye concentration. Exhaustion assays with no recirculation of red cabbage anthocyanin with a pre-determined solvent were carried out at different flow rates: 0.3, 1.0 and 4.0 L h-1. Only the first flow rate showed to be economically viable due to the very high consumption of acetic acid at the two other conditions. In the extraction system using recirculation, a reservoir of 2 L was used instead of the 20 L tank, as in the previous arrangement. Samples of 1 mL were taken directly from the reservoir for the analysis. A factorial experimental design 25V−1was performed to investigate the
controlled using acetic acid or sodium hydroxide (10%).
RESULTS AND DISCUSSION
Static tests
Average results for each studied factor were analyzed and compared using the Duncan test at a significance level of 5%. It was observed that the
increase in pH was followed by a λmáx
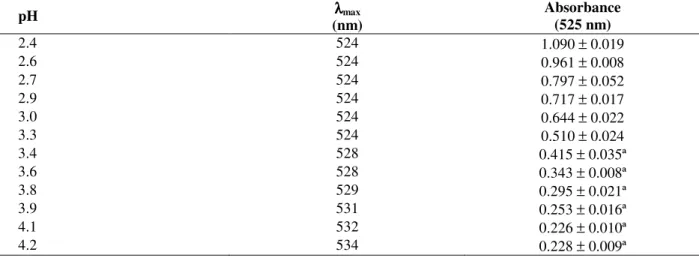
displacement in the visible range from pH 3.4 onwards as shown in Table 3. The intensity of the peak diminished, as observed by the reduction in the absorbance.
According to Brouillard (1983), the largest coloring changes of the anthocyanins occur near to the pK values where the concentration of the
flavilium cation and the quinoidal base are equal. The flavilium cation is red, while the quinoidal base is blue, and the pH variations modify the equilibrium of the proton transfer between these two chromophores. At pH 2.4, the quantity of the flavilium cation present was much more important than the quinoidal base, but the quantity decreased as pH increased, as seen by a reduction in the absorbance from 1.090 to 0.228 (Table 3). The results of the Duncan test were obtained with the aid of Statistica® Software. They are shown in Table 3 by the superscript letters, where same letter means no significant difference between mean values at a p-level<0.05. No bathochromic shift was observed from pH 2.4 to 3.3.
Figure 1 - Schematic view of the column extraction system.
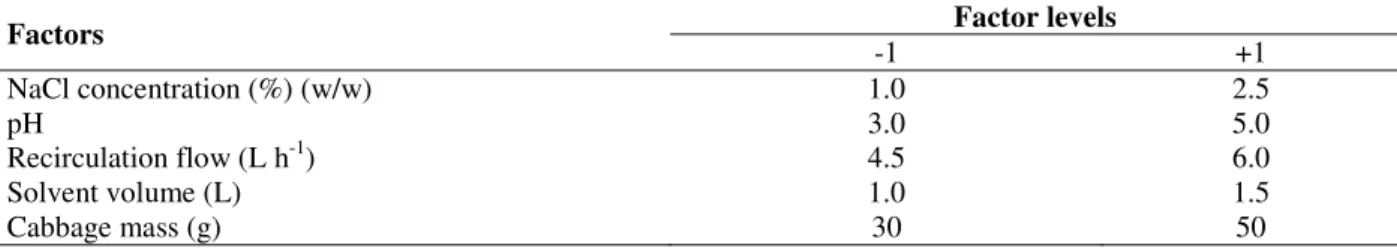
Table 1 – Levels of coded factors for the factorial experimental design to the extraction in a column with recirculation.
Factor levels Factors
-1 +1
NaCl concentration (%) (w/w) 1.0 2.5
pH 3.0 5.0
Recirculation flow (L h-1) 4.5 6.0
Solvent volume (L) 1.0 1.5
Cabbage mass (g) 30 50
Inlet Outlet
Glass beads
Chopped red cabbage
Glass perfored plate 2 cm
25cm
Table 2 – Levels of coded factors used in complete second-order factorial experimental design to evaluate the response anthocyanin concentration in dynamic tests with recirculation.
Factors Level
pH SV (L) CM (g)
-1.68 2.3 0.83 23.2
-1 3.0 1.00 30.0
0 4.0 1.25 40.0
1 5.0 1.50 50.0
+1.68 5.7 1.67 56.8
Table 3 - Variation of the wavelength and intensity of absorbance in the peak as a function of pH in static tests.
pH λλλλmax
(nm)
Absorbance (525 nm)
2.4 524 1.090 ± 0.019
2.6 524 0.961 ± 0.008
2.7 524 0.797 ± 0.052
2.9 524 0.717 ± 0.017
3.0 524 0.644 ± 0.022
3.3 524 0.510 ± 0.024
3.4 528 0.415 ± 0.035ª
3.6 528 0.343 ± 0.008ª
3.8 529 0.295 ± 0.021ª
3.9 531 0.253 ± 0.016ª
4.1 532 0.226 ± 0.010ª
4.2 534 0.228 ± 0.009ª
Mean values showing the same letter are no statistically different in a p-level of 5%.
The above two factors must be associated to give results within a steady range of readings, aiming to produce no bathochromic effect, and obtain, at the same time, hyperchromic results that fit the Beer law. A convenient value was observed at pH 3.0 because it could be easily attained, even using weak acids such as citric acid. At this value, which was also recommended by Sondheimer and Kertesz (1948) and Lopes (2002), a high absorbance was obtained. Cabrita et al. (2000) repeated a similar behavior for a buffered aqueous solution of
cyanidin-3-glucoside. A gradual bathochromic shift (from 510 to 523 nm) was found when pH varied from 1.0 to 5.0 and absorbance decreased from 2.06 to 0.17 in the same pH range.
The extraction capacities of the several solvents studied are shown in Table 4. It could be seen that acetic acid gave the highest dye concentration at all the dilutions studied (p-level <0.05). Since it was the most effective solvent, it was chosen to be used in further tests.
Table 4 - Dye concentration extracted by different solvents in static tests.
Solvent Dye concentration (mg L-1)
BS3(Buffer solution pH 3.0) 225.5 ± 13.29a
BS4(Buffer solution pH 4.0) 207.1 ± 6.07a,c
BS5(Buffer solution pH 5.0) 256.3 ± 22.1b
EW30(Ethanol 30% V/V) 202.5 ± 10.82a,c
EW40(Ethanol 40% V/V) 205.5 ± 16.94a,c
EW70(Ethanol 70% V/V) 198.1 ± 10.43c
AA5(Acetic acid 5% V/V) 258.1 ± 2.01b
AA10(Acetic acid 10% V/V) 276.8 ± 16.41b
AA20(Acetic acid 20% V/V) 302.4 ± 8.94d
Vegetable tissue is comprised of cells joined by middle lamellae, compounds of which are associated with celluloses, hemicelluloses, lignins and pectic substances. Treatments with acid solutions break the hydrogen bonds between these compounds, destroying the selective permeability of the red cabbage cell, and the solutes easily leave the cell. As acetic concentration increases, sugar hydrolysis also rises, and more anthocyanin is extracted. It appeared that the acetic acid was more toxic to the cell than the McIlvaine buffer since the 5.0 % acetic acid solution had a similar pH to the buffer solution pH 3.0. Cacace and Mazza (2003) found an increase in the diffusion coefficients of anthocyanins in ethanol from a concentration of 39 to 67% (V/V). At higher concentrations of 67 to 95%, the diffusion coefficient decreased probably due to a lower solubility of the anthocyanin in alcohol than in water. These results explained the lower extraction rate found in this study, at high ethanol concentrations (Table 4).
The results of Duncan test for the solvents are also given in Table 4, at superscript letters, where the comparison for the different solvents and the resulting extracted colorant concentration are shown. Acetic acid at a concentration of 20% was the best solvent to extract anthocyanin from red cabbage. It gave a significant difference from all other solvents. Between 5 and 10%, there was no significant difference, but results were closer to those of 20% concentration than the others. The buffer solution at pH 5 gave a similar result to that of acetic acid (5 and 10%), which was also higher than that given by pH 3 and pH 4 buffer solutions. The best pH for the extraction considering the mass extracted has not been well established in the literature, but extraction at low pH values has always been recommended.
Using ethanol-water mixtures, the most common applied solutions for extraction, there was no significant difference between the concentrations used. Good savings, therefore, could be obtained if 30% (V/V) alcoholic solution in aqueous media was used to extract the anthocyanins. The extraction capacity was similar to the buffer solutions at pH 4. Cacace and Mazza (2003) obtained a maximum anthocyanin extraction using ethanol-water mixture (6:4, V/V). Higher ethanol
concentrations extracted less anthocyanin,
regardless of the solvent/solid ratio used because the diffusivity of the anthocyanin in a vegetable matrix was affected by both the concentration and
the type of the solvent. There was no associated effect with the solvent/solid ratio, which indicated that diffusivity was not affected by the solute concentration.
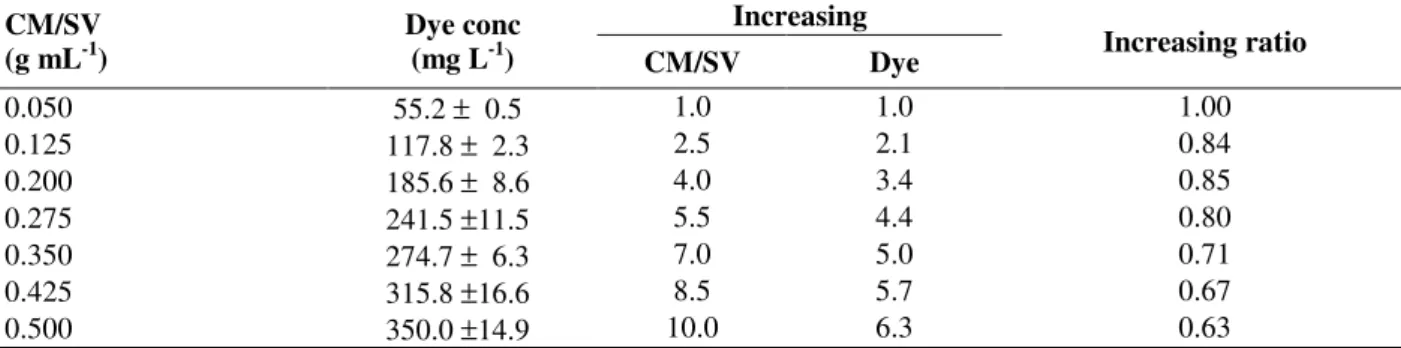
Results relating CM/SV ratio to dye concentration are shown in Table 5. Since an increase in the cabbage mass occured in the mixture used for the extraction, the anthocyanins content in the extract also increased, but it had no linear response. By increasing the CM/SV ratio from 0.05 to 0.5, the concentration of dye increased by a factor of 6.3, that is, from 55.2 to 350 mg L-1. The best combination was found in the range of 0.05 and 0.275 g mL-1. In this interval, dye concentration decreased from 1 to 0.8. A convenient choice was CM/SV=0.25, for which it was possible to assume, by linear interpolation, a dye concentration about 220 mg L-1. The Duncan test applied to the mass of cabbage/volume of solvent ratio (CM/SV) showed that all concentration differences remained significants as the CM/SV ratio increased (p-value < 0.05).
The concentration gradient is the driving force for the dye extraction, which is greater when the solvent:solid ratio (SV/CM) is higher, giving a higher diffusion rate. Changes in the solvent:solid ratio alter the final equilibrium between the dye concentrations in the solid and liquid phases. The performance of the process is also affected by the extraction conditions, the solubility modifications and the solute:solvent interactions (Cacace and Mazza, 2003). As a consequence, the principal effect of the solvent:solid ratio is to modify the equilibrium constant, and thus to improve the
anthocyanin extraction when a greater
solvent:solid ratio is used (Table 5).
Dynamic tests
Tests without a recirculation system
The mass of colorant was exhausted from the red cabbage using tests without recirculation of the solvent, and 1.7 mg of anthocyanin g-1 was obtained. Figure 2 shows the mass evolution of dye extracted from red cabbage and the colorant concentration at the outlet of the column operating at 0.3 L h-1.
The dye mass curve showed that it took at least 15 h to extract 90% (1.53 mg g-1) of the red cabbage
dye. Complete extraction needed more than 33 h of the processing.
Tests with a recirculation system
In order to study the effect of the five variables chosen, salt concentration SC (NaCl) [g L-1], pH, flow rate, FR [L h-1], solvent volume, SV [L], and mass of red cabbage, CM [g], a 2V5−1 factorial
experimental design was carried out, and the anthocyanin concentration (Conc.) [mg L-1] in the supernatant (mg L-1) was measured after 6 h of the extraction (Table 7).
Table 5 - Anthocyanins concentration extracted, relative increasing and increasing ratio as a function of CM/SV
Increasing CM/SV
(g mL-1)
Dye conc
(mg L-1) CM/SV Dye Increasing ratio
0.050 55.2 ± 0.5 1.0 1.0 1.00
0.125 117.8 ± 2.3 2.5 2.1 0.84
0.200 185.6 ± 8.6 4.0 3.4 0.85
0.275 241.5 ±11.5 5.5 4.4 0.80
0.350 274.7 ± 6.3 7.0 5.0 0.71
0.425 315.8 ±16.6 8.5 5.7 0.67
0.500 350.0 ±14.9 10.0 6.3 0.63
Table 6 – Concentration and dye concentration increasing as function of acetic acid (A.A.) concentration (%).
A. A. conc. A.A. increase Dye conc. (mg L-1) Dye increase
10 1.0 192.0 ± 12.18a 1.00
25 2.5 207.7 ± 17.40a,b 1.08
40 4.0 218.8 ± 11.89b 1.14
55 5.5 238.4 ± 10.97c 1.24
70 7.0 261.5 ± 1.06d 1.36
85 8.5 291.3 ± 4.46e 1.52
100 10.0 298.5 ± 4.33e 1.55
Mean values showing the same superscript letter are no statistically different at a p-level of 5%.
0 10 20 30 40 50 0
2 4 6 8 10 12 14 16 18 20
0 2 4 6 8 10 12 14 16 18 20
Time (h)
D
y
e
co
n
ce
n
tr
at
io
n
(
m
g
L
-1 )
D
y
e
ex
tr
ac
te
d
(m
g
g
-1
)
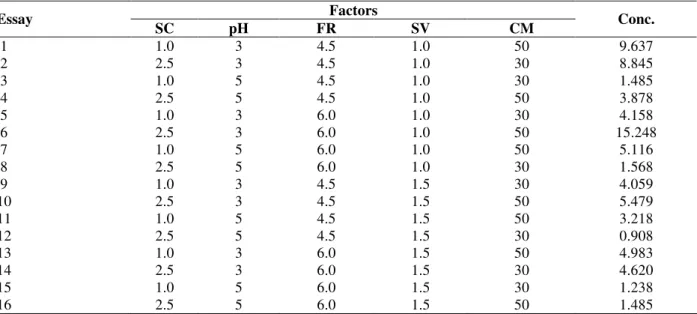
The effects of each variable are shown in Table 8 for a significance level of 5%. The analysis of the effects indicated that the pH, the volume of solvent and the mass of red cabbage were significant (boldface) since the p-level was lower than 0.05. Table 8 also shows the t-test and the confidence limits.
From these results, a central composite design was proposed in order to optimize the anthocyanin extraction in the column with a recirculation system. Sixteen tests (Table 9) were run at 6 L h-1 recirculation flow rate to obtain a response surface.
The values found for the effects showed that: a) pH and SV had negative effects on the concentration of the extracted dye, b) CM had a positive one, and c) SC and FR were inert variables. The negative effects showed that as the pH increased lower dye mass was extracted, and as the solvent volume indreased from 1.0 to 1.5 L, the dye extracted was diluted. On the other hand, an increase of the mass of red cabbage from 30 to 50 g gave a significant increase in the dye concentration because there was more dye source available for extraction. FR was set on 6.0 L h-1 because higher flow rates quickly attained the uniform concentration profile and the equilibrium. Sodium chloride (SC) was not used hereafter.
Considering the significant terms only, the fitted reduced model (Equation 1) had a determination coefficient R2 of 0.9650.
2 0.598CM 0.941CM
1.176SV 2.096pH
6.652 Conc
− +
+ −
− =
(1)
The Analysis of Variance (ANOVA) of the proposed model in the Equation 1 is shown in Table 10 at p<0.25. The residual square sum, SSr, was smaller compared to that of the regression, SSR, indicating that the model was suitable, which explained 99.42% of the total variation.
Statistical analysis using the F distribution showed that the regression was statistically significant since the F value found for F=MSRegression/MSresidues
was around 23 times higher than the F-value found in the statistical tables, for a significance level of 5%. Residual values were not significant, and the model could be used for prediction (Montgomery, 2001) of dye concentration extraction in similar situations. The pure error was negligible, which implied in a maximum explainable variation near to 100%.
Table 7 – Factorial Experimental design 51
2V− to evaluate the anthocyanin concentration in dynamic tests with recirculation.
Factors Essay
SC pH FR SV CM Conc.
1 1.0 3 4.5 1.0 50 9.637
2 2.5 3 4.5 1.0 30 8.845
3 1.0 5 4.5 1.0 30 1.485
4 2.5 5 4.5 1.0 50 3.878
5 1.0 3 6.0 1.0 30 4.158
6 2.5 3 6.0 1.0 50 15.248
7 1.0 5 6.0 1.0 50 5.116
8 2.5 5 6.0 1.0 30 1.568
9 1.0 3 4.5 1.5 30 4.059
10 2.5 3 4.5 1.5 50 5.479
11 1.0 5 4.5 1.5 50 3.218
12 2.5 5 4.5 1.5 30 0.908
13 1.0 3 6.0 1.5 50 4.983
14 2.5 3 6.0 1.5 30 4.620
15 1.0 5 6.0 1.5 30 1.238
Table 8 – Effects of the operation variables in dynamic tests with recirculation system.
Factor Effect t(10) p LL UL
Mean 4.745 8.885 0.000 3.469 6.021
SC 1.017 0.952 0.385 -1.535 3.569
pH -4.767 -4.462 0.007 -7.318 -2.215
FR 0.113 0.106 0.919 -2.438 2.665
SV -2.993 -2.802 0.038 -5.545 -0.441
CM 2.770 2.597 0.049 0.219 5.322
where LL and UL are the lower and upper confidence limits, respectively.
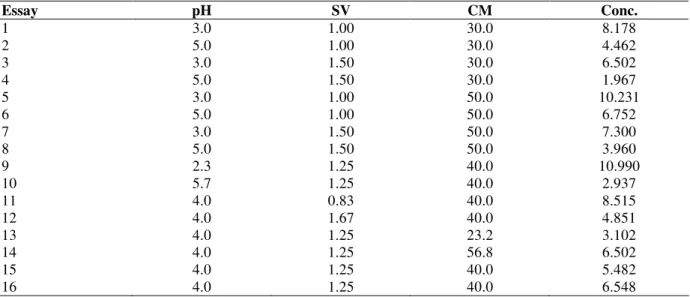
Table 9 – Complete factorial experimental design to evaluate the anthocyanin concentration in dynamic tests with recirculation.
Essay pH SV CM Conc.
1 3.0 1.00 30.0 8.178
2 5.0 1.00 30.0 4.462
3 3.0 1.50 30.0 6.502
4 5.0 1.50 30.0 1.967
5 3.0 1.00 50.0 10.231
6 5.0 1.00 50.0 6.752
7 3.0 1.50 50.0 7.300
8 5.0 1.50 50.0 3.960
9 2.3 1.25 40.0 10.990
10 5.7 1.25 40.0 2.937
11 4.0 0.83 40.0 8.515
12 4.0 1.67 40.0 4.851
13 4.0 1.25 23.2 3.102
14 4.0 1.25 56.8 6.502
15 4.0 1.25 40.0 5.482
16 4.0 1.25 40.0 6.548
Table 10 - Analysis of variance (Anova) of anthocyanin concentration results.
Source of variation SS DF MS FCalc. FTab.
Regression 95.31 4 23.83
Residual 3.45 11 0.31 75.90 3.36
Lack of fit 2.88 10 0.29
Pure error 0.57 1 0.57 0.51 241.88
Total 98.76 15
R2=96.50; R2adjusted=99.42
SS and MS are the sum of squares and the mean square, respectively, and DF is the degrees of freedom of each variation source. FCalc. and FTab.are the values of F distribution calculated and that found in tables, respectively.
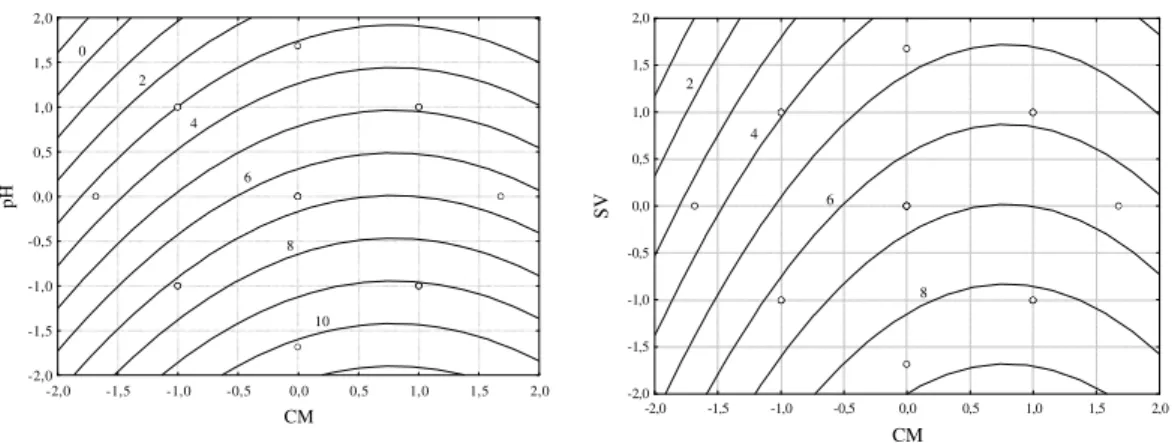
The contour graphs generated by the model are shown in Figure 3 for the pH and SV as a function of the red cabbage mass, CM. The optimal condition range was observed in the Figure 3. It varied from 40 to 50 g for CM, from 2.3 to 3.5 for pH and from 0.83 to 1.2 L for SV. In this studied range, the optimal conditions were pH 2.3, SV=0.83 L and CM=50g, where the mass of pigment extracted was 0.21 mg g-1 of red cabbage, resulting in a concentration of 12 mg L-1 of colorant in the solvent recirculation tank. At the
Figure 3 - Contour graphs for the dye concentration from dynamic tests with recirculation: a) pH × CM; b) VS × CM
CONCLUSIONS
Although anthocyanin extraction is a subject that is of concern to the scientific community, processes employing static methods are generally used. Almost no information can be found for the extraction in columns. This paper proposes that anthocyanin extraction from red cabbage in columns is a viable process, inexpensive and relatively quick, providing a final extracted dye solution of such a high concentrated that it can be commercialized immediately. Also, the solvent applied is the diluted acetic acid that is largely used as vinegar. One of the most important advantages of acetic acid is the application as a food conservant. These considerations are relevant since the extraction of natural dyes is an alternative for better use industrial residues. It can also be used in agriculture to add value to the excess production of red cabbage.
RESUMO
Desde os primórdios dos tempos as antocianinas são extraídas de vegetais, mas avanços que garantam um processo viável e rentável exigem conhecimento, quantificação e controle das condições de operação. Estudos em batelada sob várias condições de extração indicaram que ácido acético em solução aquosa (10% V/V) foi o melhor solvente, quando usado na proporção de 0,25 g de repolho roxo mL-1. Nesta condição de
operação foram feitos ensaios em coluna para avaliar a influência da força iônica, pH, taxa de escoamento do solvente, volume recirculado da solução de extração e massa de repolho roxo. Os resultados mostraram que o pH, recirculação e
massa de repolho foram estatisticamente
significativos, e as condições ótimas de operação encontradas para o processo foram pH 2,3, volume de solvente recirculado de 0,83 L e massa de repolho roxo igual a 50g.
ACKNOWLEDGEMENTS
Statsoft South America (2004) was our partner on this research.
REFERENCES
Baleiras-Couto, M.M., Eiras-Dias, J.E. (2006), Detection and identification of grape varieties in must and wineusing nuclear and chloroplast microsatellite markers. Analytica Chimica Acta, 563, 283-291. Briddle, P.; Timberlake, C. F. (1997) Anthocyanins as
natural food colour-selected aspects, Food Chem., 58, 103–109.
Brouillard, R. (1983) The in vivo expression of anthocyanin colour in plants. Phytochemistry, 22, 1311-1323.
Cabrita, L., Fossen, T., Andersen, O.M. (2000) Colour and stability of the six common anthocyanidin-3-glucosides in aqueous solutions. Food Chemistry, 68, 101-107.
-2,0 -1,5 -1,0 -0,5 0,0 0,5 1,0 1,5 2,0 CM
-2,0 -1,5 -1,0 -0,5 0,0 0,5 1,0 1,5 2,0
p
H
2
4
6
8
10 0
-2,0 -1,5 -1,0 -0,5 0,0 0,5 1,0 1,5 2,0 CM
-2,0 -1,5 -1,0 -0,5 0,0 0,5 1,0 1,5 2,0
S
V
2
4
6
Cacace, J.E., Mazza, G. (2003), Mass transfer process during extraction of phenolic compoundsfrom milled berries Journal of Food Engineering, 59, 379–389. Eichhorn, S., Winterhalter, P. (2005) Anthocyanins
from pigmented potato (Solanum tuberosum L.) varieties, Food Research International, 38, 943–948. Francis, F. J. (1989) Food colorants: anthocyanins,
Crit.Rev. Food Sci. Nutr., 28, 273–314.
Harbone, J. B., Grayer, R. J. (1988) The anthocyanins.
In-The Flavonoids. Ed. J.B .Harborne.
London:Chapman and Hall Ltd, pp. 1-20.
Lapornik, B., Prosek, M., Wondra, A.G. (2005), Comparison of extracts prepared from plant by-products using different solvents and extraction time. Journal of Food Engineering, 71 214–222
Lopes, T. J. (2002). Adsorção de antocianinas do repolho roxo em argilas. Master Thesis, Universidade Federal de Santa Catarina, Florianópolis, Brazil. Lopes, T.J., Gonçalves, O.H., Barros, R.B., Capelli,
F.C.R., Machado, R.A.F., Quadri M.G.N., Quadri, M.B. (2005), Adsorption of Natural Dyes on Clay Fixed on Polymers. Brazilian archives of Biology and Technology,48-Special, 275 – 280.
Macz-Pop, G.A., Rivas-Gonzalo, J.C., Pe´rez-Alonso, J.J., Gonza´lez-Parama´s, A.M. (2006) Natural occurrence of free anthocyanin aglycones in beans (Phaseolus vulgaris L.). Food Chemistry, 94, 448– 456.
Montes, C., Vicario, I.M., Raymundo, M., Fett, R., Heredia, F.J. (2005), Application of tristimulus colorimetry to optimize the extraction of anthocyanins from Jaboticaba (Myricia Jaboticaba Berg. Food Research International, 38, 983–988. Montgomery, D.C. (2001), Design and analysis of
experiments. John Willey & Sons, Inc. 5th Ed. NY. Sonddheimer, E.; Kertesz, Z. I. (1948), The
anthocyanin of strawberries. Journal of the American Chemical Society, 70, 3476.
Statsoft South America (2005). Available at: http://www.statsoft.com.br.
Türker, N., Erdogdu, F. (2006), Effects of pH and temperature of extraction medium on effective diffusion coefficient of anthocynanin pigments of black carrot (Daucus carota var. L.). Journal of Food Engineering, 76, 579-583.