Neir Antunes PaesI
Joseilme Fernandes GouveiaII
I Programa de Pós-Graduação em Modelos de Decisão e Saúde. Departamento de Estatística. Universidade Federal da Paraíba. João Pessoa, PB, Brasil
II Programa de Pós-graduação em Biometria e Estatística Aplicada. Universidade Federal Rural de Pernambuco. Recife, PE, Brasil Correspondence:
Neir Antunes Paes
Depto. Estatística/CCEN, UFPB Cidade Universitária
58000-000 João Pessoa, PB, Brasil E-mail: [email protected] Received: 1/12/2009 Revised: 10/22/2009 Approved: 10/26/2009
Article available in Portuguese | English from www.scielo.br/rsp
Recovery of the main causes
of death in the Northeast of
Brazil: impact on
life expectancy
ABSTRACT
OBJECTIVE: To estimate the impact on life expectancy after elimination of the main groups of causes of death in the Brazilian Northeast in 2000.
METHODS: Data on deaths recorded for the states of Northeastern Brazil in 2000 were extracted from the Mortality Information System. The coverage of death records of children under ten years of age was assessed using indirect procedures. Ledermann’s method was used to reclassify the ill-defi ned death causes, according to sex. Multiple-decrement life tables were constructed for the main groups of causes of death, whose decrement impacts were assessed through life expectancy.
RESULTS: The total elimination of the main groups of causes in the general mortality resulted in the following gains on the life expectancy of the Northeast for men and women, respectively: infectious and parasitic diseases (1.0 and 0.5 years), malignant neoplasms (1.4 and 1.5 years), circulatory diseases (4.0 and 4.0 years), respiratory diseases (1.1 and 0.8 years), and external causes (2.9 and 0.3 years).
CONCLUSIONS: The levels of death coverage were found satisfactory, as well as the reclassifi cations of ill-defi ned causes for the states. Considering the fact that the vital statistics of the Northeast have not been widely used, due to the argument that their quality limits derivation of reliable mortality indicators, their recovery in a direct way yields consistent results.
Although the distribution of causes of death infl uences life expectancy at birth, its value does not express clearly such relationship. Even though this distribution is a good health indicator, it is not suffi cient to identify more specifi c paths to improve health conditions. However, the mortality pattern of a given region – defi ned by the specifi c mortality due to certain causes – can refl ect the existing degree of quality of life and provide subsidies for a more effi cient and effective health policy as it enables to establish priority norms and goals.
Considering that death is not a repetitive event and that it cannot be attributable to a single risk factor, the various concomitant and competitive risks that act in people’s lives must be taken into account. In this sense, the introduction of the notion of competitive risks, which was the basis for the construction of Multiple Decrement Life Tables (MDLT), represents a valu-able analytical instrument in epidemiology and public health, since deaths can be prevented and antecedent causes can be treated. These tables describe separate and combined effects of mortality rates and enable to measure the impact in years on life expectancy after the theoretical elimination of causes as risk factors of death in a population.1,5,12 Thus, Chiang3 developed a
proposal for the construction of MDLT.
To construct a life table, the researcher needs to have reli-able data on deaths; in the case of MDLT, these data are the causes of death. Nevertheless, it is known that death coverage for the Northeastern States of Brazil is not complete12 and presents high percentages of ill-defi ned
causes. Therefore, these two problems must be consid-ered before any attempt to study the mortality levels and patterns of the Northeast is made, not to mention the fact that they are the greatest hindrances to the construction of mortality indicators in a direct way.
Estimates of death coverage for adults (individuals older than ten years of age) for all the Brazilian States are available,12 but the coverage for children younger
than ten years old are not well known. In turn, the percentages of ill-defi ned causes of death can be easily learned through the Mortality Information System (SIM) of the Ministry of Health.a Bearing in mind that
the number of deaths by ill-defi ned causes is not satis-factory for any Northeastern State,12 it is necessary to
calculate their magnitude and search for methodologies that redistribute them in defi ned causes to determine their impacts on mortality. There is no consensus on
INTRODUCTION
a Ministério da Saúde. Sistema de Informações de Mortalidade do Ministério da Saúde. [citado 2007 mar 03]. Disponível em: http:// w3.datasus.gov.br/datasus/index.php?area=0205&VObj=http://tabnet.datasus.gov.br/cgi/deftohtm.exe?sim/cnv/obt
b Instituto Brasileiro de Geografi a e Estatística. Censo demográfi co brasileiro de 2000. [citado 2007 mar 03]. Disponível em http://www.ibge. gov.br/home/estatistica/populacao/censo2000/defaulttab_regioes.shtm
c Ministério da Saúde. Sistema de Informações de Mortalidade. [citado 2007 mar 25]. Disponível em http://www.datasus.gov.br/cid10/ webhelp/cid10.htm
d Instituto Brasileiro de Geografi a e Estatística. [citado 2007 mar 16]. Disponível em http://www.ibge.gov.br/home/presidencia/ noticias/20122002censo.shtm
how to deal with this problem, as there are not many available methodologies. Even so, the 2000 census year is a possibility of study, as it offers greater consistency of the necessary population data for the construction of MDLT.
In this sense, the present study aimed to estimate the impact on life expectancy after elimination of the main groups of causes of death of the Northeastern States in 2000.
METHODS
This is an analytical cross-sectional ecological study. Data on deaths of residents in the Northeastern States were extracted from the Mortality Information System (SIM) of the Ministry of Health. These data are
classi-fi ed by sex and age groups for the years of 1999, 2000 and 2001. The triennium average was used in order to minimize possible data fl uctuations. The structure of the States’ population, by sex and age groups, utilized for the construction of the MDLT, was extracted from the demographic census of 2000.b Population amounts
were adjusted to the middle of the year, according to the geometric growth method. The causes of death were classifi ed according to the Tenth Revision of the International Classifi cation of Diseases (ICD-10).c
To estimate death coverage levels, the researchers used the death coverage estimate that was most reasonable to each Northeastern State, calculated by Paes.11,12 Such
estimates were based on the use of three methods that best meet the criteria and requirements for the Brazilian data: Brass’ Growth Balance Equation, Preston’s and collaborators’ method and the Coubarge & Fargues Method. However, this coverage is valid only for popu-lations older than ten years old. The death coverage of children younger than one year old (1C0) was estimated in the following way: 10,16,18
1C0 = where
Expected deaths = LBest.IMR
The Infant Mortality Rate (IMR) was extracted from the estimates of Instituto Brasileiro de Geografi a e Estatística (IBGE – Brazilian Institute of Geography and Statistics) in 2000.d The total number of liveborns
was estimated as follows:
50
15
est i i
i
LB
SFR TW
=
=
∑
⋅
where,SFRi = Specifi c fertility rate in the i age group.
TWi = Total number of women in the i age group.
i = quinquennial ages from 15 to 49 years.
The States’ specifi c fertility rates were estimated by the application of the indirect technique of parturition ratio developed by Brass.2
For the age groups from one to four years old and from
fi ve to nine years old, the arithmetic mean between the coverage of zero to one year old and that of ten years old and older were admitted as coverage estimates.11,12
A procedure to redistribute ill-defi ned causes into
defined causes was proposed by Ledermann7 and
applied by Vallin.a He proposed a simple linear
regres-sion between the proportion of a specifi c cause of death (defi ned as dependent variable) and the proportion of ill-defi ned causes of death (defi ned as independent or explanatory variable). The angular coeffi cient of the regression, which can be estimated by the Least
Square Method4 (LSM), provides an estimation of
the proportion of ill-defi ned causes of death that shall be attributed to the specifi c cause of death or group of causes. The sum of the proportions derived by the angular coeffi cients generated to each cause of death shall be equal to -1. In turn, the sum of the linear
coef-fi cients shall be equal to zero. In this way, the angular coeffi cient provides a factor of redistribution of the ill-defi ned causes for each involved defi ned cause. An alternative methodology to this type of redistribution are generalized linear models, following the same idea proposed by Ledermann.7 Thus, LSM is more adequate
because it presents smaller residual deviation and Akaike information criterion.4
The redistribution of the ill-defi ned deaths was carried out in four stages:
1. Ledermann’s7 method was applied to the nine
Northeastern States in the triennium 1999/2000/2001 according to sex, using, to each State, its respective micro-regions as regression elements. The Northeast as a whole in 2000 was formed by a set of 188 micro-regions.
2. The coeffi cients of distribution (β) were estimated to fi ve groups of basic causes of death (International Classifi cation of Diseases, 10th Revision): Chapter
1 - Certain infectious and parasitic diseases; Chapter
2 – Neoplasms; Chapter 9 – Diseases of the circula-tory system; Chapter 10 – Diseases of the respiracircula-tory system. A category called “other causes” was created, from which the group of Chapter 20 – External causes of morbidity and mortality was excluded because they were considered well recorded here. In addition, Chapter 18 – Symptoms, signs and abnormal clinical and laboratory fi ndings, not elsewhere classifi ed (ill-defi ned) was used.
3. The obtained coeffi cients of redistribution were applied respectively to the ill-defi ned causes for the
fi ve groups of causes in each State. Thus, the recovery of the “true” absolute deaths by causes was obtained. It was admitted that these coeffi cients were the same to each micro-region belonging to the same State and constant to all age groups.
4. Even after the redistribution of deaths by ill-defi ned causes, there was also another volume of deaths: the unrecorded ones, with no knowledge of the associated basic causes. All these deaths were assumed to be ill-defi ned. Based on the coverage of the estimated deaths, it is possible to know the amount of deaths that were not recorded. In this way, the same proportions of the ill-defi ned causes, estimated to each cause by Ledermann’s method7 were reapplied to the unrecorded deaths, and
thus their basic causes were known.
For the construction of the MDLT, the methodology proposed by Chiang3 was employed. Its construction is
different from the classic life table8,14 only in column q x
which is replaced by the death probability that is net qx•, that is, it is accepted that a certain cause or set of causes was excluded from the population. For the construction of the life tables, the separation factors were ai′ used, available in Preston et al.14
RESULTS
Table 1 shows the coverage of deaths and ill-defi ned causes of the Northeastern States in 2000, for three age groups and by sex. The final death coverage estimates for those aged ≥10 years (adults), for both sexes, presented total amplitude between 70% and 92% and were higher than the coverage obtained for the other ages. A difference was noted in favor of the male sex in practically all States, except for Sergipe. The States that presented the highest coverage of adult deaths were Pernambuco, Sergipe and Bahia, which achieved a ceiling of 90%. On the other hand, the States of Piauí and Maranhão presented the lowest coverage of the Northeast (approximately 70% for both sexes in Maranhão). The total amplitude of the coverage for those younger than one year old ranged between 59% and 83%. Regarding the age group from one to nine
years, the amplitude ranged between 64% and 87%. For all age groups, the States obeyed practically the same hierarchy in order of magnitude.
The percentages of ill-defi ned causes for 2000 for all ages varied from 20% to 40% except for the State of Paraíba (46% for men and 51% for women), with lower values for the male sex.
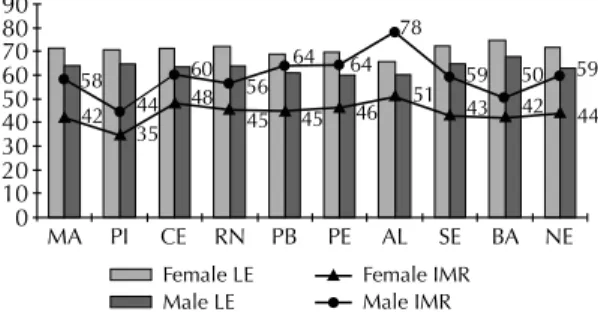
The Figure shows life expectancy according to sex for the Northeast and its States in 2000, reaching 71.8 years for the female sex and 64.0 for the male. The difference was around seven years for the majority of the Northeastern States, and shows higher mortality for men. The States of Bahia and Sergipe presented the highest life expectancies. The lowest levels were found in Alagoas, and for men, in Pernambuco. Northeast’s IMR (Figure) was 59 and 44 deaths every 1,000 liveborns for men and women, respectively. Alagoas presented the highest rates.
The application of Ledermann’s method7 produced
negative coeffi cients of redistribution (beta) for all causes of death in both sexes in 2000 and summation equal to -1 for all the Northeastern States (Table 2).
The coeffi cients of determination (R2) of the regression
analyses were interpreted as the proportion of causes of death explained by regression. They were high, varying between 60% and 95% for the majority of the causes
of death. Low values were found for infectious and parasitic diseases in all the States.
Table 3 illustrates for both sexes the profile and magnitude of the gains in percentage for the main causes of death before and after the redistribution of ill-defi ned causes. There was an increase in the rates referring to women, mainly in Rio Grande do Norte and Alagoas; for men, the highest increase was in the State of Alagoas. The greatest gains occurred for diseases of the circulatory system and the lowest, for infectious and parasitic diseases. The high gain in proportion of deaths due to circulatory diseases in Rio Grande do Norte reduced gains in the proportions of the other causes.
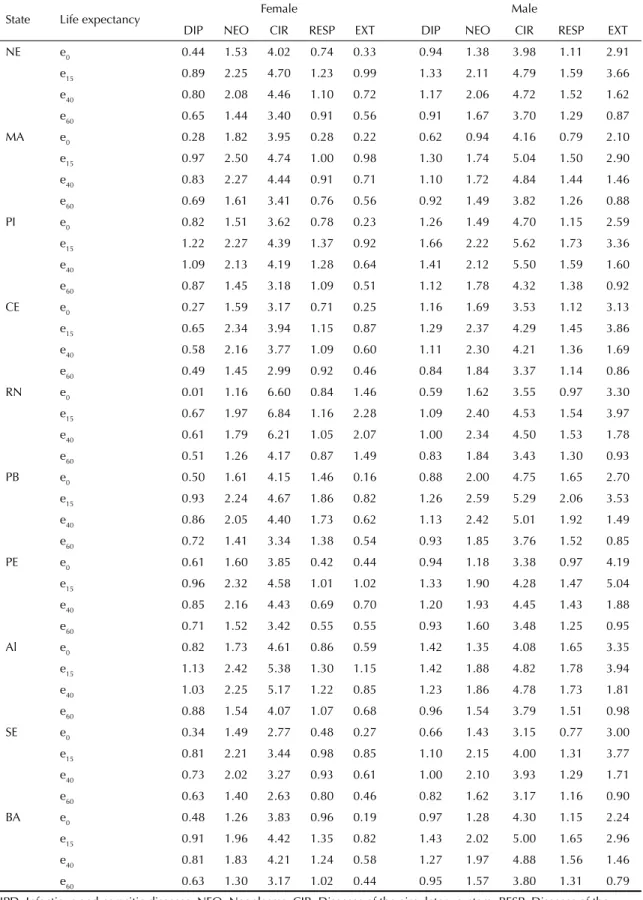
Table 4 shows the absolute differences between the observed life expectancies and those obtained after the elimination of causes of death for the Northeastern States in 2000, according to sex. In all situations, the greatest impacts occurred in the ages between 15 and 40 years, achieving maximum value at 15 years.
The main group of causes in general mortality was the circulatory diseases. When eliminated, they caused the greatest impacts on life expectancy in both sexes: on average 4.0 years for all the States and age groups. In Rio Grande do Norte, the average gain was 5.5 years for the female sex and in Piauí, 4.8 for the male sex.
Table 1. Coverage of deaths and ill-defi ned causes, according to age group and sex. Northeastern Brazil, 2000.
State Sex Coverage of ages (%) Ill-defi ned Causes
(%)a
0 to 1 1 to 9 >10a
Maranhão M 59.4 64.9 70.4 37.8
F 59.4 65.0 70.4 40.1
Piauí M 63.1 68.6 74.1 28.4
Fb 63.1 68.6 74.1 33.3
Ceará M 71.8 76.6 81.3 20.2
F 69.2 74.0 78.7 22.6
Rio Grande do Norte M 70.2 75.4 80.6 26.8
F 65.8 71.1 76.3 30.7
Paraíba M 69.4 75.9 82.3 46.2
F 66.3 72.7 79.2 50.8
Pernambuco M 81.6 86.7 91.7 20.9
F 80.8 85.9 90.9 25.4
Alagoas M 68.3 74.8 81.3 28.3
F 68.0 74.5 81.0 33.3
Sergipe M 80.1 84.7 89.3 26.9
F 82.5 87.1 91.7 32.4
Bahia M 80.4 84.8 89.3 27.3
F 79.6 84.1 88.5 30.5
a Extracted from Paes10
The group of external causes represented the second cause in volume and in gains for all the Northeastern States for the male sex and the fi fth for the female one. The exclusion of this cause provoked expressive gains for men, achieving an addition of approximately
fi ve years at the beginning of the young-adult ages in Pernambuco.
By eliminating the group of infectious and parasitic diseases, there was a higher gain for the male sex in all the States. In general, the gains in life expectancy at birth were inferior to those of the other ages.
In terms of representativeness in general mortality and increase in life expectancy, neoplasms occupied the second position for the female sex and the third one for the male sex. The elimination of neoplasms produces an increase in life expectancy for women in almost the entire life cycle, except at 60 years. The general average of gains was approximately 1.8 years for women and 1.5 for men.
The group of respiratory diseases was responsible for the fourth greatest impact on the life expectancy of the Northeast, with higher gains for men in all ages and States.
DISCUSSION
Generally speaking, the death coverage of the male sex was higher than that of the female sex and its levels presented satisfactory magnitudes for almost all the Northeastern States. One of the main justifi cations for
this superiority is the greater volume of deaths due to external causes among men, which are usually better informed and declared.6
It can be concluded that the death coverage followed a tendency of increase the more southwards the States are located in Brazil’s Northeast, except for the State of Alagoas. However, the percentages presented by the ill-defi ned causes for the States did not follow this tendency of regional relationship.
Some authors13,17 considered that a percentage of death
coverage above 75% would be statistically suffi cient to draw satisfactory conclusions about mortality levels.
Table 2. Coeffi cient of redistribution beta calculated by Ledermann’s Method, according to sex. Northeastern Brazil, 2000.
Group of causes Beta
MA PI CE RN PB AL PE SE BA
Male
Infectious and parasitic diseases -0.04 -0.11 -0.09 -0.07 -0.05 -0.06 -0.02 -0.03 -0.08
Neoplasms -0.09 -0.16 -0.15 -0.16 -0.17 -0.13 -0.08 -0.17 -0.12
Diseases of the circulatory system -0.42 -0.27 -0.33 -0.33 -0.36 -0.31 -0.20 -0.27 -0.38 Diseases of the respiratory system -0.09 -0.13 -0.11 -0.16 -0.13 -0.13 -0.06 -0.06 -0.12
Other causesa -0.36 -0.33 -0.32 -0.28 -0.29 -0.37 -0.64 -0.47 -0.30
Total -1 -1 -1 -1 -1 -1 -1 -1 -1
Female
Infectious and parasitic diseases -0.06 -0.12 -0.02 -0.04 -0.05 -0.05 -0.05 -0.05 -0.10
Neoplasms -0.14 -0.14 -0.14 -0.22 -0.17 -0.15 -0.16 -0.20 -0.10
Diseases of the circulatory system -0.50 -0.34 -0.41 -0.12 -0.39 -0.43 -0.39 -0.33 -0.40 Diseases of the respiratory system -0.02 -0.14 -0.11 -0.05 -0.16 -0.05 -0.09 -0.11 -0.10
Other causesa -0.28 -0.26 -0.32 -0.57 -0.23 -0.32 -0.31 -0.31 -0.30
Total -1 -1 -1 -1 -1 -1 -1 -1 -1
a Except external causes
MA: Maranhão, PI: Piauí, CE: Ceará, RN: Rio Grande do Norte, PB: Paraíba, PE: Pernambuco, AL: Alagoas, SE: Sergipe, BA: Bahia, NE: Northeast
90 80 70 60 50 40 30 20 10 0
MA PI CE RN PB PE AL SE BA NE
58 42 44
35 60 48 56
45 64
45 46 64
78
51 59 43
50 42
59 44
Female LE Male LE
Female IMR Male IMR
MA: Maranhão, PI: Piauí, CE: Ceará, RN: Rio Grande do Norte, PB: Paraíba, PE: Pernambuco, AL: Alagoas, SE: Sergipe, BA: Bahia, NE: Northeast
LE: Life Expectancy
IMR: Infant Mortality Rate per 1,000 liveborns.
Reaching such coverage levels, it is expected that the levels of ill-defi ned causes of death have a low percentage.6,12 The percentage of ill-defi ned causes
was elevated even in States where the percentage of death coverage was reasonably high. It is the case of the States of Pernambuco, Sergipe and Bahia, where the coverage was above 80% in all age groups, with death percentages of ill-defi ned causes varying between 20% and 33% for both sexes. Even considering the inherent mistakes in estimations, these results did not clarify the association between these two components for the Northeastern States in 2000.
The percentage of deaths by ill-defi ned causes was above 10% for all the States, which justifi es the use of the method of redistribution7 of these causes, employed
in the present work. Although the adjustments for infectious and parasitic diseases were not considered good by Ledermann’s method because they provided low coeffi cients of determination R2, the coeffi cients of
redistribution (beta) were maintained and considered valid, since the adjustments for the other causes were
considered good. Ledermann’s method7 proved to be
effi cient to solve the problem of deaths registered as ill-defi ned, enabling to calculate mortality rates and indexes closer to reality.
From the regional point of view, it was identifi ed that in all the Northeastern States the same groups of causes would be responsible for the greatest gains. The simulation exercise of complete elimination of diseases shows that it is possible that there are gains in life expectancy, postponing the deaths or preventing them in some situations.3,5,9,15 To control the occurrence of these
groups of diseases, there are treatment, tracking and early diagnosis, indispensable measures to gain more years of life. The external causes are totally avoidable or they can be minimized and their elimination would mean economy for the States and increase in people’s life expectancy.a
In general, the life expectancy years and the infant mortality estimates obtained for the Northeastern States
were close to the ones estimated by IBGE.b These
divergences are due mainly to the different employed methodologies. In the present work, the life tables were
Table 3. Proportions of causes of death before and after the redistribution of ill-defi ned causes, according to sex. Northeastern Brazil, 2000.
State Situation Female Male
DIP NEO CIR RESP DIP NEO CIR RESP
MA Before 0.044 0.081 0.202 0.058 0.048 0.054 0.175 0.049
After 0.064 0.192 0.392 0.069 0.059 0.086 0.327 0.082
PI Before 0.046 0.087 0.237 0.065 0.050 0.067 0.235 0.056
After 0.088 0.134 0.336 0.108 0.083 0.112 0.310 0.094
CE Before 0.051 0.134 0.264 0.090 0.052 0.104 0.214 0.075
After 0.056 0.164 0.352 0.113 0.069 0.133 0.277 0.095
RN Before 0.037 0.113 0.228 0.073 0.042 0.084 0.197 0.065
After 0.019 0.082 0.500 0.048 0.061 0.134 0.298 0.109
PB Before 0.031 0.053 0.176 0.068 0.038 0.044 0.148 0.055
After 0.057 0.136 0.369 0.148 0.058 0.121 0.306 0.114
PE Before 0.047 0.106 0.268 0.081 0.051 0.072 0.209 0.064
After 0.062 0.153 0.385 0.110 0.059 0.094 0.265 0.080
AL Before 0.006 0.008 0.022 0.009 0.006 0.005 0.018 0.007
After 0.077 0.135 0.374 0.107 0.083 0.088 0.285 0.109
SE Before 0.035 0.085 0.192 0.059 0.005 0.006 0.016 0.005
After 0.056 0.148 0.289 0.068 0.057 0.115 0.251 0.073
BA Before 0.047 0.088 0.238 0.075 0.055 0.074 0.193 0.067
After 0.066 0.132 0.363 0.116 0.078 0.108 0.301 0.100
IPD: Infectious and parasitic diseases; NEO: Neoplasms; CIR: Diseases of the circulatory system; RESP: Diseases of the respiratory system. MA: Maranhão, PI: Piauí, CE: Ceará, RN: Rio Grande do Norte, PB: Paraíba, PE: Pernambuco, AL: Alagoas, SE: Sergipe, BA: Bahia, NE: Northeast
a Camargo AM. Mortalidade por causas externas no estado de São Paulo e suas regiões [tese de doutorado]. São Paulo: Faculdade de Saúde Pública da USP; 2002.
Table 4. Absolute difference between the observed life expectancy and that obtained after elimination of causes of death, according to age and sex. Northeastern Brazil, 2000.
State Life expectancy Female Male
DIP NEO CIR RESP EXT DIP NEO CIR RESP EXT
NE e0 0.44 1.53 4.02 0.74 0.33 0.94 1.38 3.98 1.11 2.91
e15 0.89 2.25 4.70 1.23 0.99 1.33 2.11 4.79 1.59 3.66
e40 0.80 2.08 4.46 1.10 0.72 1.17 2.06 4.72 1.52 1.62
e60 0.65 1.44 3.40 0.91 0.56 0.91 1.67 3.70 1.29 0.87
MA e0 0.28 1.82 3.95 0.28 0.22 0.62 0.94 4.16 0.79 2.10
e15 0.97 2.50 4.74 1.00 0.98 1.30 1.74 5.04 1.50 2.90
e40 0.83 2.27 4.44 0.91 0.71 1.10 1.72 4.84 1.44 1.46
e60 0.69 1.61 3.41 0.76 0.56 0.92 1.49 3.82 1.26 0.88
PI e0 0.82 1.51 3.62 0.78 0.23 1.26 1.49 4.70 1.15 2.59
e15 1.22 2.27 4.39 1.37 0.92 1.66 2.22 5.62 1.73 3.36
e40 1.09 2.13 4.19 1.28 0.64 1.41 2.12 5.50 1.59 1.60
e60 0.87 1.45 3.18 1.09 0.51 1.12 1.78 4.32 1.38 0.92
CE e0 0.27 1.59 3.17 0.71 0.25 1.16 1.69 3.53 1.12 3.13
e15 0.65 2.34 3.94 1.15 0.87 1.29 2.37 4.29 1.45 3.86
e40 0.58 2.16 3.77 1.09 0.60 1.11 2.30 4.21 1.36 1.69
e60 0.49 1.45 2.99 0.92 0.46 0.84 1.84 3.37 1.14 0.86
RN e0 0.01 1.16 6.60 0.84 1.46 0.59 1.62 3.55 0.97 3.30
e15 0.67 1.97 6.84 1.16 2.28 1.09 2.40 4.53 1.54 3.97
e40 0.61 1.79 6.21 1.05 2.07 1.00 2.34 4.50 1.53 1.78
e60 0.51 1.26 4.17 0.87 1.49 0.83 1.84 3.43 1.30 0.93
PB e0 0.50 1.61 4.15 1.46 0.16 0.88 2.00 4.75 1.65 2.70
e15 0.93 2.24 4.67 1.86 0.82 1.26 2.59 5.29 2.06 3.53
e40 0.86 2.05 4.40 1.73 0.62 1.13 2.42 5.01 1.92 1.49
e60 0.72 1.41 3.34 1.38 0.54 0.93 1.85 3.76 1.52 0.85
PE e0 0.61 1.60 3.85 0.42 0.44 0.94 1.18 3.38 0.97 4.19
e15 0.96 2.32 4.58 1.01 1.02 1.33 1.90 4.28 1.47 5.04
e40 0.85 2.16 4.43 0.69 0.70 1.20 1.93 4.45 1.43 1.88
e60 0.71 1.52 3.42 0.55 0.55 0.93 1.60 3.48 1.25 0.95
Al e0 0.82 1.73 4.61 0.86 0.59 1.42 1.35 4.08 1.65 3.35
e15 1.13 2.42 5.38 1.30 1.15 1.42 1.88 4.82 1.78 3.94
e40 1.03 2.25 5.17 1.22 0.85 1.23 1.86 4.78 1.73 1.81
e60 0.88 1.54 4.07 1.07 0.68 0.96 1.54 3.79 1.51 0.98
SE e0 0.34 1.49 2.77 0.48 0.27 0.66 1.43 3.15 0.77 3.00
e15 0.81 2.21 3.44 0.98 0.85 1.10 2.15 4.00 1.31 3.77
e40 0.73 2.02 3.27 0.93 0.61 1.00 2.10 3.93 1.29 1.71
e60 0.63 1.40 2.63 0.80 0.46 0.82 1.62 3.17 1.16 0.90
BA e0 0.48 1.26 3.83 0.96 0.19 0.97 1.28 4.30 1.15 2.24
e15 0.91 1.96 4.42 1.35 0.82 1.43 2.02 5.00 1.65 2.96
e40 0.81 1.83 4.21 1.24 0.58 1.27 1.97 4.88 1.56 1.46
e60 0.63 1.30 3.17 1.02 0.44 0.95 1.57 3.80 1.31 0.79
IPD: Infectious and parasitic diseases; NEO: Neoplasms; CIR: Diseases of the circulatory system; RESP: Diseases of the respiratory system; EXT: External causes
constructed with the use of the corrected vital statis-tics, while IBGEa used indirect estimation methods by
means of population projections. The differences for the majority of the States did not exceed 1.5 years for life expectancy and 4 deaths per one thousand liveborns for infant mortality. For the Northeast as a whole, IBGE estimated a life expectancy at birth of 70.9 years for women and 63.6 for men.a The results in the present
work were a little higher: 0.9 years for women and 0.4 years for men. The infant mortality rate found by IBGE was estimated at 44.3 and 58.1 deaths per one thousand liveborns, respectively for women and men.
The age patterns of probabilities in logarithmic terms for the Northeast, obtained from the total elimination of deaths referring to each cause of death, revealed that the greatest reduction in early ages, young-adult ages and for more advanced ages is due to, respectively, elimination of infectious and parasitic diseases, external causes and circulatory diseases. Among the advanced ages, increases were observed in years of life deriving from the elimination of neoplasms and respiratory diseases in the death probability.
Additional investigations and explorations can be performed with the data of the present study. For example: simulating partial reductions in the causes of death; applying the theory of competing risks to specifi c causes such as tuberculosis, AIDS or diabetes; relating the costs of the diseases to the gains obtained by their elimination.
Considering that vital statistics are rarely used due to the usual argument of their defi ciency to produce reliable mortality indicators, the adjustment of these statistics explored a rehabilitation pathway whose results seem to be plausible. The similarity between the life expectancy estimates found in the present work and those indirectly estimated by IBGE shows good perspectives for the use of the direct data of the Northeastern States, after the adequate corrections.
It is concluded that the methodology employed to recover the explanatory power of these data in a direct way has produced consistent results, thus contributing for the understanding of the impact that the main dise-ases have on the epidemiological and health patterns of the Northeastern population.
1. Barboni AR, Gotlieb SLD. Impacto de causas básicas de morte na esperança de vida em Salvador e São Paulo, 1996. Rev Saude Publica. 2004;38(1):16-23. DOI:10.1590/S0034-89102004000100003
2. Brass W. Methods for estimating fertility and mortality from limited and defective data. Chapel Hill: International Program of Laboratories for Population Statistics; 1975.
3. Chiang CL. Introduction to stochastic processes in biostatistics. New York: John Willey; 1968.
4. Drapper NR, Smith H. Applied regression analysis. New York: Jonh Wiley; 1981.
5. Gotlieb SLD. Mortalidade diferencial por causas, São Paulo, Brasil, 1970: tábuas de vida de múltiplo decremento. Rev Saude Publica. 1981;15(4):401-17. DOI:10.1590/S0034-89101981000400006
6. Jasper-Faijer D, Orellana H. Evaluación del uso de las estadísticas vitales para estudios de causas de muerte en America Latina. Notas Poblacion. 1994;(60):47-77.
7. Ledermann S. La répartition de decés de causa indeterminée. Rev Inst Int Stat. 1955;23(1/3):47-57. DOI:10.2307/1402010
8. Namboodiri K, Suchindran CM. Life table techniques and their applications. Orlando: Academic Press; 1987.
9. Paes NA. Mortalidade em Recife: aplicação de um modelo de riscos competitivos. Rev Saude
Publica. 1985;19(3):251-62.
DOI:10.1590/S0034-89101985000300006
10. Paes NA. Um olhar sobre as estimativas da mortalidade infantil no nordeste provenientes de fontes tradicionais e do PACS. In: Teixeira P, organizador. Mortalidade
infantil: fontes, metodologias e resultados. Recife: Massangana; 1998. p. 143-64.
11. Paes NA. Avaliação da cobertura dos registros de óbitos dos estados brasileiros em 2000. Rev Saude
Publica. 2005;39(6):882-90.
DOI:10.1590/S0034-89102005000600003
12. Paes NA. Qualidade das estatísticas de óbitos por causas desconhecidas dos Estados brasileiros. Rev
Saude Publica. 2007;41(3):436-45. DOI:10.1590/
S0034-89102007000300016
13. Preston S, Coale AJ, Trussell J, Weinstein M. Estimating the completeness of reporting of adult deaths in populations that are aproximately stable. Popul Index.
1980;46(2):179-202. DOI:10.2307/2736122
14. Preston S, Heuveline P, Guillot M. Demography: measuring and modeling population processes. Oxford: Blackwell; 2001.
15. Silva MGC. Ganhos potenciais em esperança de vida com a exclusão das mortes por neoplasias malignas em Fortaleza, 1993-95. Rev Bras Cancerologia. 2001;47(4):413-24.
16. Simões CCS. Aspectos metodológicos das estimativas de mortalidade infantil no Brasil. In: Teixeira P, organizador. Mortalidade infantil: fontes, metodologias e resultados. Recife: Massangana; 1998. p. 143-164.
17. United Nations. Department of International Economic and Social Affairs. Model life tables for developing countries. New York; 1982. (Population studies, 77).
18. United Nations. Department of International Economic and Social Affairs. Manual X, indirect techniques for demographic estimation. New York; 1983. (Population studies, 81).
REFERENCES