Estimates for the Groundwater Isopod
Proasellus walteri
Cécile Capderrey
1, Bernard Kaufmann
1, Pauline Jean
1, Florian Malard
1, Lara Konecny-Dupré
1, Tristan
Lefébure
1, Christophe J. Douady
1,2*1 UMR5023 Ecologie des Hydrosystèmes Naturels et Anthropisés, Université de Lyon, Université Lyon 1, Centre National de la Recherche Scientifique, Villeurbanne, France, 2 Institut Universitaire de France, Paris, France
Abstract
Effective population size (Ne) is one of the most important parameters in, ecology, evolutionary and conservation
biology; however, few studies of Ne in surface freshwater organisms have been published to date. Even fewer studies
have been carried out in groundwater organisms, although their evolution has long been considered to be particularly constrained by small Ne. In this study, we estimated the contemporary effective population size of the obligate
groundwater isopod: Proasellus walteri (Chappuis, 1948). To this end, a genomic library was enriched for microsatellite motifs and sequenced using 454 GS-FLX technology. A total of 54,593 reads were assembled in 10,346 contigs or singlets, of which 245 contained candidate microsatellite sequences with suitable priming sites. Ninety-six loci were tested for amplification, polymorphism and multiplexing properties, of which seven were finally selected for Ne estimation. Linkage disequilibrium and approximate Bayesian computation methods revealed that Ne
in this small interstitial groundwater isopod could reach large sizes (> 585 individuals). Our results suggest that environmental conditions in groundwater, while often referred to as extreme, are not necessarily associated with small Ne.
Citation: Capderrey C, Kaufmann B, Jean P, Malard F, Konecny-Dupré L, et al. (2013) Microsatellite Development and First Population Size Estimates for the Groundwater Isopod Proasellus walteri. PLoS ONE 8(9): e76213. doi:10.1371/journal.pone.0076213
Editor: João Pinto, Instituto de Higiene e Medicina Tropical, Portugal
Received May 17, 2013; Accepted August 17, 2013; Published September 27, 2013
Copyright: © 2013 Capderrey et al. This is an open-access article distributed under the terms of the Creative Commons Attribution License, which permits unrestricted use, distribution, and reproduction in any medium, provided the original author and source are credited.
Funding: This research was funded by the French Water Agency Rhône-Méditerranée-Corse; the Agence Nationale de la Recherche (ANR-08-JCJC-0120- 01, "DEEP"); the Institut Universitaire de France; and the European Commission (7th EU Framework Programme, Contract No. 226874, BioFresh). The funders had no role in study design, data collection and analysis, decision to publish, or preparation of the manuscript.
Competing interests: The authors have declared that no competing interests exist. * E-mail: [email protected]
Introduction
Effective population size (Ne) is one of the most important
parameters in, ecology, evolutionary and conservation biology (e.g. [1-7]). Ne is classically defined as the number of breeding
individuals in an idealized population (i.e. a panmictic population, with sex ratio of one and no overlapping generations) that has the same rate of change of allele frequencies or heterozygosity than the population under consideration [8]. Knowing Ne allows evaluation of the effects of
genetic drift and natural selection, as well as their consequences for population viability in terms of genetic diversity loss or inbreeding effects (e.g. [2,9,10]). Accurate estimation of Ne has also become important from an analytical
point of view since the formalization of the coalescent theory [11] and democratization of Bayesian inferences in population genetics, because informative priors significantly improve estimation and recovery of posterior densities (e.g. [12]). Last but not least, accessing Ne provides access to genetic
parameters such as migration, mutation or recombination rates.
Despite community agreement about the importance of Ne, it
remains one of the most difficult parameters to assess in natural populations. First, no simple and general relationships exist between Ne and other demographic estimators such as
total population size (population census size, Nc [5]) or density
[13]. Indeed, the Ne/Nc ratio does not only vary among taxa but
is also likely to vary within species, especially in those showing high fecundity or high variation in density or reproductive success, such as arthropods and teleostean fishes [5,14]. Second, estimating Ne from genetic data is also a challenging
task because various approaches capture different components of effective population size [5,15,16]. Estimations of contemporary (current) Ne, the focus of this study by contrast
to long-term Ne inferred from sequence-based phylogenetic methods integrating Ne over hundreds of generations, were
single-sample approaches for estimating contemporary effective population size, using nuclear markers such as microsatellites and single nucleotide polymorphism [3,21,22]. As a consequence, estimates of contemporary Ne, while still sparse,
are becoming more frequent in the literature.
A survey of the current literature on freshwater metazoans revealed that most of our knowledge on Ne arises from studies
of actinopterygian fishes, with a strong bias towards economically important Salmoniformes. In particular, much effort was devoted to highlight the effect of environmental variables [23] and anthropogenic disturbances such as dams [24] or restocking practices [25,26] on Ne. Actinopterygian
fishes hence provided a much-needed opportunity to compare approaches and methods to estimate Ne [7] or to infer the
intraspecific variability of Ne (e.g. [27]). Aside from
actinopterygian taxa, information is available for lampreys [28], aquatic snails [29,30], mussels [31], calanoid copepods [32] and crayfishes, in the latter for long-term Ne only [33,34].
Non-permanent aquatic dwellers did not receive much attention either with only a few studies dedicated to frogs [35,36], newts [37], hydrophilid beetles [38], caddisflies [39] and damselflies [40]. Yet, most studies dealt with surface water taxa from streams, lakes, marshes, and springs, despite the fact that a large number of aquatic phylogenetic lineages are restricted to or occur predominantly in groundwater [41]. Rare exceptions concerned the estimation of long-term Ne for groundwater
crayfishes [33,42,43] and the estimation of Ne as a product of
an unknown mutation rate for diving beetles [44].
In this study, we estimated the contemporary effective
population size of the obligate groundwater isopod Proasellus
walteri (Chappuis, 1948). A genomic library was enriched for microsatellite motifs and sequenced using 454 GS-FLX technology. A total of 54,593 reads were assembled in 10,346 contigs or singlets, of which 245 contained candidate microsatellite sequences with suitable priming sites. Ninety-six loci were tested for amplification, polymorphism and multiplexing properties. Two genotyping multiplexes, for a total of seven loci were finally tested for cross-species transferability and used to infer contemporary effective population size in P. walteri.
Materials and Methods
Sampling and taxonomic identification
P. walteri morphospecies is a small (body length: 3 mm), eyeless, and depigmented isopod that inhabits the interstices in the hyporheic zone of rivers and groundwater in unconsolidated sediments. Its geographic range encompasses two major river catchments, the Rhine and Rhône Rivers (Figure 1). Proasellus is one of the most speciose genera in European groundwater, with approximately 120 species formally described in the literature. However, recent molecular studies by Morvan et al. [45] revealed that it contained a large number of unrecognized (morphologically cryptic) species. Morvan and coauthors distinguished three cryptic species within the P. walteri morphospecies: P. walteri_T058 is restricted to the Rhine River catchment, P. walteri_T059 to the Saône River catchment (a major tributary of the Rhône River)
and P. walteri_T060 to the southern part of the Rhône River catchment (see Figure 1). Hereafter, the focal taxon in this study, P. walteri_T060, is referred to as P. walteri.
The microsatellite library was developed using P. walteri
individuals from Sauzet site, six sites were used in amplification tests, five for polymorphism tests and two for Ne estimations
(Figure 1; Table 1). Additionally, six species were collected to test for microsatellite loci cross-species transferability. Field sampling did not involve endangered or protected species and none of the sampling sites required specific permission.
Individuals were collected using a Bou-Rouch pump [46] at a depth of 60 cm below the riverbed. After water elutriation, samples were placed in 96% ethanol at ambient temperature for transport back to the laboratory, then at 4°C until sorting and morphological identification. Specimens were identified at the species level using original species diagnoses, which are mostly based on the morphology of male copulatory organs (second pleopod). Given the prevalence of cryptic species in the Proasellus genus [45] and the occurrence of a
morphologically similar species complex Proasellus
synaselloides (Henry, 1963) living in sympatry with P. walteri, molecular verifications were conducted for each individual after genomic DNA extraction (see below). Following Chapman et al. [47], we developed a multiplex PCR scheme using one
genus-specific forward primer (16S-ProaF1:
5’-CCTATGAGTCGTTTAAATGGCCGCA-3’ [48]) and two species-specific reverse primers (16S-Pwalt-R458:
5’-CTATCTATATATATATTTGCTTATATAGGG-3’,
16S-Psyna-R217: 5’- TAAAGTTTTATAGGGTCTTATCGTCCA-3’, for P.
walteri and P. synaselloides complex, respectively) targeting the 16S mitochondrial DNA. Reverse primers were designed in such a way that PCR products were different in size (458 and
217 bp for P. walteri and P. synaselloides complex,
respectively) and could be differentiated by electrophoresis on 1.5% agarose gels.
Molecular identifications of species selected for cross-species transferability of microsatellites (Table 1) were performed by sequencing a fragment of the 16S using genus-specific primers (Forward: as above; reverse 16Sbr: 5′-CCGGTCTGAACTCAGATCACGT -3’ [49]) and by comparing obtained sequences to available references 45. Standard PCRs were conducted with a final 15 µl volume containing 1.5 µl of standard buffer (10 X, Eurobio, Courtaboeuf, France), 0.24 µl of each primer (10 µM), 0.18 µl of MgCl2 (50 mM,
Eurobio, Courtaboeuf, France), 0.15 µl of BSA (10 mg ml-1,
New England Biolabs, Ipswich, USA), 0.13 µl of dNTP (20 mM, Eurogenetec), 0.13 µl of EurobioTaq DNA Polymerase (5 U µl-1, Eurobio, Courtaboeuf, France) and 2 µl of genomic DNA
(c. 10 ng µl-1). Cycling conditions were as follows: (i) one step
Figure 1. Map showing the location of sampling sites. Dark, light and very light grey patterns show the River catchments colonized by Prosaellus walteri_T058, P. walteri_T059, and P. walteri_T060 (focal taxa), respectively. See Table 1 for site codes.
doi: 10.1371/journal.pone.0076213.g001
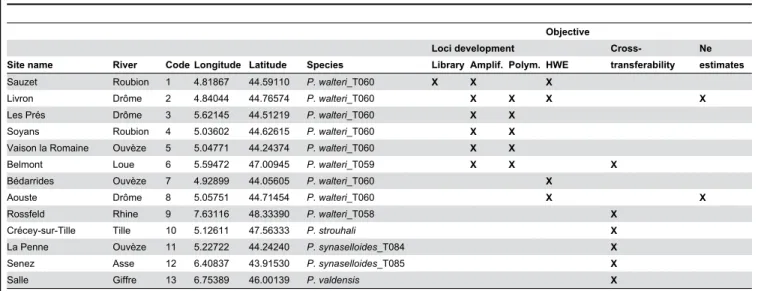
Table 1. Description of sites and species, and their use in the study.
Objective
Loci development Cross- Ne
Site name River Code Longitude Latitude Species Library Amplif. Polym. HWE transferability estimates
Sauzet Roubion 1 4.81867 44.59110 P. walteri_T060 X X X Livron Drôme 2 4.84044 44.76574 P. walteri_T060 X X X X
Les Prés Drôme 3 5.62145 44.51219 P. walteri_T060 X X Soyans Roubion 4 5.03602 44.62615 P. walteri_T060 X X Vaison la Romaine Ouvèze 5 5.04771 44.24374 P. walteri_T060 X X Belmont Loue 6 5.59472 47.00945 P. walteri_T059 X X X Bédarrides Ouvèze 7 4.92899 44.05605 P. walteri_T060 X Aouste Drôme 8 5.05751 44.71454 P. walteri_T060 X X
Rossfeld Rhine 9 7.63116 48.33390 P. walteri_T058 X Crécey-sur-Tille Tille 10 5.12611 47.56333 P. strouhali X La Penne Ouvèze 11 5.22722 44.24240 P. synaselloides_T084 X Senez Asse 12 6.40837 43.91530 P. synaselloides_T085 X Salle Giffre 13 6.75389 46.00139 P. valdensis X Latitude and longitude are expressed in decimal degrees. Species names follow Morvan et al. (2013). Crosses indicate whether the corresponding sites were used for library construction, amplification tests, polymorphism tests, assessment of loci parameters (HWE), cross- transferability experiments and Ne estimates.
Development of microsatellite markers
Genomic DNA was extracted using the chloroform extraction method optimized for Proasellus by Calvignac et al. [48]. Briefly, DNA was extracted from whole organisms following standard digestion (15 µg proteinase-K in 200 µl TNES buffer, 0.05 M Tris, 0.1 M NaCl, 0.01 M EDTA, 0.5% SDS) and salt-chloroform purification. DNA was resuspended in TE (TrisHCl, 10 mM, 1 mM EDTA) to a final volume of 16 µl. A microsatellite-enriched library was constructed by the Savannah River Ecology Laboratory according to Lance et al. [50] using a pooled DNA extract from 166 individuals of P. walteri collected at Sauzet site (Table 1). DNA was digested using RsaI, DNA fragments were ligated to SNX linkers, and dynabeads linked to di-, tri- and tetranucelotide microsatellite motives were used for enrichment. The enriched library was subsequently sequenced using a 454 FLX sequencer (454 Life Sciences/Roche Applied Biosystems, Nutley, NJ, USA). Raw DNA sequences were cleaned of remnant vectors and assembled in contigs with CAP3 [51]. Appropriate microsatellite motifs with suitable priming sites were subsequently identified using the program MSATCOMMANDER 1.0.4 [52]. Among these, 96 microsatellite loci were selected according to their type of motifs (di- and tetranucleotids), the length and purity of their repeat tract, and their size class. We favored loci with di-and tetranuclelotid motifs with the purest stretch di-and the most numerous repeats. Loci were also chosen so that three size classes (100-200 bp, 200-300 bp, and 300-400 bp) were kept in similar proportions to facilitate multiplexing. They were tested for amplification using P. walteri individuals from six sites (Table 1). For each site, DNA extracted from eight individuals was pooled because the limited amount of DNA recovered from single organisms (30 ng to 100 ng) would have been insufficient to carry out the 96 amplification tests. Next, polymorphism of amplifiable loci was evaluated using six non-pooled individuals from five sites (total number of individuals = 30, Table 1). PCR reactions were conducted using the Type-it TM Microsatellite PCR Kit (QIAGEN) in a 10-µl volume containing 5 µl of QIAGEN Multiplex PCR Master Mix, 3 µl of H2O, 1 µl of Primer Mix (2 µM), and 1 µl of DNA (20 ng µl-1).
Cycling conditions were as follows: (i) one step of initial denaturation (5 min) at 95°C, (ii) 32 (amplification experiment) or 39 (polymorphism experiment) cycles with denaturation (30 s) at 95°C, annealing (90 s) at 57°C (amplification) or 50°C (polymorphism), extension (30 s) at 72°C, and (iii) one step of final extension (30 min) at 60°C. Amplification and polymorphism were tested on 1.5% or 3% agarose gels respectively.
Microsatellite genotyping
Despite resolute efforts at optimization, only four loci could be combined into two PCR mixes of two loci and the three remaining loci had to be amplified separately (Table 2). PCRs for the two mixes of two loci (PCR mix 1: Pwalt_Di12 with Pwalt_Di21; and PCR mix 2: Pwalt_Te30 with Pwalt_Te39) were run using the Type-it TM Microsatellite PCR Kit (QIAGEN) in a 10-µl volume containing 5 µl of QIAGEN Multiplex PCR Master Mix, 1 µl of primer mix (F+R, 2 µM), 1µl of H2O, 1µl of
QIAGEN Q-solution and 2 µl of genomic DNA (c. 10 ng µl-1).
PCR reactions for Pwalt_Di31 and Pwalt_Di36 loci were run in a 10-µl volume containing 5.72 µl of H2O, 1 µl of standard
buffer 10X (New England Biolabs, Ipswich, USA), 1 µl of primer mix (F+R, 2 µM), 0.1 µl of BSA (10 mg ml-1, New England
Biolabs, Ipswich, USA), 0.09 µl of dNTP (20 mM,
Eurogenetec), 0.09 µl of Taq DNA Polymerase (5 U µl-1, New
England Biolabs, Ipswich, USA) and 2 µl of genomic DNA (c. 10 ng µl-1). PCRs for Pwalt_Te46 locus were conducted in a
10-µl volume containing 5.32 µl of H2O, 1 µl of standard buffer
(10 X, Eurobio, Courtaboeuf, France), 1 µl of primer mix (2 µM), 0.4 µl of MgCl2 (50 mM, Eurobio, Courtaboeuf, France),
0.1 µl of BSA (10 mg ml-1, New England Biolabs, Ipswich,
USA), 0.09 µl of dNTP (20 mM, Eurogenetec), 0.09 µl of
EurobioTaq DNA Polymerase (5 U µl-1, Eurobio, Courtaboeuf,
France) and 2 µl of genomic DNA (c. 10 ng µl-1). Cycling
condition were set as follows: (i) one step of initial denaturation (5 min) at 95°C (both mixes) or 94°C (3 independent PCRs); (ii) 39 cycles with denaturation (30 s) at 95°C (both mixes) or 94°C (3 independent PCRs), annealing for 90 s (both mixes) or 30 s (3 independent PCRs) at 58°C (Mix1) or 56°C (Pwalt_Di31 locus) or 54°C (Mix3 and Pwalt_Di36 locus) or 48°C (Pwalt_Te46 locus) and extension (30 s) at 72°C; and (iii) one step of final extension at 60°C for 30 min (both mixes) or 72°C for 10 min (3 independent PCR). PCR products were diluted 50 times and pooled into two genotyping mixes: 1) genotyping mix A containing PCR mixes 1 and 2, and 2) genotyping mix B containing the three loci amplified separately (Table 2). These mixes were then beads-purified (AxyPrep Mag PCR Clean-up, Axygen, Union City, CA, U.S.A.) and genotyped by a service provider (Biofidal-Themis, Vaulx-en-Velin, France) on a 3730xl DNA Analyzer (Applied Biosystems).
For each locus, alleles were scored independently by two operators with GENEMARKER v.1.95 (SoftGenetics), using GS600 LIZ size standard (Applied Biosystems). Every ambiguous genotype was amplified and genotyped twice. The presence of null alleles or allelic dropout was tested using MICRO-CHECKER [53]; when a significant presence was detected (p<0.05), null alleles frequencies were calculated. Heterozygosity was measured at four sites (Livron, Aouste, Sauzet, and Bédarrides) using GENETIX v.4.0.5.2 [54]. Deviation from Hardy-Weinberg equilibrium (HWE) and linkage disequilibrium (LD) were estimated at the same sites using GENEPOP v.4.0 [55,56]. Significance values were adjusted for multiple testing (HWE) and comparisons (LD) using sequential Bonferroni corrections [57].
Cross species transferability
Assessing microsatellite transferability for all Proasellus
species was far beyond the scope of this paper. Instead, we selected one site for each of the two other cryptic species within P. walteri morphospecies, one site for P. strouhali, which is the sister species of P. walteri complex, one site for the more distantly related morphospecies P. valdensis and two sites for
Estimation of effective population size
We estimated effective population size for two sampling sites (Table 1) using LDNe [22] and ONeSAMP [21]. LDNe uses a linkage disequilibrium method initially developed by Hill [58] and corrected for small sample size [59] to estimate Ne from a
single population sample, whereas ONeSAMP relies on approximate Bayesian computation (ABC). For LDNe, the lowest allele frequency used was 0.02. As no prior information was available on P. walteri census or effective population sizes, we used two as the lower value and 10,000 as the upper value for priors on Ne in ONeSAMP. Three exact replicate runs
per dataset were performed as cross validation tests on the online ONeSAMP. As neither LDNe nor ONeSAMP should be used with loci showing LD [21,22], calculations were made dropping one locus per pair in LD, to strictly comply with the conditions imposed by the methods.
Results
Microsatellite characterization
A total of 54,593 reads were obtained using 454 sequencing from the enriched library of genomic DNA from P. walteri. Mean read length reached 242 bp for 13.106 bp of total sequence
length. CAP3 assembled those reads in 4,225 contigs leaving 6,121 reads as singletons. Raw data were deposited in EBI ENA database (http://www.ebi.ac.uk/ena/) under the study
accession number PRJEB4363. MSATCOMMANDER
identified 4,518 sequences that contained di-, tri- or
tetranucleotid microsatellite loci (File S1), but it was able to define amplification primers for only 245 microsatellite loci (File S2). Among these, 96 loci were retained according to selection criteria. A total of 32 loci produced reliable amplification (i.e. clear band at expected size) in at least 3 out of 6 sampling sites (Table 1, Table S1) and 19 were found to be polymorphic (i.e. harbored multiple bands) on agarose gels. After fluorescent labeling, seven of these 19 loci were found to produce a clear signal without parasite peaks and at expected size, a strong signal to noise ratio and limited stutters. Thus, a total of 7 loci were considered to provide reliable genotyping (Table S1).
Gene diversity indices are reported in Table 3. Total number of alleles per locus was 11 in Pwalt_Di36, 15 in Pwalt_Di21 and Pwalt_Te30, 20 in Pwalt_Te39, 21 in Pwalt_Di31, 31 in Pwalt_Di12 and 42 for Pwalt_Te46 for a total 155 alleles. The number of alleles per locus per site ranged from five to 28 in 30 individuals genotyped at Sauzet and Bédarrides, and from seven to 30 in 90 individuals at Aouste and Livron. All loci had private alleles in at least one site and three loci had private alleles in all sites (Pwalt_Di12, Pwalt_Di21 and Pwalt_Te46). Importantly, the number of alleles and private alleles correspond to minimal values since homoplasy and point mutations in both flanking regions and microsatellite motives were not assessed. Observed and expected heterozygosities ranged from 0.300 to 0.933 and 0.362 to 0.918, respectively. Significant deviations from HWE were found in three loci out of seven and in two sites (Pwalt_Te39 in Livron and Aouste, Pwalt_Di12 in Aouste and Pwalt_Di21 also in Aouste). Tests
Table 2. Seven microsatellite loci from P. walteri with repeat motifs, PCR primers, fluoro-label marking, size ranges in base pairs (bp), PCR annealing temperatures (Ta) and Genbank accession numbers.
Locus Repeat motif Primer sequence (5' -3') Fluoro-label Alelle size range (bp)Ta (°C) GenBank accession number
Genotyping mix A PCR mix 1
Pwalt_Di12 (AG)12 F: CGGAGTGGTGTGTGAAATCTTC NED 89-209 58 KF423438
R: TTCCAGGCAGAACGAATTGC
Pwalt_Di21 (AG)12 F: AACGTCGAATACCCACTCAGAG HEX 99-143 58 KF423439
R: TCTCTCTAAGTGGATCGGCAAG
PCR mix 2
Pwalt_Te30 (ACAG)8 F: AAATTGACAAAGTCCAGTTCCG HEX 190-258 54 KF423440
R: ATTCTGCTTCTTTATTCCATCGTG
Pwalt_Te39 (ACTC)9 F: GAGCTGAACAACTACTGGCTTC 6-FAM 218-298 54 KF423441
R: GAAGTTATTCGTCGTCAGCTCC
Genotyping mix B Simplex
Pwalt_Di31 (AG)12 F: TTCGTTGCAGAGACGATGAATG PET 152-192 56 KF423442
R: CGTAAGGTCTCTGTGAAGTCTTC
Simplex
Pwalt_Di36 (AG)12 F: GTTGGTGTTTGCTGCAACTC HEX 162-182 54 KF423443
R: TACTGCACTGCCGCTATACAAG
Simplex
Pwalt_Te46 (ACTC)11 F: ACATTTGTTCTTTGGTGGAGGC HEX 300-410 48 KF423444
with the program MICRO-CHECKER indicated significant null allele presence in three out of four cases of significant HWE deviations (Table 3), sometimes at high frequency (e.g. 0.196 and 0.166 for Pwalt_Te39 in Aouste and Livron, respectively). After applying sequential Bonferroni corrections no LD was detected over all four sites (p > 0.573). However, within sites,
Pwalt_Te30 and Pwalt_Te39 were in LD in Livron (p = 0.014).
As a consequence, Ne was estimated in Livron without
Pwalt_Te39.
Microsatellite transferability
Cross-species amplification success rates were highly variable among species (Table 4). The seven loci were found to amplify better in P. walteri’s closest relatives as both P. walteri_T058 and P. walteri_T059 were successfully amplified for all loci in at least three out of five individuals and amplifications gave polymorphic products for all but one locus
per species (Pwalt_D31 in P. walteri_T058). Cross
amplification in P. strouhali failed for four loci and produced monophorphic fragments for the three remaining loci. In constrast, three loci were polymorphic in P. synaselloides
complex and four in P. valdensis. Cross-amplifications were
Table 3. Summary data for microsatellites developed for P. walteri.
Locus Sites name Rivers N A pA Ho He F p HWE NA
Pwalt_Di12
Livron Drôme 90 21 4 0.7556 0.8048 0,061 0.0321b
Aouste Drôme 88 24 6 0.7500 0.7972 0,059 0.0000a
Sauzet Roubion 30 10 2 0.8000 0.7994 -0,001 0.4347 Bédarrides Ouvèze 30 7 1 0.6000 0.6867 0,126 0.1158
Pwalt_Di21
Livron Drôme 90 9 2 0.7778 0.8713 0,107 0.0124b 0.0544
Aouste Drôme 90 11 1 0.7778 0.8602 0,096 0.0082a 0.0477 Sauzet Roubion 30 5 1 0.3000 0.3622 0,172 0.1121
Bédarrides Ouvèze 30 8 2 0.6333 0.6422 0,014 0.5021
Pwalt_Di31
Livron Drôme 90 17 0.8889 0.8948 0,007 0.0340b
Aouste Drôme 90 19 2 0.9111 0.9048 -0,007 0.5409 Sauzet Roubion 29 5 1 0.6552 0.6790 0,035 0.4603 Bédarrides Ouvèze 30 11 0.9333 0.8139 -0,147 0.9915
Pwalt_Di36
Livron Drôme 90 7 0.7667 0.7377 -0,039 0.7526 Aouste Drôme 90 7 0.7000 0.7457 0,061 0.3380 Sauzet Roubion 29 10 1 0.8966 0.8454 -0,060 0.8356 Bédarrides Ouvèze 30 9 1 0.8667 0.7961 -0,089 0.8840
Pwalt_Te30
Livron Drôme 90 12 0.7778 0.7717 -0,008 0.5369 Aouste Drôme 90 13 0.7889 0.7983 0,012 0.6276 Sauzet Roubion 30 12 1 0.7667 0.8222 0,068 0.1060
Bédarrides Ouvèze 29 10 0.6552 0.8228 0,204 0.0119b 0.1071
Pwalt_Te39
Livron Drôme 86 12 0.4302 0.6627 0,351 0.0000a 0.1662
Aouste Drôme 87 14 4 0.4713 0.7862 0,401 0.0000a 0.196 Sauzet Roubion 30 11 1 0.9000 0.8567 -0,051 0.7382
Bédarrides Ouvèze 30 8 0.8333 0.7772 -0,072 0.5078
Pwalt_Te46
Livron Drôme 87 30 5 0.8851 0.9181 0,037 0.4053 Aouste Drôme 89 28 5 0.9326 0.9111 -0,024 0.0374b
Sauzet Roubion 29 8 2 0.7931 0.7658 -0,036 0.0451b
Bédarrides Ouvèze 28 28 4 0.7857 0.8246 0,047 0.3664
Number of individual (N), Number of alleles (A), private allelic richness (pA), observed (HO) and expected (He) heterozygosities, fixation index (F), probability of deviation
from Hardy-Weinberg equilibrium (p HWE) and frequency of null alleles (NA) are given for each locus for N individuals from four sampling sites of P. walteri. Uncorrected significant deviations from HWE are in bold. Frequencies of null alleles are given only when the probability of their presence was significant (p < 0.05)
a Significant after sequential Bonferroni correction; b Not significant after sequential Bonferroni correction
also highly variable among loci. Products were obtained from all species for Pwalt_Di12 and Pwalt_Di21 loci (86 and 73% of individuals, respectively), whereas Pwalt_Di36 gave reliable products solely in the P. walteri complex.
Effective population size
Ne point estimates and associated 95% confidence intervals
are reported in Table 5. LDNe provided large estimates of Ne in
Livron (Ne = 892) and Aouste, where a negative value indicated
that Ne was indistinguishable from infinity [60]. The lower
confidence interval in Livron was 243 and reached 585 in Aouste. Upper confidence intervals reached infinity in both estimates. ONeSAMP results proved more challenging to analyze, as replicate runs did not seem to converge in Aouste, with point estimates ranging from 533 to 1844. Replicate runs were more stable in Livron where point estimates ranged from 142 to 186, with lowest and highest confidence intervals of 83 and 327, respectively. LDNe point estimates were hence always higher than those provided by ONeSAMP, and in Livron, the LDNe estimate was even far above the highest confidence interval provided by ONeSAMP (892 vs 327).
Discussion
We successfully identified 4,518 microsatellite loci in the non-model organism P. walteri. Of these, 245 contained flanking regions sufficiently long for further amplification, 96 were tested and seven proved to be useful for subsequent analyses in population genetics. This demonstrates that
Table 5. Estimated mean effective population size (Ne) of P.
walteri at two river sites inferred from 90 individuals using LDNe and ONeSAMP.
Livron 6 loci (without Pwalt_Te39)Aouste 7 loci
Ne - LDNe 892 (243 - Infinite) -1470 (585 - Infinite) Ne - ONeSAMP Run 1 186 (103-327) 533 (202-1995)
Run 2 182 (93-314) 1209 (434-5855) Run 3 142 (83-260) 1844 (557-10265) Brackets show 95% confidence intervals
doi: 10.1371/journal.pone.0076213.t005
despite tremendous advances made over recent years in the development of microsatellite markers, this process can still be a challenging endeavor. Library screening using high throughput sequencing facilities can now be performed even
for non-model organisms such as P. walteri and can reveal a
large number of microsatellite loci. However this first stage, while being crucial to start with a large number of candidates, is by no means a guarantee as the number of useful loci may dwindle dramatically along the development process.
Our finding that sampling sites were characterized by highly polymorphic microsatellite loci does not support prevailing views that populations of subterranean organisms do not support high genetic diversity (e.g. [61,62]). While surprising at the site level, high diversity among sites, as is evidenced by numerous private alleles, was somewhat more expected. In a recent diversification study of the Aselloidea, Morvan et al. [45] suggested using a Bayesian relaxed clock model that the three cryptic species of the P. walteri complex diverged between six and 10 million years ago. Given this time frame, populations of
P. walteri_T060 sampled in this study might have diverged a long time ago, thereby providing a reasonable explanation for both the high among-sites allelic diversity and the significant frequency of null alleles encountered at some sites and loci. Linkage disequilibrium between loci was found in one site only. Therefore, linkage processes affecting these loci, while highly significant were probably not caused by physical proximity on chromosomes. However, none of the many other processes resulting in linkage disequilibrium, such as bottlenecks, population substructuring or local selection regimes [63] could be dismissed here.
Cross-species amplification was successful and
polymorphism was high among species of the P. walteri
complex, but both were hard to predict from phylogenetic distances in more distantly related species. Indeed, P. strouhali
is more closely related to P. walteri complex than any of the other three species considered in this study [45]. Yet, cross amplifications in P. strouhali failed or were uninformative for all loci, whereas three and four loci were polymorphic in P. synaselloides complex (i.e. two cryptic species) and P. valdensis, respectively. The expectation that cross-species amplification and polymorphism decrease with increasing genetic distance between the species from which the loci were isolated and the target species was validated in several
Table 4. Cross-species amplification tests showing amplicon size ranges for the seven microsatellite loci in six different Proasellus species.
Species Sites name Pwalt_Te30 Pwalt_Te39 Pwalt_Di12 Pwalt_Di21 Pwalt_Di31 Pwalt_Di36 Pwalt_Te46
P. walteri_T058 Rossfeld 218-266 (5) 178-278 (4) 87-101 (5) 99-103 (5) 150 (5) 164-172 (5) 306-330 (3)
P. walteri_T059 Belmont 206-222 (4) 198-214 (4) 93-211 (5) 101-105 (5) 156-186 (4) 158-164 (5) 310-338 (3)
P. strouhali Crécey-sur-Tille — 178 (5) 111 (5) 113 (1) — — —
P. synaselloides_T084 Lapenne 206 (2) 178 (1) 89-115 (5) 99-111 (5) 144-158 (2) • (2) —
P. synaselloides_T085 Senez 210 (1) — 93-103 (2) 101-111 (2) 176 (1) • (1) 294-300 (1)
P. valdensis Salles — 178-290 (5) 87-179 (4) 93-101 (4) 116-184 (2) • (2) —
Numbers between brackets indicate the number of individuals (out of five individuals) with positive amplification, • indicates non-specific amplification, — indicates negative amplification in all individuals.
vertebrate taxa [64,65]. It is however poorly documented in arthropods, and even much less so in freshwater taxa. Primmer et al. [64] suggested that the negative relationship between transferability and genetic distance was linear while Carreras-Carbonell et al. [65] argued it was logarithmic. Our results, if confirmed by additional cross-species experiments, are more compatible with the pattern proposed by Carreras-Carbonell et al. [65], with a high success rate between very closely related species (i.e. within P. walteri morphospecies) followed by a sharp decrease and large variance as phylogenetic distance increases. Whatever the relationship, success rates in cross species amplification and polymorphism reported in the present study suggest that the loci we characterized and developed might be of significant interest for future studies on the ecology of species within the P. walteri complex. These species are widespread in the hyporheic zones of two major catchments (the Rhine and Rhône rivers) that experienced contrasted Pleistocene climates, thereby providing a rare opportunity to test for the effect of past environmental conditions on population dynamics.
Estimates in P. walteri pointed towards large Ne, with a point
estimate of 892 in Livron and a minimum of 585 individuals in Aouste. While similar to Ne estimated in two species of calanoid
copepods (Ne = 672.7 and 1027.4 [32]), these estimates are at
odds with the small sizes inferred in snails (Ne ≤ 10 [29]; or Ne ≤
245 [30]), damselflies (Ne ≤ 250 in most sites and for most
methods [40]) or hydrophilid beetles (Ne < 20 [38]). There was
however a marked difference between the two sites investigated, as in Aouste, a very large Ne seemed to prevent
LDNe from providing a point estimate different from infinity, and resulted in the absence of convergence between ONeSAMP runs [5]. In contrast, ONeSAMP runs returned congruent values of Ne in Livron and both approaches suggested a
smaller Ne than in Aouste. Such variations are consistent with
current literature that often report Ne estimates varying by
several orders of magnitude in the same species (e.g. [30,36]). Furthermore, our observation empirically corroborates simulations suggesting that accurate and precise estimations can hardly be achieved for moderate or large Ne (> c. 500[60]),
even when large amounts of genetic information are available. Our inferences rely on large sample sizes (>87 individuals per population) and high allelic richness (averages of 15.4 and 16.6 for Livron and Aouste, respectively), but on seven loci only. However, as stated by Luikart et al. [5], “precision for estimates of Ne can be improved by roughly the same amount by sampling more individuals or by sampling more microsatellite loci” [18,60,66,67]. We used approximately 3 to 4 time more individuals per population than in most studies (e.g. [25,29,30,36,39]). Moreover, allelic richness of our loci was high as compared to other studies of freshwater organisms (e.g. [30,35,39]). A high allelic richness should theoretically increase the precision of Ne estimates by LDNe as well as that of ONeSAMP summary statistics (e.g. for He [68]). LDNe estimates rely on the number of independent comparisons: (ni,j = (ki - 1) * (kj - 1), where ki and kj represent the number of
alleles at loci i and j, respectively [10]). Altogether, this suggests that obtaining precise estimations for moderate to large Ne probably requires fulfilling the following conditions:
improving estimation methods, acquiring many more loci using techniques such as Rad-tag sequencing [69] and getting even larger sample sizes [5].
Importantly, our inference of large Ne in an obligate
groundwater organism such as P. walteri may not be as surprising as prevailing views may suggest. Indeed, Kane et al. [70] using allozymes heterozygosity, and a calculation based on the classical relation He=4N eµ/(4N eµ +1) where He is the
expected heterozygosity and µ the mutation rate, also reported large Ne for Gammarus minus amphipods (Ne = 2x10⁵) and
Astyanax fasciatus teleosteans (Ne = 9x10⁴). For comparison,
using the same formula with our data, He for the least and most polymorphic loci, and a mutation rate of 10-4 for
microsatellites, returned slightly lower Ne ranges of 5x10³ to
3x10⁴ in Livron and 9x10³ to 3x10⁴ in Aouste. However,
calculations based on this formula provide rough estimates that cannot be compared with LDNe or ONeSAMP estimates.
Finding large Ne in groundwater taxa suggests that
environmental factors in groundwater, while often referred to as extreme, are not necessarily associated with small Ne.
However, our results desperately call for further assessments of Ne in groundwater as well as in closely related
surface-dwelling species. Such comparisons will make it possible to formally test another central question in groundwater ecology: is Ne reduced in groundwater-dwellers when compared to their
surface counterparts? To our knowledge, the best evidence in
favor of decreased Ne in groundwater comes from
mitochondrial comparisons in crayfishes [33]. However, Buhay & Crandal [33] documented changes in long-term Ne of
crayfishes rather than changes in contemporary Ne. Other
evidences come from reduced heterozygosity values in groundwater [61,62,71], but this reduction may not be systematic [72] nor readily interpretable in terms of Ne [73].
Importantly, to solve this issue, alternative molecular methods such as Single Nucleotide Polymorphism detection and calling using RAD-tag sequencing [69] seem very promising as they may provide thousands of loci when it proves difficult to develop more than tens loci in most, including ours, microsatellite studies. These methods will also make it possible to access other long-standing issues including spatial delineation of population and dispersal processes.
Supporting Information
File S1. 4,518 sequences identified by MSATCOMMANDER containing di-, tri- or tetranucleotid microsatellite loci. (TXT)
File S2. 245 microsatellite loci identified by MSATCOMMANDER with suitable priming regions.
(TXT)
Acknowledgements
We thank D. Eme and P. Charrier who helped to collect specimens.
Author Contributions
Conceived and designed the experiments: CC BK FM CJD. Performed the experiments: CC BK PJ FM LKD TL CJD.
Analyzed the data: CC BK. Contributed reagents/materials/ analysis tools: CC BK PJ FM TL CJD. Wrote the manuscript: CC BK PJ FM FKD TL CJD.
References
1. Scribner KT, Arntzen JW, Burke T (1997) Effective number of breeding adults in Bufobufo estimated from age-specific variation at minisatellite loci. Mol Ecol 6: 701-712. doi:10.1046/j.1365-294X.1997.00238.x. PubMed: 9262012.
2. Waples RS (2002) Evaluating the effect of stage-specific survivorship on the Ne/N ratio. Mol Ecol 11: 1029-1037. doi:10.1046/j.1365-294X. 2002.01504.x. PubMed: 12090236.
3. Wang J (2005) Estimation of effective population sizes from data on genetic markers. Philos Trans R Soc B 360: 1395-1409. doi:10.1098/ rstb.2005.1682. PubMed: 16048783.
4. Charlesworth B (2009) Effective population size and patterns of molecular evolution and variation. Nat Rev Genet 10: 195–205. doi: 10.1038/ni.1683. PubMed: 19204717.
5. Luikart G, Ryman N, Tallmon DA, Schwartz MK, Allendorf FW (2010) Estimation of census and effective population sizes: the increasing usefulness of DNA-based approaches. Conserv Genet 11: 355-373. doi:10.1007/s10592-010-0050-7.
6. Gossmann TI, Woolfit M, Eyre-Walker A (2011) Quantifying the variation in the effective population size within a genome. Genetics 189: 1389-1402. doi:10.1534/genetics.111.132654. PubMed: 21954163.
7. Serbezov D, Jorde PE, Bernatchez L, Olsen EM, Vøllestad LA (2012) Short-term genetic changes: evaluating effective population size estimates in a comprehensively described brown trout (Salmotrutta) population. Genetics 191: 579-592. doi:10.1534/genetics.111.136580. PubMed: 22466040.
8. Wright S (1931) Evolution in Mendelian populations. Genetics 16: 97– 159. PubMed: 17246615.
9. Frankham R, Ballou JD, Briscoe DA (2009) An Introduction to Conservation Genetics. 2nd edition. Cambridge, UK: Cambridge University Press.
10. Araguas RM, Vidal O, Pla C, Sanz N (2012) High genetic diversity of the endangered Iberian three-spined stickleback (Gasterosteus aculeatus) at the Mediterranean edge of its range. Freshwat Biol 57: 143-154. doi:10.1111/j.1365-2427.2011.02705.x.
11. Kingman JFC (1982) On the Genealogy of Large Populations. J Appl Probab 19: 27-43. doi:10.2307/3213548.
12. Ewing G, Rodrigo AG (2006) Coalescent-based estimation of population parameters when the number of demes changes over time. Mol Biol Evol 23: 988-995. doi:10.1093/molbev/msj111. PubMed: 16495347.
13. Osborne MJ, Davenport SR, Hoagstrom CW, Turner TF (2010) Genetic effective size, Ne, tracks density in a small freshwater cyprinid, Pecos
bluntnose shiner (Notropissimuspecosensis). Mol Ecol 19: 2832-2844. doi:10.1111/j.1365-294X.2010.04695.x. PubMed: 20579288.
14. Ardren WR, Kapuscinski AR (2003) Demographic and genetic estimates of effective population size (Ne) reveals genetic compensation in steelhead trout. Mol Ecol 12: 35-50. PubMed: 12492876.
15. Schwartz MK, Tallmon DA, Luikart G (1999) DNA-based methods for estimating population size: many methods, much potential, unknown utility. Anim Conserv 2: 321–323. doi:10.1111/j. 1469-1795.1999.tb00079.x.
16. Leberg P (2005) Genetic approaches for estimating the effective size of populations. J Wildl Manage 69: 1385–1399. doi: 10.2193/0022-541X(2005)69[1385:GAFETE]2.0.CO;2.
17. Nei M, Tajima F (1981) Genetic drift and estimation of effective population size. Genetics 98: 625-640. PubMed: 17249104.
18. Waples RS (1989) A generalized approach for estimating effective population size from temporal changes in allele frequency. Genetics 121: 379–391. PubMed: 2731727.
19. Wang J (2001) A pseudo-likelihood method for estimating effective population size from temporally spaced samples. Genet Res 78: 243-257. doi:10.1017/S0016672301005286. PubMed: 11865714. 20. Wang J, Whitlock MC (2003) Estimating effective population size and
migration rates from genetic samples over space and time. Genetics 163: 429-446. PubMed: 12586728.
21. Tallmon DA, Koyuk A, Luikart G, Beaumont MA (2008) ONeSAMP: a program to estimate effective population size using approximate Bayesian computation. Mol Ecol Resour 8: 299–301. doi:10.1111/j. 1471-8286.2007.01997.x. PubMed: 21585773.
22. Waples RS, Do C (2008) LDNe: a program for estimating effective population size from data on linkage disequilibrium. Mol Ecol Resour 8: 753–756. doi:10.1111/j.1755-0998.2007.02061.x. PubMed: 21585883. 23. Østergaard S, Hansen MM, Loeschcke V, Nielsen EE (2003) Long-term
temporal changes of genetic composition in brown trout (Salmotrutta
L.) populations inhabiting an unstable environment. Mol Ecol 1 2: 3123-3135. PubMed: 14629391.
24. Clemento AJ, Anderson EC, Boughton D, Girman D, Garza JC (2009) Population genetic structure and ancestry of Oncorhynchus mykiss populations above and below dams in south-central California. Conserv Genet 10: 1321-1336. doi:10.1007/s10592-008-9712-0.
25. Dawnay N, Dawnay L, Hughes RN, Cove R, Taylor MI (2011) Substantial genetic structure among stocked and native populations of the European grayling (Thymallusthymallus, Salmonidae) in the United Kingdom. Conserv Genet 12: 731-744. doi:10.1007/ s10592-010-0179-4.
26. Gow JL, Tamkee P, Heggenes J, Wilson GA, Taylor EB (2011) Little impact of hatchery supplementation that uses native broodstock on the genetic structure and diversity of steelhead trout revealed by a large-scale spatio-temporal microsatellite survey. Evol Appl 4: 763-782. doi: 10.1111/j.1752-4571.2011.00198.x.
27. Massa-Gallucci A, Coscia I, O’Grady M, Kelly-Quinn M, Mariani S (2010) Patterns of genetic structuring in a brown trout (Salmo trutta. p. L.) metapopulation. Conserv Genet 11: 1689-1699.
28. Taylor EB, Harris LN, Spice EK, Docker MF (2012) Microsatellite DNA analysis of parapatric lamprey (Entosphenus spp.) populations: implications for evolution, taxonomy, and conservation of a Canadian endemic. Can J Zool 90: 291-303. doi:10.1139/z11-135.
29. Trouve S, Degen L, Goudet J (2005) Ecological components and evolution of selfing in the freshwater snail Galbatruncatula. J Evol Biol 18: 358-370. PubMed: 15715842.
30. Djuikwo-Teukeng FF, Njiokou F, Nkengazong L, De Meeûs T, Ekobo AS et al. (2011) Strong genetic structure in Cameroonian populations of
Bulinus truncatus (Gastropoda: Planorbidae), intermediate host of Schistosoma haematobium. Infect Genet Evol 11: 17-22. doi:10.1016/ j.meegid.2010.10.018. PubMed: 21075219.
31. Jones JW (2009) Genetics, demography and modeling of freshwater mussel (Bivalvia: Unionidae) populations in the Clinch River, U.S.A. Ph.D. Dissertation, Virginia State University. 218pp.
32. Zeller M, Reusch TBH, Lampert W (2008) Small effective population sizes in two planktonic freshwater copepod species (Eudiaptomus) with apparently large census sizes. J Evol Biol 21: 1755-1762. doi:10.1111/j. 1420-9101.2008.01589.x. PubMed: 18713242.
33. Buhay JE, Crandall KA (2005) Subterranean phylogeography of freshwater crayfishes shows extensive gene flow and surprisingly large population sizes. Mol Ecol 14: 4259-4273. doi:10.1111/j.1365-294X. 2005.02755.x. PubMed: 16313591.
34. Dillman CB, Wagner BK, Wood RM (2007) Systematics of Species of Special Concern in the Genus Orconectes from the Ozark Highlands. Case Studies from Species Pairs: Orconectes neglectus neglectus,
Orconectes neglectus chaenodactylus and Orconectes macrus,
35. Ficetola GF, Padoa-Schioppa E, Wang J, Garner TWJ (2010) Polygyny, census and effective population size in the threatened frog,
Rana latastei. Anim Conserv 13: 82-89. doi:10.1111/j. 1469-1795.2009.00306.x.
36. Phillipsen IC, Funk WC, Hoffman EA, Monsen KJ, Blouin MS (2011) Comparative analyses of effective population size within and among species: ranid frogs as a case study. Evolution 65: 2927-2945. doi: 10.1111/j.1558-5646.2011.01356.x. PubMed: 21967433.
37. Jehle R, Wilson GA, Arntzen JW, Burke T (2005) Contemporary gene flow and the spatio-temporal genetic structure of subdivided newt populations (Trituruscristatus, T-marmoratus). J Evol Biol 18: 619-628. doi:10.1111/j.1420-9101.2004.00864.x. PubMed: 15842491.
38. Beebee TJC (2007) Population structure and its implications for conservation of the great silver beetle Hydrophiluspiceus in Britain. Freshwat Biol 52: 2101-2111. doi:10.1111/j.1365-2427.2007.01834.x. 39. Shama LNS, Kubow KB, Jokela J, Robinson CT (2011) Bottlenecks
drive temporal and spatial genetic changes in alpine caddisfly metapopulations. BMC Evol Biol, 11: 278. doi: 10.1186/1471-2148-11-278. PubMed: 21951631.
40. Watts PC, Saccheri IJ, Kemp SJ, Thompson DJ (2007) Effective population sizes and migration rates in fragmented populations of an endangered insect (Coenagrionmercuriale: Odonata). J Anim Ecol 76: 790-800. doi:10.1111/j.1365-2656.2007.01249.x. PubMed: 17584385. 41. Stoch F, Galassi DMP (2010) Stygobiotic crustacean species richness:
a question of numbers, a matter of scale. Hydrobiologia 653: 217-234. doi:10.1007/s10750-010-0356-y.
42. Finlay JB, Buhay JE, Crandall KA (2006) Surface to subsurface freshwater connections: phylogeographic and habitat analyses of
Cambarus tenebrosus, a facultative cave-dwelling crayfish. Anim Conserv 9: 375-387. doi:10.1111/j.1469-1795.2006.00046.x.
43. Buhay JE, Moni G, Mann N, Crandall KA (2007) Molecular taxonomy in the dark: Evolutionary history, phylogeography, and diversity of cave crayfish in the subgenus Aviticambarus, genus Cambarus. Mol Phylogenet Evol 42: 435-448. doi:10.1016/j.ympev.2006.07.014. PubMed: 16971141.
44. Guzik MT, Cooper SJB, Humphreys WF, Austin D (2009) Fine-scale comparative phylogeography of a sympatric sister species triplet of subterranean diving beetles from a single calcrete aquifer in Western Australia. Mol Ecol 18: 3683-3698. doi:10.1111/j.1365-294X. 2009.04296.x. PubMed: 19674311.
45. Morvan C, Malard F, Paradis E, Lefébure T, Konecny-Dupré L et al. (2013) Timetree of Aselloidea reveals species diversification dynamics in groundwater. Syst Biol, 62: 512–22. doi:10.1093/sysbio/syt015. PubMed: 23461879.
46. Bou C, Rouch R (1967) Un nouveau champ de recherches sur la faune aquatique souterraine. C R Acad Sci Paris 265: 369-370.
47. Chapman DD, Abercrombie DL, Douady CJ, Pikitch EK, Stanhope MJ et al. (2003) A streamlined, bi-organelle, multiplex PCR approach to species identification: Application to global conservation and trade monitoring of the great white shark, Carcharodoncarcharias. Conserv Genet 4: 415-425. doi:10.1023/A:1024771215616.
48. Calvignac S, Konecny L, Malard F, Douady CJ (2011) Preventing the pollution of mitochondrial datasets with the nuclear mitochondrial paralogs (numts). Mitochondrion 11: 246-254. doi:10.1016/j.mito. 2010.10.004. PubMed: 21047564.
49. Palumbi SR (1996) Nucleid AcidsII: The Polymerase Chain Reaction7. In: DM HillisC MoritzBK Mable. Molecular Systematics Chapter. Sunderland, MA: Sinauer Associates. pp. 205-248.
50. Lance SL, Light JE, Jones KL, Hagen C, Hafner JC (2010) Isolation and characterization of 17 polymorphic microsatellite loci in the kangaroo mouse, genus Microdipodops (Rodentia: Heteromyidae). Conserv Genet Resour 2: 139-141. doi:10.1007/s12686-010-9195-4. 51. Huang X, Madan A (1999) CAP3: A DNA sequence assembly program.
Genome Res 9: 868-877. doi:10.1101/gr.9.9.868. PubMed: 10508846. 52. Faircloth BC (2008) MSATCOMMANDER: detection of microsatellite
repeat arrays and automated, locus-specific primer design. Mol Ecol 8: 92–94. doi:10.1111/j.1471-8286.2007.01884.x. PubMed: 21585724. 53. Van Oosterhout C, Hutchinson WF, Wills DPM, Shipley P (2004)
MICRO-CHECKER: software for identifying and correcting genotyping errors in microsatellite data. Mol Ecol Resour 4: 535-538.
54. Belkhir K, Borsa P, Chikhi L, Raufaste N, Bonhomme F (1996-2004) GENETIX. p. 4.05, logiciel sous Windows TM pour la génétique des populations. Montpellier, France: Laboratoire Génome, Populations, Interactions, CNRS UMR 5171, Université de Montpellier II.
55. Raymond M, Rousset F (1995) GENEPOP (version 1.2): population genetics software for exact tests and ecumenicism. J Hered 86: 248-249.
56. Rousset F (2008) Genepop’007: a complete reimplementation of the Genepop software for Windows and Linux. Mol Ecol Resour 8: 103-106. doi:10.1111/j.1471-8286.2007.01931.x. PubMed: 21585727. 57. Rice W (1989) Analyzing tables of statistical tests. Evolution 43: 223–
225. doi:10.2307/2409177.
58. Hill WG (1981) Estimation of effective population size from data on linkage disequilibrium. Genet Res 38: 209-216. doi:10.1017/ S0016672300020553.
59. Waples RS (2006) A bias correction for estimates of effective population size based on linkage disequilibrium at unliked gene loci. Conserv Genet 7: 167-184. doi:10.1007/s10592-005-9100-y.
60. Waples RS, Do C (2010) Linkage disequilibrium estimates of contemporary Ne using highly variable genetic markers: a largely untapped resource for applied conservation and evolution. Evol Appl 3: 244-262. doi:10.1111/j.1752-4571.2009.00104.x.
61. Avise JC, Selander RK (1972) Evolutionary genetics of cave-dwelling fishes of the genus Astyanax. Evolution 26: 1-19. doi:10.2307/2406978. 62. Hinaux H, Poulain J, Da Silva C, Noirot C, Jeffery WR et al. (2013) De novo sequencing of Astyanax mexicanus surface fish and Pachón cavefish transcriptomes reveals enrichment of mutation in cavefish putative eye genes. PLOS ONE 8(1): e53553. doi:10.1371/ journal.pone.0053553. PubMed: 23326453.
63. Slatkin M (2008) Linkage disequilibrium – understanding the evolutionary past and mapping the medical future. Nat Rev Genet 9: 447-485. doi:10.1038/ni0508-447.
64. Primmer CR, Painter JN, Koskinen MT, Palo JU, Merilä J (2005) Factors affecting avian cross-species microsatellite amplification. J Avian Biol 36: 348-360. doi:10.1111/j.0908-8857.2005.03465.x. 65. Carreras-Carbonell J, Macpherson E, Pascual M (2008) Utility of
pairwise mtDNA genetic distances for predicting cross-species microsatellite amplification and polymorphism success in fishes. Conserv Genet 9: 181-190. doi:10.1007/s10592-007-9322-2.
66. Tallmon DA, Luikart G, Beaumont MA (2004) Comparative evaluation of a new effective population size estimator based on approximate Bayesian computation. Genetics 167: 977–988. doi:10.1534/genetics. 103.026146. PubMed: 15238546.
67. England PR, Luikart G, Waples RS (2010) Early detection of population fragmentation using linkage disequilibrium estimation of effective population size. Conserv Genet 11: 2425-2430. doi:10.1007/ s10592-010-0112-x.
68. Hale ML, Burg TM, Steeves TE (2012) Sampling for microsatellite-based population genetic studies: 25 to 30 individuals per population is enough to accurately estimate allele frequencies. PLOS ONE 7(9): e45170. doi:10.1371/journal.pone.0045170. PubMed: 22984627. 69. Hohenlohe PA, Bassham S, Etter PD, Stiffler N, Johnson EA et al.
(2010) Population genomics of parallel adaptation in threespine stickleback using sequenced RAD tags. PLOS Genet 6: e100086. PubMed: 20195501.
70. Kane TC, Culver DC, Mathieu J (1994) Biotic fluxes and gene flow. In: J GibertDL DanielopolJA Stanford. Groudwater Ecology. Academic Press. pp. 245-270.
71. Borowsky RL, Vidthayanon C (2001) Nucleotide diversity in populations of balitorid cave fishes from Thailand. Mol Ecol 10: 2799-2805. doi: 10.1046/j.1365-294X.2001.t01-1-01409.x. PubMed: 11903893. 72. Cobolli Sbordoni M, DeMatthaeis E, Mattocia M, Berti R, Sbordoni V
(1996) Genetic variability and differentiation of hypogean Cyprinid fishes from Somalia. J Zool Syst Evol Res 34: 75-84.