BAR, Rio de Janeiro, v. 13, n. 2, art. 3, e150164, Apr./June 2016
http://dx.doi.org/10.1590/1807-7692bar2016150164
Credit Rating Change and Capital Structure in Latin America
Dany Rogers1 Wesley Mendes-da-Silva2 Pablo Rogers1 Universidade Federal de Uberlândia1 Fundação Getulio Vargas2
Abstract
This study analyzes the impact of imminent reclassification of credit rating on the decision-making regarding capital structure of non-financial corporations listed in Latin America. Despite the importance attributed by the market agents and the existence of empirical evidence of the effect caused by rating in the capital structure of companies in developed countries, this issue is still incipient in Latin-American countries. For this purpose, all the non-financial corporation owners of, at least one corporate rating issued by an international rating agency were taken into account, with the requirement of being listed on a stock exchange in at least one Latin-American country. Through a data panel analysis comprising the period between 2001 and 2010 and by making use of the Generalized Method of Moments (GMM), the main results that were achieved did not indicate that non-financial corporations listed in Latin America, with imminent reclassification of ratings, adopt less debts than those without an imminent reclassification of their ratings. These findings suggest that the imminent reclassifications of credit ratings do not present important information for managers of non-financial corporations in Latin America when making decisions about capital structure.
Introduction
The credit rating reflects the credit quality of an issuer, being it business or governmental, or even an emission in particular, such as the sovereign bonds. These evaluations are usually performed by a specialized rating agency, which classifies the issuer (or emission) according to its probability of non-payment. Despite the agencies of ratings affirm they use multiple indicators for rating determination, there are authors (Amato & Furfine, 2004; Blume, Lim, & Mackinlay, 1998; Damasceno, Artes, & Minardi, 2008; Kamstra, Kennedy, & Suan, 2001; Kaplan & Urwitz, 1979) affirm that it is possible to perform the prediction of rating with efficacy, using internal data of own issuing firms and having as basis, models of credit scoring. In this way, the issuing companies are able to predict the rating emitted by agencies of ratings and consequently, the imminence of a future reclassification of this mentioned rating. These researchers showed that a reduced number of accounting variables may be sufficient to determine a corporate rating.
From the assumption that companies can predict the imminence of a reclassification of the rating issued by an agency, Kisgen (2006, 2009), using data from companies from the United States of America (USA), concluded that those with imminent reclassification of the credit rating tend to use fewer debts than companies without imminent of a reclassification. The authors Klein, Michelsen and Lampenius (2011), analyzing companies from Europe, Middle East, Africa and the USA found out that companies, in the imminence of reclassifications in the credit rating, emit 1.8% less of debts in the subsequent period, when compared to firms that are not near a reclassification. Alternatively, Rogers, Mendes-da-Silva, Neder and Silva (2013), in a study performed in companies in Latin America, conclude that managers of companies with imminence of reclassifications of the credit rating seem not to consider this information potentially relevant in the occasion of choosing their capital structures.
In this context, this research analyzes the impact caused by imminent reclassifications of the credit rating on the decisions of the capital structure of non-financial companies listed in Latin America, i.e.
whether these companies alter their capital structure when they have imminent reclassification of their credit rating, trying to avoid rating downgrades or to upgrade it.
This study contributes to the literature, by analysing a relevant and few explored issue, as Kisgen (2006) argues. Especially if considered that studies in the Latin American context are not found, with the exception of the recent work of Rogers et al. (2013). Additionally, in relation to this last study, the
recent research utilizes different methodological procedures and is fundamentally based on other theories of financial literature, in addition to a new proxy for indication for imminence of reclassifications of credit rating and the use of dependent variables that consider the variations of debts in the short and long term.
This work is structured in six sections, including the introduction. Second section presents the literature about associations between rating and choices of capital structure by the company. The third section details the theoretical and empirical arguments around the question of the corporate rating determination. Then fourth section presents the methodological procedures employed during development of this research. The results obtained are presented and discussed in fifth section. Finally, the sixth section brings the final considerations.
Credit Rating and Capital Structure
most important item analyzed by chief financial officers(CFOs) when determining the capital structure of the company.
The importance attributed by CFOs to credit ratings is justified because, among other reasons, the rating allows a greater access to international bonds market. In this context, Faulkender and Petersen (2006) examined, between the years of 1986 and 2000, in the North American market, if non-financial firms with access to the market of public debts have a greater financial leverage that firms without access. These authors (Faulkender & Petersen, 2006) used the fact that the company has or not a rating as proxy for access to the market of public debts (i.e. firms with ratingwere considered with access to
the market of public debts and firms without rating not). The results found suggest that firms with access to the market of public debts have a significantly greater leverage ratio from the companies that do not have access (28.40 % versus 17.90 per cent).
A similar study performed by Mittoo and Zhang (2008) points out that the Canadian firms, with access to the international market of debts, have leverage between seven and 11.60 percent greater than the firms without access. In the United Kingdom, Mateus and Amrit (2011), using a sample with 500 non-financial firms in the period of 1999 and 2006, found out that firms with ratingof long-term debts have double of leverage ratio when compared with the companies without ratings, being their results significant in economic and statistical terms.
In this respect, Valle (2002), while examining the relevance of the agencies of ratings in determination of acquisition cost of various resource borrowers in the capital markets in Brazil, Canada and the USA, found out evidences that there is difference in acquisition cost among the companies in the USA and Canada, classified as investment grade and speculative grade. The risk premium offered by companies that have captured resources, both in Canada and in the USA, were inferior to the companies in investment grade.
Despite several studies that analyze the relationship between credit rating and capital structure, the influence on the decisions of the capital structure due to imminence of reclassifications of credit ratings is still little studied, especially in Latin American institutional environment.
Kisgen (2006) analyzed the association between the credit rating and decisions on capital structure of North American enterprises assuming that the ratingis essential in decisions on capital structure due to the costs and benefits associated with the ratings(Hypothesis Credit Rating-Capital Structure, CR-CS). This hypothesis implies that firms on the imminence of a reclassification of the rating, either downgrades or upgrades, will tend to emit fewer debts, if compared to firms that are not on the imminence of a reclassification. To test the hypothesis CR-CS, Kisgen (2006) uses two tests with the adoption of two concepts of ratings grouping:
1. the concept of broad rating, which represents any levels of a particular rating, including their
modifiers + or -, the S&P and Fitch, or 1, 2 and 3 of Moody’s. From this concept it is made the POM test (test abbreviation for Plus or Minus), in which classifies companies for example, with the ratings emitted by agencies S&P or Fitch on the ratings BB+, BB- and BB, in a broad rating called BB, and companies classified by Moody’s on the ratings Ba1, Ba2 and Ba3 in a broad rating of Ba;
2. the concept of micro rating, which indicates the evaluation itself of the rating including all its numeric
modifiers for S&P and Fitch (+ or -) or numerals to Moody’s (1, 2 or 3). This means that BBB refers only to BBB and BBB+ and BBB- to only BBB+ and BBB-, respectively. By means of this concept, Kisgen (2006) presents the Credit Scoring teste, which will be applied in this study.
The procedure for carrying out the Credit Scoring test occurred as follows: (a) It was estimated an equation of scores, using data from its own sample, to evaluate the credit quality of companies within their respective micro ratings (i.e. how different two companies equally classified as BBB+ by S&P
companies in middle thirds would be with no imminence of a reclassification; (d) It was tested the hypothesis of research by means of a data structure in panel with regressions estimated by Ordinary Least Squares (OLS).
The main results found by Kisgen (2006) were that companies in the imminence of a reclassification of the rating, for both the broad rating and micro rating emit fewer debts than those with no imminence of a reclassification. Therefore, it can be noted that the ratingof credit directly affects the decisions of managers on capital structure, being these decisions affected by either potential upgrades or downgrades.
In another research, Kisgen (2009) sought to examine whether the managers take their decisions about capital structure considering a credit rating target. The results found were similar to those obtained in their study of 2006; however, the decisions were not symmetrical in relation to the types of reclassifications (upgrades or downgrades). A peculiar result was that a downgrade affects manager’s behaviour in relation to the leverage composition, allowing a partial adjustment toward the level of leverage target, being this adjustment significantly faster than in other firms. Moreover, a downgradeis a better predictor of capital structure behaviour than leverage changes, profitability or z-score.
Klein et al. (2011), using the S&P rating outlook and Credit Watch as proxies for reclassification
imminence of ratingalso sought to analyze the relationship between the imminence of reclassifications of ratingand capital structure. For them (Klein, Michelsen, & Lampenius, 2011), firms with positive or negative outlook emit fewer debts than firms with stable outlook, indicating that companies, in the imminence of reclassification of rating emit around two per cent less of debts of that firms that are not on the imminence of a reclassification.
Meng, Bonerjee and Hung (2011) analyzed if emitters use privileged information to anticipate reclassifications of rating and from this, perform corrections on its capital structure before public announcement of rating. This study was carried out in companies in the USA and Canada involving more than 30,000 open capital firms, both active and inactive, between the first quarter of 1985 and the second quarter of 2007. These authors conclude that the emitters increase the level of leverage anticipating future upgrades, but they do in a lesser degree as a response to future downgrades. On average, the leverage of firms increases by 4.5% in the previous quarter for upgrades and 3.1% for downgrades.
Already Rogers et al. (2013), in a research performed in non-financial companies in Latin
America, suggest that the reclassifications of ratings do not have the informational content for the decisions of the capital structure. However, some results indicated that companies with worse quality credit and on the verge of reclassifications of rating tend to use more debts that other companies, suggesting the existence of market timing.
Determination of
Corporate Rating
Many studies have suggested a relationship between rating and financial variables (Amato & Furfine, 2004; Blume et al., 1998; Damasceno et al., 2008; Kamstra et al., 2001; Kaplan & Urwitz,
1979), contradicting the ratings agencies which affirm to use several indicators in determination of a corporate rating. The first studies that employed accounting and financial data for the determination of a corporate rating (either emission or emitter) are from the 1960s, in the USA. Kaplan and Urwitz (1979) found that the financial leverage and the size bond emission presented with high statistical significance when determining a rating. Complementing these variables with a dummyfor the subordination status of debt and the beta market of the issuing company, these authors (Kaplan & Urwitz, 1979) managed the correct measurement of the ratingin two thirds of a sample of test with new bonds emissions.
degree of investment in the period 1978 to 1995. In this model, the behaviour tendency of the regression intercepts over time was interpreted as an indicator of tightening or not the evaluations. Using probit model ordered in panel, they found a positive relationship between the interest coverage, operational margin and relation of total debt with the total asset and the rating, and a negative relationship between long-term debt on total asset and the rating.
Kamstra, Kennedy and Suan (2001) found that the statusof subordination of the debt (negative), total assets (positive), index of total debt (negative) and the return of assets (positive) were statistically significant in all the statistical methods used to predict the rating. In addition, using ratings datafrom emitters of S&P from 1981 to 2001, Amato and Furfine (2004), found a negative and statistically significant relation between the ratingand the index of interest coverage, the operational margin and the total debts, and a positive and statistically significant correlation with the long-term debts.
In the national scenario, Damasceno, Artes and Minardi (2008) sought to develop a methodology for ratingthat would be able to predict the level of ratingof companies that did not have any evaluation. According to these authors (Damasceno et al., 2008), the variables of return on asset (ROA) with a
negative relation to rating, the total debt (positive) and a dummy indicating the presence in the São Paulo Stock Exchange index were the ones that, jointly, best explained the ratingsin the proposed model. This model was able to hit 64.10 percent of the ratingsof the sample, and 24.20 per cent were classified at a level above or at a level below the scale of ratings.
These studies show that, essentially, variables related to indicators of financial cover, capital structure, profitability and size can predict satisfactorily the ratingsissued for companies by agencies of ratings. Therefore, the ratingdetermined by a company itself, with the use of these variables, can be used as a forecast of possible reclassifications of ratingsof the specialised agencies.
Methodology
This section details the procedures adopted for the development of the research. The historical data of ratings was collected between 2001 and 2010. The data set was composed of 87 companies, being they: eight from Argentina, thirty-nine from Brazil, fourteen from Chile, twenty-four from Mexico, one from Peru and one from Venezuela. This survey considers all non-financial companies listed in Latin America with at least one domestic rating of long term rating assigned by S&P, Moody’s or Fitch, in January 2010.
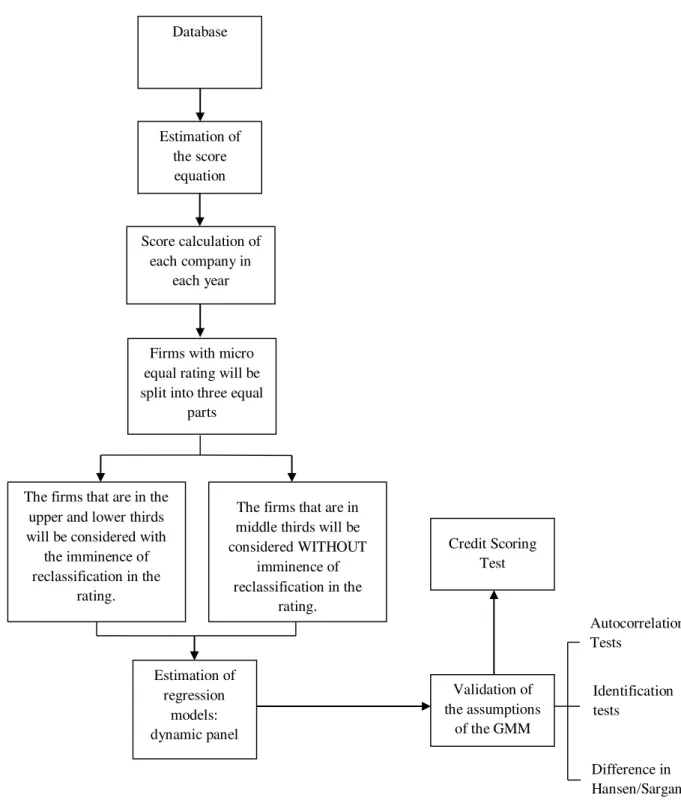
Figure 1. Analysis Flow of the Research Data
The study was progressed from regressions of panel data unbalanced, with 598 observations for the period of 2001 and 2010, because there was no data for all enterprises in the entire period considered in the study. The database was divided in two groups: (a) aggregate set of companies, which represents the total base of data of businesses studied in the research; (b) restricted database, which is the set of data of the enterprises, excluded observations in which the percentage for variation of indebtedness from a period to another, such as percentage of total assets, was superior to 10%. This percentage is justified since it is important to consider the influence of relevant changes in debts from one period to another, once these changes can be reflexes of mergers, acquisitions, reorganizations or changes in management, meaning in this context that the reclassification of the rating credit may not be significant (Kisgen, 2006).
Estimation of the score equation
Score calculation of each company in
each year
Firms with micro equal ratingwill be split into three equal
parts
The firms that are in the upper and lower thirds will be considered with
the imminence of reclassification in the
rating.
The firms that are in middle thirds will be considered WITHOUT
imminence of reclassification in the
rating.
Estimation of regression
models: dynamic panel
Validation of the assumptions
of the GMM
Autocorrelation Tests
Identification tests
Difference in Hansen/Sargan Database
Model of the credit scoring
The present research only performs the Credit Scoring Test as presented in second section, similarly to Kisgen (2006); the first step consists in estimating the equation of score. Therefore, for this
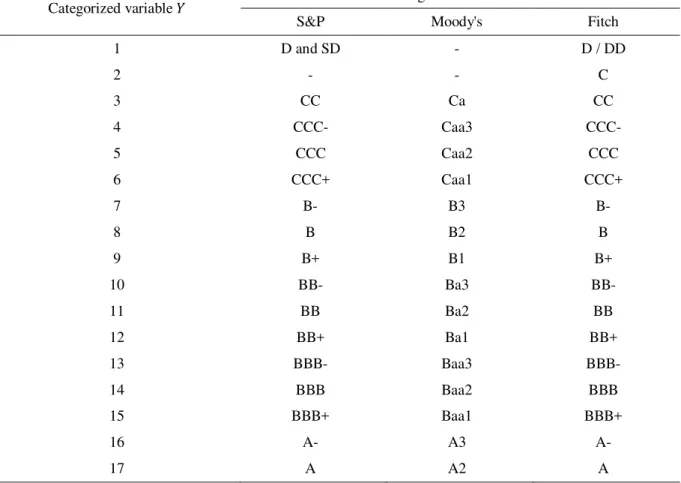
measurement, it is used as dependent variable the classification of the ratings agencies, being an ordinal variable. The encoding of the dependent variable is equal to 1 for the lowest ratings, D/SD at S&P and D at Fitch; equal to 2 for CC ratings at Fitch and S&P and Ca at Moody’s; and successively until the rating A of S&P and Fitch and A2 of Moody’s, which are the last levels of ratingsfrom the database. Table 1 presents the equivalence between the categorical variable � and their respective levels of ratings of the scales adopted by the agencies S&P, Moody’s and Fitch.
Table 1
Categorized Variable � (From the RatingsLevels of the Agencies S&P, Moody’s and Fitch)
Categorized variable � International agencies of risk classification
S&P Moody's Fitch
1 D and SD - D / DD
2 - - C
3 CC Ca CC
4 CCC- Caa3 CCC-
5 CCC Caa2 CCC
6 CCC+ Caa1 CCC+
7 B- B3 B-
8 B B2 B
9 B+ B1 B+
10 BB- Ba3 BB-
11 BB Ba2 BB
12 BB+ Ba1 BB+
13 BBB- Baa3 BBB-
14 BBB Baa2 BBB
15 BBB+ Baa1 BBB+
16 A- A3 A-
17 A A2 A
Note.The ratingswere converted to numeric values, thus obtaining an ordinal variable that can be ordered. The ordering
adopted in the survey is decreasing in relation to the rating, thus, the better the rating level, the greater is the scale of numeric conversion and at the worst rating levelis the smallest scale value.
For the estimation of the equation of the score, it is used multiple regression with the method of OLS, added to employment of accounting data of the own firms participating in the study. And from this equation, it is measured a score for each firm in each year. Furthermore, the database can be considered small to have good estimates through a logit model ordered, once 15 equations would be results from the application of this technique.
was used in the development of the model as defend by Thomas, Eldman and Crook (2002). Moreover, the Table 2 presents the independent variables for measurement of the score equation.
The equation of score is formalized in according to (1):
it
= +
0CJ
it +
1DT
it +
2it
AT DLP
+
3it
PL DLP
+
4ROA
it +
5MO
it+
6EBITDA
it +
7ATIVO
it +
8 � +
9 �� +
10+
(1)
In which �� is the dependent variable that represents the classification of the rating of the company issued by a specialised agency, as demonstrated in Table 1; � , � , �
� ��,
�
� ��, � ,
� , � , � � are the independent variables such as described in Table 2; � represents the set of dummies variables of year; �� the dummy variable of country; it is a dummy variable of the sector;
i, set as � =0,...,10 the parameters and
the term of error.Table 2
Independent Variables to Estimate the Equation of Scores: Construction of the Micro Rating
Category Name Operational Definition Expected Relationship
Conceptual definition
Financial Coverage Indicators
Interest coverage = EBIT / Financial expense
Positive Blume et al. (1998)
Capital
Structure Total debt / Total Asset Negative/ Positive Blume (2001); Damasceno et al. (1998); Kamstra et al. (2008) et al.
/
Noncurrent Liability / Total Asset
Negative /Positive
Kaplan and Urwitz (1979); Blume
et al. (1998); Amato and Furfine
(2004) / Noncurrent Liability / Net
Worth Negative Kaplan and Urwitz (1979) Profitability Return on Asset =
Net profit / Total Asset
Negative/ Positive
Kaplan and Urwitz (1979); Kamstra et al. (2001); Damasceno et al. (2008)
Operating margin = EBIT / Net Revenue
Positive/ Negative
Blume et al. (1998); Amato and
Furfine (2004)
EBITDA / Total Asset Positive Kisgen (2006) Size � Ln (Total Asset) Positive Kisgen (2006)
Note.The expected relationship indicates the expected outcome of each variable in relation to the credit rating, the is
equal to the Profit Before Interest and Taxes, the is equal to the Profit Before Interest, Taxes, depreciation and amortization, and the total debt is the sum of the current liability plus the noncurrent liability.
Dependent and independent variables
To measure the change in the structure of the capital of a company, Klein et al. (2011) use data
of patrimonial balance sheet, different from Kisgen (2006), which adopts the concept of debts market debts. However, as pointed Klein et al. (2011), their results are qualitatively identical in both approaches.
Thus, due to the lack of liquidity in the market of bonds from Latin America, the corporate debt in the research in question will be measured by its accounting values such as Klein et al. (2011), Booth,
Aivazian, Demirguc-Kunt and Maksimovic (2001) and Bastos, Nakamura and Basso (2009). On this line, the dependent variables that will be used as proxy, for measurement of the change in the structure of the capital of �-ith firm, are represented by the variation in the accounting indebtedness in a period � + for a period �.
The first variable represents the variation in long-term indebtedness of the firm from a period to other, being measured by the value of net long-term debts of its equity as a percentage of the total assets. This index is named � , formalized in (2).
� = ∆ � − ∆ �
�
(2)
In that
. ∆ � = noncurrent liability of the firm � in time � + less noncurrent liability of the firm � in time �.
. ∆ � = equity accounting value of the shareholders of the company � in time � + less the equity accounting value of the shareholders of the company � in time �.
. � = total assets of the firm � in time �.
The second indicator represents the variation in short-term indebtedness of the firm from a period to another, and it is measured by the equity short-term debts net value as percentage of the total assets. This index is named � , formalized in (3).
� = ∆ � − ∆ �
�
(3)
And
. ∆ � Rolling stock of firm callable = � in time � + less chargeable rolling stock of name � in time �.
And the third dependent variable in the study represents the variation in total indebtedness of the company from one period to another being calculated by the total equity net accounting debts value as a percentage of the total assets ( � ), formalized (4).
� = ∆ � − ∆ �
�
(4)
In that
. ∆ � = total liability (i.e. Sum of noncurrent liability and current liability) of firm � in time � + less
total liability of firm � in time �.
. Micro rating greater than (MRS p): dummy equal to one for firms that are in the upper thirds of your micro rating in relation to the score calculated for all companies of micro similar, and zero rating for the other undertakings. It is expected a negative relation between MRS p and the dependent variables (Kisgen, 2006).
. Micro rating less than (MRInf): dummy equal to one for firms that were in the lower thirds of their micro rating in relation to the score calculated for all companies of similar micro rating, and zero for the other companies. It is expected that firms classified in the lower thirds use fewer debts than other companies (Kisgen, 2006).
. Micro Upper or lower rating (MRSI): dummy equal to one for firms that were in the upper or lower thirds of their micro rating in relation to the score calculated for all companies of similar micro rating, and zero for the other companies. It is expected that firms classified in these situations use fewer debts than other companies (Kisgen, 2006).
Although the financial literature highlights different determinants of capital structure, the study in question adopts only the determinants that can control the financial conditions of the firms, with the aim of identifying the effects of the credit rating different of any effects of a financial crisis, as defends Kisgen (2006, 2009). Thus, the variables of control ( � ) which are used in the regression equations are the following:
. Leverage index ( �� ): division of noncurrent liability firm � in time � − ( �, − ) by the sum of the noncurrent liability plus the accounting equity of the firm � in time � − ( �, − ). It is expected a negative relation with the dependent variables (Kisgen, 2006).
. Profitability ( � : division of the firm EBITDA � in time � − by the total of assets of the beginning of the year of the firm � in time � − ( �, − ). It is expected that the profitability has a negative relation with the indebtedness (Bastos, Nakamura, & Basso, 2009; Booth, Aivazian, Demirguc-Kunt, & Maksimovic, 2001).
. Size of firm (� � : the natural logarithm of the firm sales � in time � − . The positive relationship between the size of the company and the levels of indebtedness is evidenced in Kisgen (2006).
Strategy of identification and hypothesis
It is important to emphasize that the econometric specification of this research is based on the assumption that the current debt tends to perpetuate and/or influence the performance levels of indebtedness in the future, i.e. an inertial behaviour of the debt indicators. This supposition can be
proven by various theories of capital structure that suggest the existence of a great financing structure for each company (Fama & French, 2002; Frank & Goyal, 2003). In this way, it is justified dynamic models of panel data that include one or more lagged values of the dependent variable.
However, one of the problems with the estimation of dynamic models with data in panel is the existing correlation between the regressor Yi, − and the term of disturbance εi, via αi, i.e. the
endogeneity of variable Yi, − . The explanatory variables can be classified as endogenous if they are correlated with the terms of past errors, present and future; weakly exogenous (or pre-determined) if are correlated only with the past values of the error term; and strictly exogenous if are not correlated with the past error terms, present and future (Cameron & Trived, 2009). The principal causes of endogeneity are: variables omitted, errors of measurement and simultaneity (or reverse causality).
structure, as referenced by Graham and Harvey (2001) and Bancel and Mittoo (2004), and that firms that have ratingsissued by specialized agencies tend to have a greater leverage than firms that do not have these ratings(Faulkender & Petersen, 2006; Mittoo & Zhang, 2008). However, at the same time, the financial leverage is essential for risk measurement of a company, representing an important item in the process of assigning a rating, as exposed in management reports of the agencies of ratings themselves and in several researches that study the determinants of a corporate rating (Amato & Furfine, 2004; Blume et al.,1998; Damasceno et al.,2008; Kamstra et al.,2001; Kaplan & Urwitz, 1979). From this,
it is possible that the relationship between indebtedness and ratingpresents the problem of simultaneity, once the ratingis understood as an important determinant of the level of indebtedness of a firm, as well as the financial leverage that is also important in the process of assigning a rating.
On this issue, Aurellano and Bond (1991) propose the estimator of the GMM in Differences (GMM-Dif). However, Aurellano and Bover (1995) and Blundell and Bond (1998) argue that the instruments used in estimation GMM-Dif are weak when the dependent and explanatory variables present strong persistence and/or relative variance of fixed effect, thus producing an estimator not consistent and skewed for panels with small temporal dimension. In this way, these authors (Aurellano & Bover, 1995; Blundell & Bond, 1998)suggest the GMM systemic (GMM-SIS) as a way to reduce this problem of simultaneity. To check the validity of the assumptions of this estimator it will be used in this research the following procedures: (a) autocorrelation tests of first - AIR(1) and second order - AIR(2), which aim is to verify if the errors are not autocorrelated; (b) tests of identification restrictions from Hansen/Sargan to check the condition of exogeneity of the instruments (i.e. validity of the
instruments); (c) test of difference from Hansen/Sargan, which objective is to analyze the validity of the additional conditions adopted by the GMM-sis in relation to the GMM-Dif (Aurellano & Bond, 1991; Baum, Schaffer, & Stillman, 2003).
The econometric technique employed, along with the most appropriate estimator, is based on the following research hypothesis:
The research hypothesis: The non-financial companies listed in Latin America that are with imminence of a reclassification of the rating (either downgrade or upgrade) use less debts, on average, in relation to their equity, than companies that are without the imminence of a reclassification in the rating.
This hypothesis is based on Kisgen (2006) for those companies, in the imminence of a reclassification of the rating, have greater propensity for reduction in leverage, if compared to companies that are not on the imminence of a reclassification. Additionally, from arguments of Klein et al. (2011),
which found out results that suggest that firms in the imminence of reclassification of ratingemit around two per cent less debts than firms without the imminence of a reclassification. Among other impacts, downgradesfor a company: (a) increase its capital cost; (b) reduce the opportunities for investment and financing; (c) increase distrust of the investor on the financial solvency of the issuer. On the other hand, upgrades have opposite effect. Thus, similar results can be expected for other countries and regions, considering that, regardless of the manager of a company, the country in which the company is located, industry and/or environmental situations in which the company operates, they will always have to avoid downgrades and achieve upgrades.
To test the Research hypothesis, it will be estimated the following empirical models:
� = + �, − + � � ��� � �+ � + �� (5)
� = + �, − + � � ��� � �+ � � ��� ����+
� + ��
(6)
� = + �, − + � � ��� ��+ �� (7)
variables; �, − , �, − and �, − are shifted dependent variables in a period; � � ��� � �, � � ��� � � and � � ��� ���� are the variables of micro ratings described in subsection Dependent and independent variables; � represents all the control variables of the equations discussed in subsection Dependent and independent variables; �, being �, =0,...,4, the parameters; and. �� the idiosyncratic term of error.
Results
This section aimed to present and discuss the estimation results of empirical models. In the first part, it was made an analysis of the behaviour of the database. In the next step, it was measured the equation of score, this being calculated and used to classify the companies into the database within the same micro ratingin three equal parts. After this, it was verified the existence of associations between the imminence of reclassifications of the credit rating and the decisions about capital structure, together with the discussion of these findings in the light of the financial literature.
Characterization of the studied companies
The database was populated by 87 companies distributed in six countries of Latin America, for a total of 598 observations between 2001 and 2010. After the calculations and analyzes of the variables used in the search, we opted for the exclusion of a single observation of Telenorte company from the year of 2009, because it presented a variation in the indebtedness of 1,350%, while the average of businesses studied was of 8%. In line with the objective of the study the statistics that describe the relationship between debt and the ratings become important, and by Table 3, it is possible to check that, in a prevalent way, the average of financial leverage appears to increase when the ratingsbecome more risky (i.e. from A to CCC+). A similar phenomenon occurs with the standard deviation of financial
leverage, which becomes greater with the elevation of the risk. This indicates the level debts use of the
companies from the database may be associated with the credit rating.
Table 3
Summary of Descriptive Statistics of the Relationship between the Leverage and the Levels of Ratingsfrom the Database
Scales of ratings classifications Quantity of
Financial leverage(%)
Minimum Average Maximum Deviation Standard
A 15 25.96 42.90 68.13 12.13
A- 39 14.49 35.42 68.44 13.45
BBB+ 66 10.71 36.28 57.33 10.32
BBB 44 23.14 39.37 58.94 8.82
BBB- 103 11.82 37.48 67.64 11.34
BB+ 35 11.83 40.78 76.73 15.88
Table 3 (continued)
Scales of ratings classifications Quantity of
Financial leverage(%)
Minimum Average Maximum Deviation Standard
BB 72 11.56 42.87 93.13 17.71
BB- 70 4.55 44.69 84.76 18.71
B+ 41 0.00 42.96 92.24 19.16
B 31 14.69 44.61 79.11 11.88
B- 28 5.93 47.38 70.41 13.00
CCC+ or below 53 0.53 45.86 169.34 29.75
Total 597 41.13 16.64
Note. The financial leverage was measured by the division of the noncurrent liability of the firm � in time � − by the sum of
the noncurrent liability plus the accounting equity of the firm � in time . � − .
Estimation of the score equation
It is important to highlight that, in the estimation of the score equation, it was not used no method of selection of variables, such as the stepwise, but were included, simultaneously, all independent variables available, such as formalized in the equation (1). The statistics of adjustments proved to be suitable, given the objective of the model is only the prediction of rating, and the promising statistics of adequacy of the model: the variance inflation factor (VIF) of each variable was less than 10, thereby enabling to discard any problem related to the multicollinearity; the model was significant, as proved by the statistic (50.29) of joint significance of the coefficients; the Kolmogorov-Smirnov (KS) test of normality of the residues did not reject the hypothesis that they come from a normal distribution, improving so the conclusions of the tests � of the coefficients and the tests of joint significance (dummies and model).
And, despite the problems related to heteroscedasticity and autocorrelation are not as harmful when the objective is the prediction, for inferences of the coefficients it was estimated the standard robust errors to heteroscedasticity and the autocorrelation. To reach the model, it was necessary to exclude eight observations, in view that, after the estimation with all observations available (N = 557), it was evidenced that some observations had standardized residue greater than |3|. With this procedure, it was possible to improve the adjustment of the final model resulting in none outliers (N = 549), although they have been used, subsequently, to the construction of the variables � � ��� � �, � � ��� ���� and � � ��� ��. Moreover, the score equation for the construction of the variables of the micro rating was presented as exposed in Table 4.
As seen in Table 4, the variables , / and had no statistical significance. However, in relation to the variables / and , their influences can be captured by the variables and , which were significant in the resulting model. The variable (negative) was presented with the expected coefficient as Kamstra et al. (2001), / with the positive coefficient and negative,
Table 4
Score Equation for Construction of the Micro Rating
Independent variables and fitof
the model Expected signal
Dependent variable: Rating Equation (1) VIF
Constant -7.13***
(2.48) -
+ 0.01
(0.01) 1.26
- / + -7.46***
(1.55) 2.22
/ - / + 3.86***
(1.30) 2.33
/ - 0.27
(0.19) 2.04
- / + 0.07
(2.56) 2.49
- / + -3.22**
(1.29) 1.72
+ 15.23***
(2.46) 2.91
� + 1.00***
(0.11) 1.64
-6.91
(4.94)*** 1.87
3.15
(99.94)*** 1.81 -17.83
(9.30)*** 2.98
Comments 549
>0.60 0.73
Adj. >0.60 0.71
>0.60 0.85
Sig. 50.29***
Not Sig. 1.00
Note. For the set of variables below of the coefficients, are presented, between parentheses, the standard robust errors to
heteroscedasticity and the autocorrelation algorithm, as Newey-West and *, **, ***, which represent the statistical significance of the estimate in the levels of 10%, 5% and 1%, respectively. The variables , � and are dummies which by simplification, were only presented the sum of the coefficients and, in parentheses, below this sum, the statistic from the joint significance dummies testof each variable. The column VIF presents the inflation factor of variance for each variable, and refers to the Kolmogorov-Smirnov normality test of the residues.
joint significance of the coefficients, i.e. the test dummies together with the aim of checking whether
the model with them is better than the model without dummiesproved to be significant. In this way, it is possible to indicate that the model is correctly specified to include the dummies, because they were
as a conjunction significant.
With the equation of score measured, each micro rating from the database was split in three parts and, after the categorization of companies, two observations were excluded, because within two microns ratings, there was only one observation on each one of them, thus remaining 557 observations for the credit scoring test. From these, 184 observations were classified in the upper thirds of its respective micro ratingand 182 observations in the lower thirds. This means that 366 observations would be with the imminence of a reclassification of rating and 191 would be without the imminence of reclassification.
The relation between the credit rating and debts
The study in question examined three empirical models for two different groupings of companies (i.e. total database and restricted database), with three dependent variables; this way, obtained a total of
18 specifications as product of the three empirical models. Table 5 presents all these 18 specifications, and it is worth mentioning that it was chose not to analyze any specifications in which one of the tests of the validity of the GMM indicate violation of assumptions or that the test was not significant.
Table 5
Specifications of Empirical Models Tested in the Study
Dependent variable
Empirical model (equation)
Total Database Restricted Database
� 5 + �, − + �+ �
+ ��
+ �, − + �+ �
+ ��
6 + �, − ++ ����+ �
+ ��
+ �, − + �
+ ���+ �
+ ��
7 + �, − + �+ �� + �, − + �+ ��
� 5 + �, − + �+ �
+ �� + �, − ++ �� �+ �
6 + �, − ++ ����+ �
+ ��
+ �, − + �
+ ���+ �
+ ��
7 + �, − + �+ �� + �, − + �+ ��
� 5 + �, − + �+ �
+ �� + �, − ++ �� �+ �
6 + �, − ++ ����+ �
+ ��
+ �, − + �
+ ���+ �
+ ��
7 + �, − + �+ �� + �, − + �+ ��
Note. The dependent variables represent the variation in the accounting indebtedness in a period � + for a period �; �, −
are lagged dependent variables in a period; �, � ���are the variables of micro ratingsdescribed in subsection
Dependent and independent variables; and � are the variables of control ALAVi, and RENTiVENDi presented in subsection
Dependent and independent variables.
assumptions or because the test was not significant. Moreover, in Table 6, are only the signs of the coefficients and statistical significance levels of 15 specifications.
The dependent lagged variable ( �, − ) presented in 7 of the 15 specifications with the signs of negative coefficients and, in four of them, with different levels of statistical significance. In the other 8 specifications, the coefficients of this variable were positive, and in two of them, presented statistical significance. These coefficients prevailed as positive for the total database and as negative for the restricted database. In this way, in line with the theories of capital structure that indicate the existence of a great structure (Fama & French, 2002; Frank & Goyal, 2003), some results obtained indicate that the past values of the debts influence in their current levels of debt, prevailing a positive effect for the total database and a negative effect for the restricted database.
The variable ALAV presented with the signs of the coefficients is consistent with the financial literature, essentially Kisgen (2006), in all 10 present specifications, however, only in two of them with statistical significance. The variable RENT did not present only the signal of the negative coefficient, as expected, in one of the 10 specifications: this variable was with the negative coefficient and with differentiated levels of statistical significance in two specifications. In relation to the variable VEND, it is observed that, in all 10 specifications in which was present, their coefficients were positive as expected and, in six of them, with different levels of statistical significance. These results showed that only the variable VEND was presented in most of the specifications with statistical significance, in line well with Kisgen (2006). In addition, the estimates of control variables are more consistent with the financial literature for the restricted database.
The main results obtained for the micro rating were:
. The signals of the coefficients were positive for � � ��� � � in four of five specifications, however, without statistical significance at any one of the five specifications;
Signs of the Coefficients and Statistical Significance of the Explanatory Variables of Empirical Models (5), (6) and (7)
Panel A - Total database
Independent variables
� �
Equation (5) Equation (6) Equation (7) Equation (5) Equation (5) Equation (6) Equation (7)
�, − - + + + -* +** +* +
� � Rating � - + -
� � Rating��� - -** -*
� � Rating � - + - -* - -**
� - - - -
- - - -** - -
� + +* + + + +
Panel B - Restricted Database
Independent variables
� � �
Equation (5) Equation (6) Equation (7) Equation (6) Equation (7) Equation (5) Equation (6) Equation (7)
�, − - + + - -*** - -* -* -
� � Rating � - + + +
� � Rating��� - - + +
� � Rating � - + + + + -
� - -** -* - - -
- + - -* - -
+ +** +* +** +*** +**
Note.On the panel A, it has the total database that represents the full data set of companies and, in panel B, the restricted database that represents the data set of companies without the observations
in which the indebtedness variation as a percentage of the total assets was higher than 10%.
. For � � ��� ��, in the total database, prevailed the negative coefficients and in two specifications with differentiated levels of statistical significance. Already on the restricted database prevailed the coefficients positive and statistically not significant.
In this way, it is possible to check that the coefficients of micro rating were negative and statistically significant in four specifications of the total database. However, for the restricted database, there was no statistical significance considering all specification. In view of that, some results obtained for the micro ratings were statistically significant only for the total database; it needs more attention in
the evaluation of these findings. It is possible that they have been influenced by the companies that have had significant modifications of debts from one year to another, as defended by Kisgen (2006). This is because Kisgen (2006) proposes the use of a group of companies in which those who presented an indebtedness variation from a period to other as a percentage of the total assets exceeding 5% to 10% were excluded, and also to affirm that in extreme levels of emission of debts, practically all companies expect a downgrade.
In any event, the main results obtained by the Credit Scoring Testdid not permit suggest that non-financial companies listed in Latin America with the imminence of a reclassification of rating use less debts, to any levels of indebtedness (i.e. short term, long term or total indebtedness), than the companies
without the imminence of a reclassification of rating, thus rejecting the Research Hypothesis. Opposite to the studies presented in the research in question, in which were demonstrated signs that the ratingand their reclassifications influence and are influenced by the capital structure of a company. Graham and Harvey (2001) found out that the ratingis the second most important item analyzed by CFOs from North American companies when the determination of its capital structure. Faulkender and Petersen (2006) found out that North American companies with a credit rating have a leverage ratio significantly higher than firms without rating. Mittoo and Zhang (2008), in Canadian companies, and Mateus and Amrit (2011), in the United Kingdom, found out similar results to Faulkender and Petersen (2006) ones.
These results are opposed to the studies of Kisgen (2006, 2009) and Klein et al. (2011), which
indicated that there is a statistically significant association between the imminences of reclassifications of the credit rating and the decisions about the capital structure of a firm, i.e. that companies with the
imminence of reclassifications of rating use less debts that companies without the imminence of a reclassification. Kisgen (2006) found statistically significant results, both using the concept of micro rating, as the concept of broad rating. However, the results of the study in question that indicate that the
imminences of reclassifications of ratings do not influence on the decisions of the capital structure of non-financial companies listed in Latin America are in line with Rogers et al. (2013), who found, using
the concept of broad rating, a lack of association between imminence of reclassifications of the credit rating and decisions about the capital structure in non-financial companies listed in Latin America.
Final Considerations
This study used as base the idea proposed by Kisgen (2006) that the managers give special attention to the benefits and/or costs of reclassifications of ratingof their companies in two aspects: (a) with reclassifications among wider categories of consolidated rating in letter (broad rating); (b) with any other types of reclassifications of rating(micro rating).
By means of the concept of micro rating, some results obtained in this study for the total database
showed to be with the negative coefficients and statistically significant, however, these same results not prevailed for the restricted database. This indicates that the results for the total database may have been influenced by the companies that have had major modifications of debts. In any event, the main results obtained do not suggest that non-financial companies listed in Latin America with the imminence of reclassifications of ratinguse less debts than companies without the imminence of a reclassification, thus contradicting Kisgen (2006, 2009) and Klein et al. (2011), and in line with Rogers et al. (2013),
that the imminences of reclassifications inratingsdo not present important information for the managers of non-financial companies in Latin America in relation to the decision-making about the capital structure.
It is possible that the results obtained in the study in question, unlike Kisgen (2006), who had a sample with 12.336 observations, may have been influenced by the size of the database, since this quantity, along with the methodological procedures used in the research in question, would require that the differences between the companies were with greater magnitude for the existence of a statistical relevance and practice. However, it is important to emphasize that this limitation of the study was due to own restriction in the quantity of emissions of ratingsmade by international agencies for companies in Latin America, which do not permit greater efforts of the authors to increase the database.
Another limitation of the study is that it assumes that the countries of Latin America have, in essence, similar characteristics in relation to their institutional environments. However, the study in companies in Latin America is justified in view that the relationship of the credit rating with the capital structure exists independently of the country and/or region, or of the economic sector of the company, as it was found in the studies of Graham and Harvey (2001), Bancel and Mittoo (2004) and Faulkender and Petersen (2006). In addition, this relationship is characterized, predominantly, being an inner relationship of company instead of a decision influenced by external environment. In addition to these limitations, it is emphasized the exclusive use of non-financial companies listed on stock exchanges in Latin America with the credit ratings issued by agencies S&P, Moody’s and Ficth, in that the arguments are justified in the availability and reliability of its financial statements and similarities of their capital structures.
Despite the limitations, before the results presented, this study is important and shows applicability in the business environment by influencing the principal users of the ratingsas follows: (a) if the rating can be used by insiders, holders of best information, to reduce the return on capital of investor, this study becomes relevant, because it enables the investor a more critical and conservative vision about the true role of rating as indicative of risk for the measurement of the return from his investment; (b) for financial intermediaries, by anticipating a reclassification of the rating of a issuer, it is possible the inclusion of this variable in the evaluation process of the credit risk of the holder, consequently, the determination of a fairer spread when granting loans; (c) advanced notice of the reclassification of the ratingenables issuers to amend their levels of debt in order to reduce its probability of downgrades, or even increase their chance of upgrades in the future.
As indications for future researches, it is suggested: (a) to increase the quantity of observations of emissions of ratingsby use of emissions of a greater number of specialized agencies of ratings; (b) to use a sample period of greater magnitude to decrease the effects of possible economic cycles and crises; (c) to make a comparative analysis with the use of methodological procedures and similar sampling periods, between countries of Latin America and the developed countries; (d) to analyze the association between the decisions about the capital structure and the imminences for reclassifications of ratings considering the following groupings of ratings: investment grade and speculative grade, separately.
References
Amato, J. D., & Furfine, C. H. (2004). Are credit ratings procyclical? Journal of Banking & Finance, 28(11), 2641-2677. doi: 10.1016/j.jbankfin.2004.06.005
Aurellano, M., & Bond, S. (1991). Some test of specification for panel data: Monte Carlo evidence and an application to employment equations. Review of Economics Studies, 58(2), 277-297. doi:
0034-6527/91/00180277$02.00
Bancel, F., & Mittoo, U. R. (2004). Cross-country determinants of capital structure choice: a survey of European firms. Financial Management, 33(4), 103-132. Retrieved from
http://www.jstor.org/stable/3666330
Bastos, D. D., Nakamura, W. T., & Basso, L. F. C. (2009). Determinantes da estrutura de capital das companhias abertas na América Latina: um estudo empírico considerando fatores macroeconômicos e institucionais. Revista de Administração Mackenzie, 10(6), 47-77. doi:
10.1590/S1678-69712009000600005
Baum, C. F., Schaffer, M. E., & Stillman, S. (2003). Instrumental variables and GMM: estimation and testing. The Stata Journal, 3(1) 1-31. Retrieved from
http://www.stata-journal.com/sjpdf.html?articlenum=st0030
Blume, M. E., Lim, F., & Mackinlay, C. (1998). The declining credit quality of US corporate debt: myth or reality? The Journal of Finance, 53(4), 1389-1413. doi: 10.1111/0022-1082.00057
Blundell, R., & Bond, S. (1998). Initial conditions and moment restrictions in dynamic panel data models. Journal of Econometrics, 87(1), 115-143. doi: 10.1016/S0304-4076(98)00009-8
Booth, L., Aivazian, V., Demirguc-Kunt, A., & Maksimovic, V. (2001). Capital structures in developing countries. The Journal of Finance, 56(1), 87-130. doi: 10.1111/0022-1082.00320
Cameron, A. C., & Trivedi, P. K. (2009). Microeconometrics using stata. Texas: Stata Press.
Damasceno, L. D., Artes, R., & Minardi, A. M. A. F. (2008). Determinação de rating de crédito de empresas brasileiras com a utilização de índices contábeis. Revista de Administração, 43(4),
344-355. Retrieved from http://www.revistas.usp.br/rausp/article/view/44487/48107. doi: 10.1590/S0080-21072008000400005
Fama, E. F., & French, K. R. (2002). Testing trade-off and pecking order predictions about dividends and debts. The Review of Financial Studies, 15(1), 1-33. doi: 10.1093/rfs/15.1.1
Faulkender, M. W., & Petersen, M. A. (2006). Does the source of capital affect capital structure? The Review of Financial Studies, 19(1), 45-79. doi: 10.1093/rfs/hhj003
Frank, M. Z., & Goyal, V. D. (2003). Testing the pecking order theory of capital structure. Journal of Financial Economics, 67(2), 217-248. doi: 10.1016/S0304-405X(02)00252-0
Graham, J. R., & Harvey, C. R. (2001). The theory and practice of corporate finance: evidence is the field. Journal of Financial Economics, 60(2-3), 187-243. doi: 10.1016/S0304-405X(01)00044-7
Kamstra, M., Kennedy, P., & Suan, T. (2001). Combining bond rating forecast using logit. The Financial Review, 36(2), 75-96. doi: 10.1111/j.1540-6288.2001.tb00011.x
Kaplan, R. S., & Urwitz, G. (1979). Statistical models of bond ratings: the methodological inquiry.
Journal of Business, 52(2), 231-261. doi: 10.1086/296045
Kisgen, D. J. (2006). Credit rating and capital structure. The Journal of Finance, 61(3), 1035-1072. doi:
10.1111/j.1540-6261.2006.00866.x
Kisgen, D. J. (2009). Do firms target credit ratings or leverage levels? Journal of Financial and Quantitative Analysis, 44(6), 1323-1344. doi: 10.1017/S002210900999041X
Klein, C., Michelsen, M., & Lampenius, N. (2011). Credit ratings and capital structure revisited.
Proceedings of the Meeting of the Midwest Finance Association, Chicago, Illinois, USA, 60.
Meng, Q., Bonerjee, A. N., & Hung, C. (2011). Capital structure change and future credit ratings.
Proceedings of the Meeting of the Midwest Finance Association, Chicago, Illinois, USA, 60.
Mittoo, U. R., & Zhang, Z. (2008). The capital structure of multinational corporations: Canadian versus U.S. evidence. Journal of Corporate Finance, 14(5), 706-720. doi:
10.1016/j.jcorpfin.2008.09.012
Rogers, D., Mendes-da-Silva, W., Neder, H. D., & Silva, P. R. (2013). Ratingde crédito e estrutura de capital: evidências da América Latina. Revista Brasileira de Finanças, 11(3), 311-341. Retrieved
from http://bibliotecadigital.fgv.br/ojs/index.php/rbfin/article/view/4194/12113
Valle, M. R. do (2002). Mercados de bonds: risco, ratinge custo de captação. Revista de Administração, 37(2), 46-56. Retrieved from http://rausp.usp.br/wp-content/uploads/files/V370246.pdf
Thomas, L., Eldman, D., & Crook, J. (2002). Credit scoring and its applications [Monographs on
Mathematical Modeling and Computation]. Philadelphia: SIAM.
Authors’ Profiles
Dany Rogers
Av. João Naves de Ávila, 2121, 38408-100, Uberlândia, MG, Brazil. E-mail address: [email protected]
Wesley Mendes-da-Silva
Rua Itapeva, 432, 01332-000, São Paulo, SP, Brazil. E-mail address: [email protected]
Pablo Rogers