*Correspondence: L. Scotti, Laboratório de Tecnologia Farmacêutica, Univer-sidade Federal da Paraíba, Campus I - Cidade Universitária, 58051-900 - João Pessoa - Paraíba, Brasil. E-mail: [email protected]
A
rti
Pharmaceutical Sciences vol. 47, n. 2, apr./jun., 2011
13
C NMR spectral data and molecular descriptors to
predict the antioxidant activity of lavonoids
Luciana Scotti*
,4Mariane Balerine Fernandes
1, Eric Muramatsu,
1Vicente de Paula Emereciano,
2Josean Fechine Tavares
4, Marcelo Sobral da Silva
4, Marcus Tullius Scotti
31Faculty of Pharmaceutical Sciences, University of São Paulo, 2Institute of Chemistry, University of São Paulo, 3Center of Applied Sciences and Education, Federal University of Paraiba, 4Laboratory of Pharmaceutical Technology,
LTF, University Federal of Paraíba
Tissue damage due to oxidative stress is directly linked to development of many, if not all, human morbidity factors and chronic diseases. In this context, the search for dietary natural occurring molecules with antioxidant activity, such as lavonoids, has become essential. In this study, we investigated a set of 41 lavonoids (23 lavones and 18 lavonols) analyzing their structures and biological antioxidant activity. The experimental data were submitted to a QSAR (quantitative structure-activity relationships) study. NMR 13C data were used to perform a Kohonen self-organizing map study, analyzing the weight
that each carbon has in the activity. Additionally, we performed MLR (multilinear regression) using GA (genetic algorithms) and molecular descriptors to analyze the role that speciic carbons and substitutions play in the activity.
Uniterms: Flavonoids/antioxidant activity. 13C NMR. Kohonen self-organizing map.
Danos aos tecidos devido ao estresse oxidativo estão diretamente ligados ao desenvolvimento de muitos, senão todos, os fatores de sedentarismo e de doenças crônicas. Neste contexto, a busca de moléculas naturais, que participam da nossa dieta e que possuam atividade antioxidante, lavonóides, torna-se de grande interesse. Neste estudo, nós investigamos um conjunto de 41 lavonóides (23 lavonas e 18 lavonóis), relacionando suas estruturas e atividade antioxidante. Os dados experimentais foram submetidos à análise de QSAR (relações quantitativas estrutura-atividade). Dados de RMN 13C foram
utilizados para realizar um estudo do mapa auto-organizável de Kohonen, analisando o peso que cada carbono tem na atividade. Além disso, realizamos uma MLR (regressão múltipla) usando GA (algoritmos genéticos) e descritores moleculares para avaliar a inluência de carbonos e substituições na atividade.
Unitermos: RMN 13C. Flavonóides/atividade antioxidante. Mapa auto-organizável de Kohonen.
INTRODUCTION
Flavonoids are phenolic compounds isolated from a wide range of vascular plants, with over 8000
indivi-dual compounds known (Halliwell et al., 2000). They
possess a wide variety of biological activities including antiinlammatory, antimicrobial, antiallergenic, antiviral, vasodilatory action and antioxidant activity. These com-pounds are able either to suppress free radical formation and chain initiation or to scavenge free radical and chain
propagation (Fernández et al., 2005).
These compounds contain a basic structure
constitu-ted of 15 carbon atoms arranged in three rings (C6-C3-C6)
and have shown the molecular structural requirements for marked radical scavenging activity against the diphenyl picrylhydrazyl (DPPH) radical. The presence of the galloyl group, as well as the number and position of hydroxyl groups, are important and further enhance the radical scavenging activity of lavonoids. On the other hand, the methoxylation or glycosylation of a free hydroxyl group may reduce greatly or even abolish the radical-scavenging
capacity of lavonoids (Yokozawa et al., 1998; Scotti et al.,
2007, 2009; Rastija et al., 2009; Pasha et al., 2007). The
simulates the biological free radical producing mechanism (equation 1) (Molyneux, 2004).
DPPH electron accepting mechanism.
DPPH• + XH → DPPHH + X• (1)
Quantitative structure-activity relationships (QSAR) of lavonoids are important due to their ease of analysis, since they are natural active substances that show small plane molecules with few functional groups, thus it is so-metimes possible to directly ind a relationship between the structure and the activity by analyzing the different functional groups attached to the lavonoid molecule. In this sense, the application of graph theory to chemical structures results in several molecular descriptors that are used to better comprehend important molecular aspects.
In addition to the descriptors that characterize the
mo-lecular structure, the 13C NMR can also be used to describe
the molecular structure. These data yield rich information about the molecular structure and are suficiently sensitive to detect small differences in the molecule. These differen-ces are measured by the variation of chemical shifts, and the values can be used to associate the chemical structure with the respective biological activity since this association can help understand the inluence of the chemical environment
on the biological activity selected. Thus, the 13C NMR data
may be useful in QSAR studies (Berger, 2006; Masui et al.,
2006; Vanderhoeven et al., 2004).
Artiicial Neural Networks (ANNs) are one of the most used approaches to achieve computer classiication and pattern recognition. ANNs are an option for data set analysis that have unknown correlations, such as the pre-diction of the biological activity, taking into account the
13C NMR. The most used ANN architecture for pattern
recognition is the Kohonen network also known as the Self-Organizing Map (SOM) (Lawrence, 1994; Kohonen, 1989,1997,1998; Kohonen, Oja, 1998). Each neurone in the grid is associated to a weight, and similar patterns stimulate neurones with similar weight, so that similar pat-terns are mapped near each other, aiding QSAR analysis by simplifying visualisation and understanding (Gasteiger
et al., 1996).
The aim of this paper was to predict the antioxidant activity of lavonoids measured by the DPPH system using two methodologies. The irst approach is based on the
mo-lecular information given by the 13C NMR data, where the
ANNs were used to predict the biological activity of the lavonoids, sorting them into active or inactive compoun-ds. In the second approach, several molecular descriptors were computed and utilized to predict the antioxidant activity of lavonoids through genetic algorithms.
METHODOLOGY
Data set
In this study, a data set of 41 lavonoids (23 lavones and 18 lavonols), whose activities were reported in the
literature by Yokozawa et al., 1998,was employed. In the
paper, antioxidant activity was measured spectrophoto-metrically by the DPPH method (Table I). The activity was
reported as IC50 that indicates the concentration required
to inhibit the DPPH radical by 50% (decrease of 50% in absorbance). Since the radical scavenging activity varied by orders of magnitude, as well as its respective errors, it
was transformed into natural log values (pIC50 = -logIC50).
In order to design training and prediction sets, the complete data set was processed using cluster analysis. The compounds were irst divided into two subsets: one training set composed of 20 molecules, and one external test set composed of 6 compounds (compounds 06, 10, 25, 29, 34, 36) (see Table I), suitable to analyze predictive performance. The size of the test set was around 20% of the whole set, taking care that the test set contains representa-tive samples of the trained group and included the range of activity values of the training group.
The active compounds, with pIC50 values, were
selected to generate regression models utilizing genetic al-gorithms. Models for antiradical activity were constructed based on the training set and then validated internally (cross validation – leave one out) and externally.
Molecular optimisation
All structures were extracted from the SISTEMAT
database (Gastmans et al., 1990a,b; Ferreira et al., 2001).
An in–house program for data extraction was written in Java and subsequently used to select the lavonoid com-pounds.
Molecular modeling computations were performed
on SPARTAN for Windows v.4.0 software (Wavefunc-
(Wavefunc-tion, Inc., Irvine,Calif.). The molecules were subjected to
geometry optimization and conformational analysis (sys-tematic analysis with dihedral angle rotated every 30°). The semi-empirical quantum chemical method used was
AM1 (Austin Model1) (Dewar et al., 1985, 1990), which is
suitable for this analysis (Bringmann et al., 2000), despite
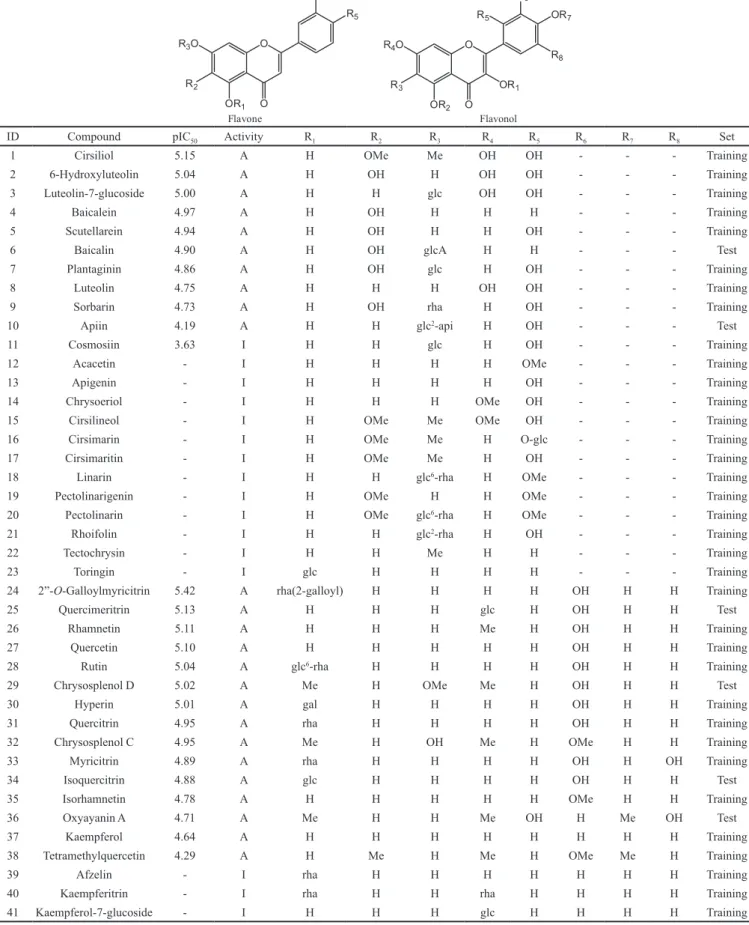
TABLE I - List of compounds, substitutions and its respective log of biological activity. The compounds were classiied as Active
(A, IC50<200mM) or Inactive (I, IC50>200mM) for the Kohonen study: the respective training and test sets
ID Compound pIC50 Activity R1 R2 R3 R4 R5 R6 R7 R8 Set
1 Cirsiliol 5.15 A H OMe Me OH OH - - - Training
2 6-Hydroxyluteolin 5.04 A H OH H OH OH - - - Training
3 Luteolin-7-glucoside 5.00 A H H glc OH OH - - - Training
4 Baicalein 4.97 A H OH H H H - - - Training
5 Scutellarein 4.94 A H OH H H OH - - - Training
6 Baicalin 4.90 A H OH glcA H H - - - Test
7 Plantaginin 4.86 A H OH glc H OH - - - Training
8 Luteolin 4.75 A H H H OH OH - - - Training
9 Sorbarin 4.73 A H OH rha H OH - - - Training
10 Apiin 4.19 A H H glc2-api H OH - - - Test
11 Cosmosiin 3.63 I H H glc H OH - - - Training
12 Acacetin - I H H H H OMe - - - Training
13 Apigenin - I H H H H OH - - - Training
14 Chrysoeriol - I H H H OMe OH - - - Training
15 Cirsilineol - I H OMe Me OMe OH - - - Training
16 Cirsimarin - I H OMe Me H O-glc - - - Training
17 Cirsimaritin - I H OMe Me H OH - - - Training
18 Linarin - I H H glc6-rha H OMe - - - Training
19 Pectolinarigenin - I H OMe H H OMe - - - Training
20 Pectolinarin - I H OMe glc6-rha H OMe - - - Training
21 Rhoifolin - I H H glc2-rha H OH - - - Training
22 Tectochrysin - I H H Me H H - - - Training
23 Toringin - I glc H H H H - - - Training
24 2”-O-Galloylmyricitrin 5.42 A rha(2-galloyl) H H H H OH H H Training
25 Quercimeritrin 5.13 A H H H glc H OH H H Test
26 Rhamnetin 5.11 A H H H Me H OH H H Training
27 Quercetin 5.10 A H H H H H OH H H Training
28 Rutin 5.04 A glc6-rha H H H H OH H H Training
29 Chrysosplenol D 5.02 A Me H OMe Me H OH H H Test
30 Hyperin 5.01 A gal H H H H OH H H Training
31 Quercitrin 4.95 A rha H H H H OH H H Training
32 Chrysosplenol C 4.95 A Me H OH Me H OMe H H Training
33 Myricitrin 4.89 A rha H H H H OH H OH Training
34 Isoquercitrin 4.88 A glc H H H H OH H H Test
35 Isorhamnetin 4.78 A H H H H H OMe H H Training
36 Oxyayanin A 4.71 A Me H H Me OH H Me OH Test
37 Kaempferol 4.64 A H H H H H H H H Training
38 Tetramethylquercetin 4.29 A H Me H Me H OMe Me H Training
39 Afzelin - I rha H H H H H H H Training
40 Kaempferitrin - I rha H H rha H H H H Training
Molecular descriptors
DRAGON computer software (Dragon, 2010;
Todeschini et al., 2000) was employed to calculate 1664
molecular descriptors that were used for performing Mul-tilinear regression (MLR) analysis. For all descriptors, the constant variables were excluded, just retaining those that presented a different value. For the remaining descriptors, pairwise correlation (r < 0.99) analysis was performed to exclude those which were highly correlated. Thus, the
number of DRAGONdescriptors used in our calculations
was reduced to 548.
Genetic algorithm analysis
The MobyDigs program was used for the calculation of regression models utilizing genetic algorithms (GA). GA is a class of methods based on biological evolution roles. The first step is to create a population of linear regression models. These regression models mate with each other, mutate, cross-over, reproduce, and then evolve through successive generations towards an optimum solu-tion (Leardi, 2001; Kubinyi, 1994a,b).
The search for the best subsets of models is calcu-lated by using Ordinary Least Squares regression (OLS) under the Genetic Algorithm (GA) approach, i.e. by the Variable Subset Selection - Genetic Algorithm (VSS-GA)
method. Thus, by examining the regression coeficients, the standard deviations, signiicances and number of vari-ables in the equation, the signiicance of the models could be determined.
13C NMR data
For the analysis correlating the 13C NMR with the
lavonoid biological activities, the 13C NMR data of most
molecules were obtained from the literature (Agrawal, 1989). For a few structures (compounds 02, 16, 17, 24, 29
and 36), the 13C NMR data were obtained using ACDlabs
software (ACD/HNMR,2003). Since lavonoids are plane aromatic compounds, the additivity model can be applied
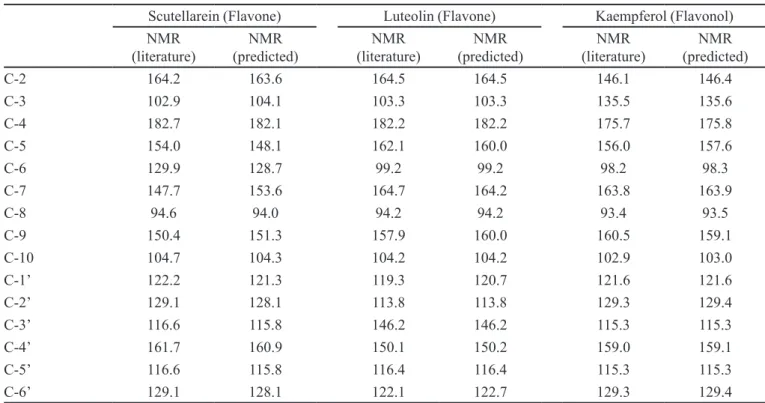
satisfactorily to predict 13C NMR data. To validate the
method employed in the 13C NMR data prediction, the
chemical shifts of some lavonoids were predicted and compared against the literature data (Table II). The chemi-cal shifts predicted by the software were very close to the literature reference (errors smaller than 3 ppm). Thus, for
the six above-mentioned compounds, the 13C NMR data
were predicted by the ACD software.
To standardize the 13C NMR analysis, since not all
molecules have the glycosil and methyl groups, the 13C
NMR data used in the analysis included only the chemical shifts pertaining to the lavonoid skeleton. It is important to note that the even though the glycosil and the methyl
TABLE II -Use validation of the ACDlab software to predict NMR values
Scutellarein (Flavone) Luteolin (Flavone) Kaempferol (Flavonol)
NMR
(literature) (predicted)NMR (literature)NMR (predicted)NMR (literature)NMR (predicted)NMR
C-2 164.2 163.6 164.5 164.5 146.1 146.4
C-3 102.9 104.1 103.3 103.3 135.5 135.6
C-4 182.7 182.1 182.2 182.2 175.7 175.8
C-5 154.0 148.1 162.1 160.0 156.0 157.6
C-6 129.9 128.7 99.2 99.2 98.2 98.3
C-7 147.7 153.6 164.7 164.2 163.8 163.9
C-8 94.6 94.0 94.2 94.2 93.4 93.5
C-9 150.4 151.3 157.9 160.0 160.5 159.1
C-10 104.7 104.3 104.2 104.2 102.9 103.0
C-1’ 122.2 121.3 119.3 120.7 121.6 121.6
C-2’ 129.1 128.1 113.8 113.8 129.3 129.4
C-3’ 116.6 115.8 146.2 146.2 115.3 115.3
C-4’ 161.7 160.9 150.1 150.2 159.0 159.1
C-5’ 116.6 115.8 116.4 116.4 115.3 115.3
carbons, as cited earlier, interfere in the activity only by excluding a free hydroxyl group, glycosylation and methoxylation greatly inluence kinetic factors such as absorption, plasma transport and clearance.
Self-organizing maps
The unsupervised training was performed using the SOM Toolbox version 2.0 for Matlab version 6.5 compu-ting environment by MathWorks, Inc (Mathworks, 2010;
Vesanto et al., 2010). The toolbox contains functions for
creation, visualization and analysis of Self-Organizing Maps. The training was conducted through the Batch– training algorithm. In this algorithm, the whole dataset is presented to the network before any adjustment is made. In each training step, the dataset is partitioned according to the regions of the map weight vectors.
RESULTS AND DISCUSSION
Prediction of antioxidant activity of lavonoids
through 13C NMR data
In this first approach, the molecular information
yielded by the 13C NMR data was used to predict the
anti-oxidant activity of the lavonoids, sorting them into active or inactive compounds from the ANNs.
The correlation between the 13C NMR data and the
biological activity was performed using SOM. To this end, the compounds were classiied as active if they exhibited
IC50<200 µM and inactive if they exhibited values of
IC50>200 µM (Table I).
The 13C NMR chemical shifts of lavonoids were
used as the input data, and the separation between active and inactive compounds was obtained. The results are shown in Table III.
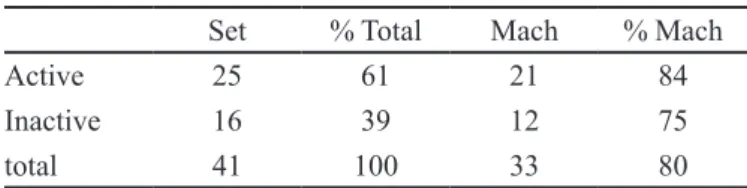
Table III shows a highly signiicant match with a high percentage for both groups (80%). Analyzing the groups separately, the greatest value occurred among the active compounds (84%). This could be explained by the common chemical environment exhibited by the
active molecules given these compounds have a pattern of substitution that also inluences the electromagnetic surface. This substitution pattern may be hydroxylation at C-3’ and C-4’ because all molecules that have the hy-droxyl group in these positions are active. Thus, the ANN recognized this structural pattern and all lavonoids that contain the C-3’ and C-4’ hydroxyl groups were classi-ied as active, matching almost all active molecules (21 lavonoids).
The four non-matching molecules were flavones that shared the substitution pattern C-4’ hydroxyl and C-3’ with no groups attached. This substitution is characteristic of inactive compounds. Therefore, active compounds that have this odd pattern were classiied as inactive by the ANN. For the inactive compounds, half (2) of the non-matching molecules were lavones that have C-4’ hydroxyl and C-3’ methoxyl.
Figure1 shows the contribution of each carbon to the
map, based on its 13C NMR data. The distribution depicts
a satisfactory separation between both groups as a conse-quence of a signiicant Kohonen performance.
Prediction of antioxidant activity of lavonoids through molecular descriptors and genetic algorithms
The molecular descriptors were computed for the compounds which were irst divided into two subsets: one training set composed of 20 structures, and one external test set composed of 6 compounds, suitable for analyzing the predictive performance.
Regression analysis of the training set leads to
Mod-el I which contains RDF105m, RDF110v (Hemmer et al.,
1999), RDF (Radial Distribution Function) descriptors,
and O-057 (Viswanadhan et al., 1989), an atom-centered
fragments descriptor, which were able to explain 88.6% of variance of antioxidant activity.
Analyzing equation 2, the value of the coeficient of
internal prediction Qcv 2 is highly signiicant (0.837), which
is indicative of a robust model. The linear adjustment is shown in Figure 4 and the low errors in Table IV. The F value is also highly (41.91) signiicant because for 95% conidence with 3 and 16 degrees of freedom, the neces-sary minimum F value is 3.24.
pIC50 = 0.092 (± 0.036) RDF105m –
0.162 (± 0.042) RDF110v + 0.074 (± 0.053)O-057 +
4.420 (± 0.242) (2)
(n=20, r2 = 0.887, s = 0.120, F = 41.91, Q
cv2 = 0.837,
s-Press = 0.144, next = 6, r2ext = 0.662, Qext2 = 0.657)
TABLE III - Kohonen obtained results for active and nactive sets
with its respective mach and mach percentage
Set % Total Mach % Mach
Active 25 61 21 84
Inactive 16 39 12 75
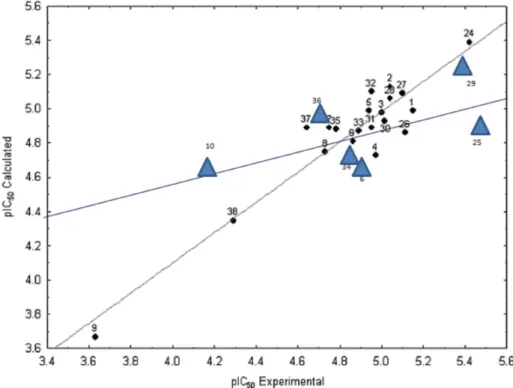
The signiicant linear adjustment for training and test sets is shown in Figure 2, and the small errors in Table IV conirm that the equation was capable of predicting and differentiating the most active compound from the others. Statistically, the validation of the model is shown
by analysing the signiicant values of the parameters r2
ext
(0.662) and Qext2 (0.657).
Table V shows the correlation matrix between each pair of descriptors and shows low validated values, indicating low co-linearity descriptors since they are not highly correlated.
Radial distribution function, RDFRw, can be
inter-preted as the probability distribution of inding an atom in
a spherical volume of radius (“R”) in angstroms (equation
3), weighted by the characteristic properties “w” of the
atom, where rij is the interatomic distance between atoms
i and j, nAT is the number of atoms in the molecule, and β is a smoothing parameter. Besides information about interatomic distances in the entire molecule, these des-criptors provide further information about bond distances, ring types, planar and non-planar systems and atom types.
RDF105m and RDF110v were selected in this stu-dy (by equation 2). The former indicates that in a radius of 10.5Å, the greater the atomic masses and number of atoms in this radius, the greater the RDF value (Hemmer
et al., 1999). The latter indicates that in a radius of 11.0Å, the greater the atomic van der Walls volumes as for the number of atoms in this radius, the greater the RDF value
(Hemmer et al., 1999).
(3)
In Model I, RDF105m has a positive contribution
FIGURE 2 - Comparative plot experimental values versus calculated activity values (pIC50) for the training (black balls) and test
(blue triangles) sets.
FIGURE 1 - Contribution of each carbon to the map based on
its 13C NMR data, showing the contribution of the chemical
values (compounds 3 and 25) share a substitution pattern: O-glycosylation at C-7 and C-3’ hydroxylation. These compounds also have a high biological activity value.
Compound 37, which does not have this pattern, has a low
RDF105m value and a low biological activity value. As the radial distribution can characterize the solvation layers around a speciic atom, this descriptor can be related to the access capability of both water molecules and the radical species involved in the reaction. In this study, this ability can be associated with the presence of the glycosyl group, which shows great hydrophilicity and has hydroxyl groups that participate in the biological activity. Thus, the greater the RDF value, the greater the activity.
RDF105m of molecule 3 is higher than 11 and the
biological activity is also higher, which makes clear the inluence of a single hydroxyl group at C-3’. Examining
the compounds 3 and 7 and their activities and RDF105m,
reveals that the absence of a hydroxyl at C-3’ could be partially compensated by a hydroxyl at C-6. For compound
8 in comparison to 3, the glycosyl group removal at C-7
decreases both activity and RDF105m value. In contrast,
comparing the molecules 27 and 34 evidences that
glyco-syl removal at C-3 in lavonoids increases both activity and also RDF105m value. Moreover, each kind of sugar has a different effect in activity, as is seen when comparing
compound 27 to compounds 30, 31 and 34, where higher
activity is obtained with higher RDF105m value.
Molecules with bulky groups, especially at C-7, show the greatest probability of having a high value of RDF110v, and thus a lower value of antioxidant activity.
Compound 10 has a high RDF110v and a low biological
activity, whereas compound 27, which is a small molecule,
has a low RDF110v value and high biological activity. It is noteworthy that solely being a small molecule does not fulil all the requirements for high activity, since the posi-tion of the bulky and hydroxyl groups usually impacts the effectiveness of the molecule against free radicals. For in-stance, molecules with greater activity and low RDF110v
such as compounds 24 and 28 have bulky substituents but
are at C-3.
Atom-centred fragments can be understood simply as being the number of speciic fragment types in a mol-ecule. For the O-057 molecular descriptor, the increase in the number of phenol, enol or acid groups present in the structure is directly proportional to the O-057 value observed. Molecules with acid groups, such as compounds
6 and 24, have a high O-057 value and will exhibit a high
antioxidant activity value. Polyhydroxylated lavonoids
such as 2, 4, 5, 8, and 25 also have a high O-057 value,
suggesting the positive effect of the hydroxyl group on the radical-scavenging activity.
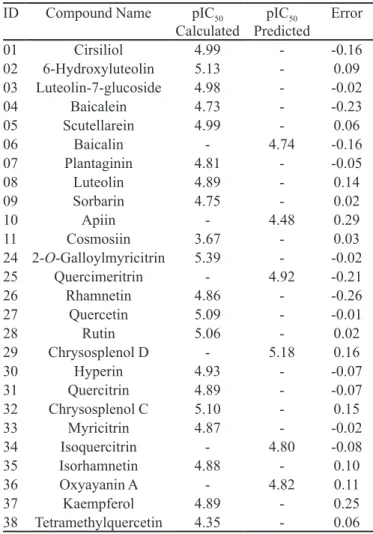
TABLE IV - Calculated, predicted and error values for antioxidant
activity
ID Compound Name pIC50
Calculated PredictedpIC50 Error
01 Cirsiliol 4.99 - -0.16
02 6-Hydroxyluteolin 5.13 - 0.09
03 Luteolin-7-glucoside 4.98 - -0.02
04 Baicalein 4.73 - -0.23
05 Scutellarein 4.99 - 0.06
06 Baicalin - 4.74 -0.16
07 Plantaginin 4.81 - -0.05
08 Luteolin 4.89 - 0.14
09 Sorbarin 4.75 - 0.02
10 Apiin - 4.48 0.29
11 Cosmosiin 3.67 - 0.03
24 2-O-Galloylmyricitrin 5.39 - -0.02
25 Quercimeritrin - 4.92 -0.21
26 Rhamnetin 4.86 - -0.26
27 Quercetin 5.09 - -0.01
28 Rutin 5.06 - 0.02
29 Chrysosplenol D - 5.18 0.16
30 Hyperin 4.93 - -0.07
31 Quercitrin 4.89 - -0.07
32 Chrysosplenol C 5.10 - 0.15
33 Myricitrin 4.87 - -0.02
34 Isoquercitrin - 4.80 -0.08
35 Isorhamnetin 4.88 - 0.10
36 Oxyayanin A - 4.82 0.11
37 Kaempferol 4.89 - 0.25
38 Tetramethylquercetin 4.35 - 0.06
TABLE V - Correlation (r) matrix between the descriptors
RDF105m RDF110v O-057
RDF105m 1 .554 .014
RDF110v 1 .39
O-057 1
while RDF110v has a negative contribution. Thus, in a radius of 10.5Å, the greater the atomic masses, the greater the biological activity value, and in a radius of 11.0Å, the greater the atomic van der Waals volumes, the lower the biological activity value.
Analyzing the molecule structures, separating them into one set possessing the greatest values of biological activity, and another exhibiting the lowest values, and then comparing these compounds by groups that could be responsible for the high or low activity, gives rise to several considerations.
CONCLUSIONS
Using molecular descriptors to perform a GA analy-sis, this study was able to show that sterical and fragment features are directly, and electronic features (van der Waals volume) indirectly, involved in the determination of the substitution patterns in the molecule that are responsible for a major effect on activity. For instance, hydroxyl at C-3’, C-4’ and C-6 are very important for high biological activity, while glycosylation at C-7 frequently decreases the activity.
The importance of these carbons was conirmed in
the 13C NMR analysis. Through the chemical shifts of the
13C NMR, the ANN achieved a signiicant result, sorting the
active and inactive molecules with minimal errors (20%).
This supports the notion that 13C NMR data can be used to
perform classiication of lavonoids taking into account the biological activity, making clear that radical scavenging activity is highly correlated with the chemical environment.
A future application could be the elucidation of the role that other carbons (i.e. C-2, C-3, C-5, C-8 and C-1’) play on activity. In this context, a more extensive study is needed to compare a greater number of compounds and
13C NMR data. Moreover, it would be useful to study other
classes of lavonoids such as lavanones, lavanonols and anthocyanidins to determine which skeleton type is most active and which position in the structure has the greatest contribution to the activity.
REFERENCES
ADVANCED CHEMISTRY DEVELOPMENT Inc. HNMR Predictor, version 7.03. Toronto, 2003. CD-Rom.
AGRAWAL, P.K. Carbon-13 NMR of lavonoids. Amsterdam:
Elsevier, 1989. 564 p.
BEGER, R., Computational modeling of biologically active
molecules using NMR spectra. 2006. Drug Discov. Today,
v.11, n.9-10, p.429-435, 2006.
BRINGMANN, G.; HINRICHS, J.; KRAUS, J.; WUZIK, A.; SCHULZ, T. Nondynamic kinetic resolution of configurationally stable biaryl lactones by reduction with oxazaborolidine-activated borane: AM1 studies and
experimental veriication. J. Org. Chem., v.65, n.8,
p.2517-2527, 2000.
DEWAR, M.J.S.; ZOEBISCH, E.G.; HEALY, E.F.; STEWART, J.J.P. AM1: A new general purpose quantum mechanical
molecular model. J. Am. Chem. Soc., v.107, n.13,
p.3902-3909, 1985.
DEWAR, M.J.S.; HEALY, E.F.; HOLDER, A.J.; YUAN, Y.C. Comments on a comparison of AM1 with the recently
developed PM3 method. J. Comput. Chem., v.11, n.4,
p.541-542, 1990.
DRAGON software. Milano, Available at:<http://www.talete. mi.it/products/dragon_description.htm>. Accessed on: 10 jun. 2010.
FERNÁNDEZ, M.; CABALLERO, J.; HELGUERA, A.M. Quantitative structure–activity relationship to predict differential inhibition of aldose reductase by flavonoid
compounds. Bioorg. Med. Chem., v.13, n.9, p.3269-3277,
2005.
FERREIRA, M.J.P.; RODRIGUES, G.V.; EMERENCIANO, V.P. MONOREG – An expert system for structural
elucidation of monoterpenes. Can. J. Chem., v.79, n.12,
p.1915-1925, 2001.
GASTEIGER, J.; SADOWSKI, J.; SCHUUR, J.; SELZER, P.; STEINHAUER, L.; STEINHAUER, V. Chemical
Information in 3D Space. J. Chem. Inf. Model., v.36, n.5,
p.1030-1037, 1996.
GASTMANS, J.P.; FURLAN, M.; LOPES, M.N.; BORGES, J.H.G.; EMERENCIANO, V.P. A inteligência artiicial em química de produtos naturais. O Projeto SISTEMAT - Parte I. Quím. Nova, v.13, n.2, p.10-16, 1990a.
GASTMANS, J.P.; FURLAN, M.; LOPES, M.N.; BORGES, J.H.G.; EMERENCIANO, V.P. A inteligência artiicial em química de produtos naturais. O Projeto SISTEMAT - Parte II. Quím. Nova, v.13, n.2, p.75-80, 1990b.
HALLIWELL, B.; GUTTERIDGE, J M.C. Free radicals in
biology and medicine. 3.ed. Clarendon: Oxford, 2000. 936 p.
HEMMER, M.C.; STEINHAUER, V.; GASTEIGER, J. Deriving the 3D structure of organic molecules from their
infrared spectra. Vibrat. Spect., v.19, n.1, p.151-164, 1999.
KOHONEN, T. Speech recognition based on topology
preserving neural maps. In: ALEKSANDER, I. (Ed.) Neural
computing architectures. London: Koogan 1989. p.26-40.
KOHONEN, T. Self-Organizing maps. 3.ed. New York:
KOHONEN, T.; OJA, E. Visual feature analysis by the
self-organizing maps. Neural Comput. Appl., v.7, n.3,
p.273-286, 1998.
KOHONEN, T. The self-organizing map. NeuroComputing,
v.21, n.1-3, p.1-6, 1998.
KUBINYI, H. Variable selection in QSAR studies. I. An
evolutionary algorithm. Quant. Struct.-Act. Relat., v.13,
n.3, p.285-294, 1994a.
KUBINYI, H.; Variable selection in QSAR studies. II. A highly eficient combination of systematic search and evolution.
Quant. Struct.-Act. Relat.,, v.13, n.3, p.393-401, 1994b.
LAWRENCE, J. Introduction to neural networks design, theory
and applications. 6.ed. London: Sylvia Luedeking 1994. 348 p.
LEARDI, R. Genetic algorithms in chemometrics and chemistry:
a review. J. Chemom., v.15, n.7, p.559-569, 2001.
MASUI, H.; HONG, H. Spec2D: a structure elucidation system based on 1H NMR and H-H COSY spectra in organic
chemistry. J. Chem. Inf. Model., v.46, n.2, p.775-787, 2006.
MATHWORKS INC. METLAB and Simulink for technical computing Available at: <http://www.mathworks.com>. Accessed on: 10 jul. 2010.
M O LY N E U X , P. T h e u s e o f s t a b l e f r e e r a d i c a l diphenylpicrylhydrazyl. (DPPH) for estimating antioxidant
activity. Songklanakarin J. Sci. Technol., v.28, n.2,
p.211-219, 2004.
PASHA, F.A.; CHO, S.J.; BEG, Y.; TRIPATHI, Y.B. Quantum chemical QSAR study of flavones and their
radical-scavenging activity. Med. Chem. Res., v.16, n.7-9,
p.408-417,2007.
RASTIJA, V.; MEDIĆ-ŠARIĆ, M. QSAR Study of antioxidant
activity of wine polyphenols. Eur. J. Med. Chem., v.44, n.1,
p.400-408, 2009.
ROY, A. B.; BASAK, S. C.; HARRISS, D. K.; MAGNUSON, V. R. Neighborhood Complexities and Symmetry of Chemical Graphs and Their Biological Applications. In; AVULA, X.J.R.; KALMAN, R.E.; LIPAIS, A.I.; RODIN, E.Y. (Eds.).
Mathematical modelling in science and technology. Oxford: Pergamon Press, 1984. p.745-750.
SCOTTI, L.; SCOTTI, M.T.; CARDOSO, C.; PAULETTI, P.; CASTRO-GAMBOA, I.; BOLZANI, V.S.; VELASCO, M.V.R.; MENEZES, C.S.M.; FERREIRA, E.I. Modelagem molecular aplicada ao desenvolvimento de moléculas com
atividade antioxidante visando o uso cosmético. Braz. J.
Pharm. Sci., v.43, n.2, p.153-167, 2007.
SCOTTI, L.; SCOTTI, M.T.; PASQUALOTO, K.F.M.; BOLZANI, V.S. Molecular physicochemical parameters predicting antioxidant activity of Brazilian natural products.
Braz. J. Pharmacog., v.19, n.4, p.908-913, 2009.
TODESCHINI, R.; CONSONNI, V. Handbook of molecular
descriptors. Weinheim: Wiley-VCH, 2000. 667 p.
VANDERHOEVEN, S.J.; TROKE, J.; TRANTER, G.E.; WILSON, I.D.; NICHOLSON, J.K.; LINDON, J.C. Nuclear magnetic resonance (NMR) and quantitative structure– activity relationship (QSAR) studies on the transacylation reactivity of model 1β-O-acyl glucuronides. II: QSAR modelling of the reaction using both computational and
experimental NMR parameters. Xenobiotica, v.34, n.10,
p.889-900, 2004.
VESANTO, J.; HIMBERG, J.; ALHONIEMI, E.; PARHANKANGAS, J. SOM Toolbox for Matlab 5. Available at: <http://www.cis.hut.i/projects/somtoolbox>. Accessed on: 10 jul. 2010.
VISWANADHAN, V.N.; GHOSE, A.K.; REVANKAR, G.R.; ROBINS, R.K. Atomic physicochemical parameters for three dimensional structure directed quantitative structure-activity relationships. 4. Additional parameters for hydrophobic and dispersive interactions and their application for an automated superposition of certain
naturally occurring nucleoside antibiotics. J. Chem. Inf.
Model., v.29, n.3, p.163-172, 1989.
YOKOZAWA, T.; CHEN, C.P.; DONG, E.; TANAKA, T.; NONAKA, G.-I.; NISHIOKA, I., Study on the inhibitory effect of tannins and flavonoids against the 1,1-Diphenyl-2-picrylhydrazyl radical - A newly found effect of hydrolysable-type tannin-containing crude drug
and gallotannin Biochem. Pharmacol., v.56, n.2,
p.213-222, 1998.
Received for publication on 23rd October 2010