*Correspondence: R. Nogueira. Instituto Nacional de Metrologia, Normal-ização e Qualidade Industrial (Inmetro), Divisão de Metrologia Química, Laboratório de Análise Orgânica. Av. Nossa Senhora das Graças, 50 – Xerém, 25250-020 - Duque de Caxias – RJ, Brazil. E-mail: [email protected]
A
rti
Pharmaceutical Sciences vol. 47, n. 2, apr./jun., 2011
Validation of a liquid chromatographic method for determination
of related substances in a candidate certiied reference material of
captopril
Raquel Nogueira
1*, Wagner Wollinger
1, Thaís Elias da Silva
1, Leonardo Mesquita de Oliveira
1,
Eliane Cristina Pires do Rego
1, Gabriela Fernandes Moreira
2, Juliano Smanioto Barin
1, Luciane
Varini Laporta
1, Márcia Foster Mesko
1, Celso Figueiredo Bittencourt
1, Janaína Marques
Rodrigues
1, Valnei Smarçaro da Cunha
11Brazilian National Institute of Metrology, Standardization and Industrial Quality (Inmetro), Chemical Metrology Division
(Dquim), Organic Analysis Laboratory (Labor), 2Brazilian National Institute of Metrology, Standardization and Industrial
Quality (Inmetro), Materials Metrology Division (Dimat)
This paper describes the validation of a reversed-phase high performance liquid chromatography method (RP-HPLC) with diode array detection (DAD) for determination of related substances (impurities from organic synthesis and degradation products) of captopril according to the Brazilian Pharmacopeia IV. The aim of this study was to guarantee the method accuracy for quantiication of related substances, an essential requisite to determine, using the mass balance approach, the captopril content in the irst Brazilian certiied reference material (CRM) of an active pharmaceutical ingredient (API), developed by Inmetro. The captopril instability in solution is discussed and the captopril content determined by mass balance is compared to the results from titration and differential scanning calorimetry (DSC).
Uniterms: Captopril/qualitative analysis. Medicines/analysis/method validation. Medicines/analytical quality control. High performance liquid chromatography/qualitative analysis. Medicines/contamination. Captopril/certiied reference standards.
Este artigo descreve a validação de método de cromatograia líquida de alta eiciência em fase reversa (CLAE-RP) com detector de fotodiodos (DAD) para determinação de substâncias relacionadas (impurezas orgânicas de síntese e produtos de degradação) de captopril segundo Farmacopéia Brasileira IV ed. Este estudo teve como objetivo garantir que o método é capaz de quantiicar com exatidão o teor de substâncias relacionadas, um requisito essencial para que o teor de captopril seja determinado por balanço de massa no primeiro material de referência certiicado (MRC) de fármacos brasileiro, o qual foi desenvolvido pelo Inmetro. A instabilidade do captopril em solução é discutida em detalhes e o teor de captopril determinado por balanço de massa é comparado com aqueles obtidos por titulação e por calorimetria exploratória diferencial (DSC).
Unitermos: Captopril/análise qualitativa. Medicamentos/análise/validação de método. Medicamentos/ controle analítico de qualidade. Cromatograia líquida de alta eiciência/análise qualitativa. Medicamentos/ contaminação. Captopril/padrões de referência.
INTRODUCTION
The Brazilian National Institute of Metrology, Stan-dardization and Industrial Quality (Inmetro) has recently
started a project to develop certiied reference materials (CRMs) of active pharmaceutical ingredients (APIs). In 2010, the captopril CRM, which is the irst Brazilian certiied reference material of API, was presented by this institute. Captopril is an angiotensin I converting enzyme inhibitor widely used in the treatment of hypertension and congestive heart failure (Stultzer at al., 2009).
mate-rials, which are accompanied by a certiicate declaring the value of a speciied property (the API content in the scope of this paper) and the associated measurement uncertain-ty, in order to guarantee metrological traceability (ISO Guide 35:2006; JCGM, 2008). This traceability, which is a requirement of the ISO 17025:2005 standard and corres-ponds to “an unbroken chain of comparisons to national or international standards, all having stated uncertainties” (Duewer et al., 2004), cannot be ensured through the use of “non-certiied” reference materials (also called reference standards).
The availability of certiied reference materials for pharmaceutical use remains limited. The United States Pharmacopeia (USP), for instance, whose reference stan-dards have been available since 1926 (Williams et al., 2006), developed its irst CRM only in September 2008: dextromethorphan hydrobromide, which was followed in 2009 by theophylline, phenytoin and carbamazepine CRMs (The United States Pharm. Convention, 2010). We expect that in the near future the demand for pharmaceuti-cal CRMs may be increasingly met by Pharmacopeias or National Metrology Institutes (NMIs).
The requirements for preparation of CRMs are described by the ISO Guides 34:2009 and 35:2006, and include material characterization, homogeneity evalu-ation, short- and long-term stability studies, as well as measurement uncertainty estimation.
The characterization step includes the determination of the property value, which in our case was the captopril content in the CRM and was determined by mass balance according to eq. 1.
Captopril (%) = 100 % – Σ organic impurities (%) – Σ inorganic impurities (%) – Σ volatiles (water and sol-vents) (%) (eq. 1)
The mass balance approach allows determination of API content with standard deviations up to 10 times lower than those obtained by traditional assay methods (Hofer, Olsen, Rickard, 2007). The precision of the HPLC assays, for instance, is estimated to be in the range of 0.5-1.0% (Gorog, 2005). More precise results (smaller standard deviations) have the advantage of consequently lower associated measurement uncertainties. This justiies the increasing importance of tests for determination of impuri-ties compared to those for assay of analytes (Gorog, 2005). In order to use the mass balance equation, it is ne-cessary to accurately quantify all impurities, including those from organic synthesis and degradation products. The organic impurities content in the captopril candidate certiied reference material was determined by
RP-HPLC-DAD, according to the related substances test method given in the Brazilian Pharmacopeia IV monograph in question. This method has been validated, as described in this article, in order to guarantee that it is adequate for the intended use (ICH, 1994; Anvisa, 2003; ISO 17025:2005) and to prove its capacity to generate accurate results that could be used for the mass balance calculation.
MATERIALS AND METHODS
Instrumentation
For determination of related substances, a high perfor-mance liquid chromatographic (HPLC) Shimadzu system equipped with a quaternary pump LC-20AT, on-line degas-ser DGU-20A3/DGU-20A5, auto-sampler SIL-20A/20AC,
photodiode array detector SPD-20A and interface CBM-20A/20A, was used. The data were processed using the software Lab Solution. The system suitability test (5 repli-cate injections, allowed relative standard deviation for peak areas < 2 %) (USP 32) was carried out before each set of validation experiments using a 10 µg/g captopril solution, in order to conirm the HPLC system performance.
The differential scanning calorimetry measurements were performed using a DSC Q1000 (TA Instruments) according to Moreira et al. (2010). For gravimetric pre-paration of samples, an analytical balance AUW 220D (Shimadzu) with 0.01 mg resolution was used.
Samples and reagents
The studies were performed using samples of the first Inmetro batch of captopril CRM, whose certified reference value and expanded uncertainty (U), using the value of 2 as coverage factor for a conidence level of ap-proximately 95 % (ABNT / Inmetro, 2003), was 99.565 + 0.093 % w/w (Nogueira et al., in press).
The captopril USP reference standard (batch H 09120H, 100.0 %) and the captopril disulide USP reference standard (batch H0F251, 99.0 %) were not dried before use.
The reagents used for sample preparation and chro-matographic analysis were methanol HPLC grade (Tedia Brazil), o-phosphoric acid 85 % w/w for analysis (Tedia Brazil), hydrochloric acid p.a. (Merck), sodium hydroxide p.a. (Merck), hydrogen peroxide 30 % p.a. (Merck) and water type I.
Method description
Brazilian Pharmacopeia IV monograph. The analysis conditions were: mobile phase, methanol - phosphoric acid 0.11 % (55:45, v/v); low-rate, 1 ml/min; UV detection, 220 nm; injection volume, 20 µl. The HPLC column was RP18, 25 cm x 4.6 mm i.d., 5 µm, Supelcosil (Supelco), to which a pre-column RP18, 4.6 mm i.d., 5 µm (Varian) was attached.
Method validation
All solutions for validation studies were prepared gravimetrically, using mobile phase as the diluent.
The method specificity was evaluated by means of analysis of diluent (mobile phase), captopril disulide USP reference standard (10 µg/g solution), captopril USP reference standard (500 and 10 µg/g solutions), captopril CRM samples (500 and 10 µg/g solutions), mixtures of captopril disulide USP reference standard and captopril CRM (solutions containing 10 and 500 µg/g, respectively) and mixtures of captopril disulide and captopril USP re-ference standards (solutions containing 10 and 500 µg/g, respectively). Additionally, samples of captopril CRM exposed to temperatures of 80 °C, 120 °C, 140 °C and 250 °C or treated with 1 mol/L HCl, 1 mol/L NaOH or 3% H2O2 for 5 h were analyzed. After treatment, the samples
were neutralized (in case of acidic or basic conditions) and then diluted with mobile phase to reach the analysis concentrations (500 and 10 µg/g solutions).
In order to evaluate the captopril stability in the di-luent (mobile phase), 500 µg/g solutions of captopril CRM (prepared in triplicate from lasks 16, 180 and 446) were transferred to HPLC vials and kept at 15 °C in the auto-sampler. The irst injection of all solutions was performed in a random fashion, being followed by injections 2 and 3 performed in the same manner. The test was repeated using freshly prepared CRM solutions.
The linearity test was carried out using 11 individual solutions of captopril and captopril disulide USP referen-ce standards in the conreferen-centration range of 0.01 to 500 µg/g. The captopril solutions were prepared both from the same stock solution and from different stock solutions freshly made before injection. For captopril disulide, the dilutions were prepared from the same stock solution.
The limit of detection (LOD) and the limit of quan-titation (LOQ) were initially estimated from the linearity data. For captopril disulide, the results were then con-irmed by preparing a dilution series (9 solutions) in the concentration range of 0.01 µg/g to 1.00 µg/g, which was suficient to obtain responses (peak heights) equivalent to around 10 times the noise (estimated from baseline) (LOQ) or to around 3 times the noise (LOD), as required by the
signal-to-noise (S/N) ratio method (ICH, 1994).
The repeatability was evaluated by six repeated in-jections of captopril and captopril disulide USP reference standards (10 µg/g individual solutions). This test was repeated on a different day by a different analyst in order to verify intermediate precision.
The recovery tests for accuracy evaluation were performed using solutions of captopril disulfide USP reference standard at the concentrations of 7.5, 10.0 and 12.5 µg/g (75% to 125% of the total organic impurity li-mit of 10 µg/g), with or without the addition of 500 µg/g of captopril CRM or captopril USP reference standard (considered as matrixes). These two matrixes were also individually analyzed to determine their original captopril disulide content.
For comparison of different methods, the mass ba-lance calculation of the captopril content was done using eq. 1. The content of organic impurities in the captopril CRM was determined by RP-HPLC-DAD, the inorganic impurities were estimated by residue of ignition (sulphated ash) using 9 captopril CRM samples of 1 g each, ignited at 600 °C until constant weight after addition of sulfuric acid, while the volatiles were determined by loss on drying at 60 °C under vacuum for 3 hours using 10 captopril CRM samples of 0.5 g each.
The robustness test was done by HPLC analysis of diluent (mobile phase), captopril CRM solution (10 µg/g) and captopril USP reference standard solution (10 µg/g) analyzed under eight different experimental conditions, which will be described in the corresponding section.
RESULTS AND DISCUSSION
The following parameters were evaluated for the method validation:
1. Speciicity;
2. Stability of solutions;
3. Linearity and working range;
4. Limit of detection (LOD) and limit of quantitation (LOQ);
5. Repeatability and intermediate precision; 6. Accuracy;
7. Robustness.
Speciicity
Figures 1 and 2 show the chromatograms for cap-topril disulide and capcap-topril USP reference standards, respectively, while Figure 3 shows the chromatogram for the captopril CRM. Captopril eluted at the retention time tR = 4.3 min, while its main impurity captopril disulide
eluted at the retention time tR = 6.7 min. Captopril disulide
was present as an impurity both in the captopril USP refe-rence standard (content around 0.07 %) (Figure 2) and in the captopril CRM (Figure 3). For captopril CRM samples,
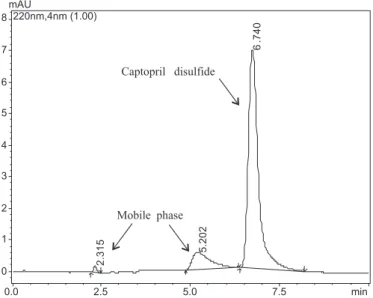
FIGURE 1 - Chromatogram of captopril disulide USP reference
standard (10 µg/g), showing captopril disulide peak (tR = 6.7 min)
and mobile phase signals. Experimental conditions: HPLC column, RP18 25 cm x 4.6 mm i.d. 5 µm; mobile phase, methanol - phosphoric acid 0.11% (55:45, v/v); low-rate, 1 mL/min; UV detection, 220 nm; injection volume, 20 µL.
FIGURE 2 - Chromatogram of captopril USP reference standard (500 µg/g) (a) in full scale and (b) in enlarged view, showing peaks
of captopril (tR = 4.3 min) and its main impurity captopril disulide (tR = 6.7 min) present in small amount, as well as mobile phase
signals. Experimental conditions: see Figure 1.
the chromatograms showed, besides the peaks of captopril and captopril disulide, three peaks of unknown impurities (tR = 3.5 min, tR = 3.7 min and tR = 6.0 min) (Figure 3).
The diluent (mobile phase) was responsible for two signals observed in the chromatograms, whose areas re-mained constant during the validation and RM certiication experiments, and which were suficiently resolved from the peaks of captopril and captopril disulide (Figures 1 to 3). There was no indication that these signals could overlap with an impurity peak based on the speciicity test results: no increase in the areas of these diluent peaks was obser-ved in the chromatograms of samples exposed to intense stress conditions (80 °C, 120 °C, 140 °C, 250 °C, 1 mol/L HCl, 1 mol/L NaOH and 3% H2O2).
The results for the speciicity test are summarized in Table I. The peaks of captopril and captopril disulide were suficiently resolved (Rs 5.0), in accordance with the
Brazilian Pharmacopeia IV acceptance criteria (Rs min
2.0). For the peaks of captopril and captopril disulide, peak purity indexes of at least 0.98 were obtained, even after exposure of samples to temperatures up to 140 ºC or to other stress conditions (acidic, basic or oxidizing). The disulide captopril could be suficiently recovered in the presence of matrixes (captopril USP reference standard or captopril CRM) (at least 96.8 %). Therefore, the method validation regarding speciicity has been demonstrated.
Stability of solutions
FIGURE 3 - Chromatogram of captopril candidate CRM (500 µg/g) (a) in full scale and (b) in enlarged view, showing the peaks
of captopril (tR = 4.3 min), captopril disulide (tR = 6.7 min), three unknown impurities (tR = 3.5 min, tR = 3.7 min and tR = 6.0 min)
and mobile phase signals. Experimental conditions: see Figure 1.
TABLE I - Speciicity tests using captopril and captopril disulide solutions, with evaluation of peak purity indexes, peak resolution,
recoveries and behavior under stress conditions
Captopril disulide Captopril Resolution
tR
(min) Assay (%) purity Peak index
tR
(min) Assay (%) purity Peak index
C/I (4) C/D (5)
Diluent - - -
-Disulide std (1) 10 µg/g 6.52 99.0 (3) 1.000 - - - -
-Captopril std (2) 500 µg/g 6.50 0.07 - 4.21 100.0 (3) 1.000 - 5.18
Captopril std 10 µg/g - - - 4.21 100.0 (3) 1.000 -
-Captopril CRM 500 µg/g 6.49 0.23 - 4.21 98.93 1.000 1.34 5.01
Disulide std + captopril CRM (10 + 500 µg/g) 6.52 96.82 1.000 4.21 - 1.000 -
-Disulide std + captopril std (10 + 500 µg/g) 6.48 97.65 1.000 4.21 - 1.000 -
-Captopril CRM under stress conditions:
80 °C - - 1.000 - - 0.980 -
-120 °C - - 0.982 - - 0.980 -
-140 °C - - 0.989 - - 0.987 -
-250 °C - - 0.927 - - 0.955 -
-1 mol/L HCl - 0.82 1.000 - 97.84 1.000 -
-1 mol/L NaOH - 0.44 1.000 - 97.27 1.000 -
-3% H2O2 - 2.67 1.000 - 88.42 1.000 -
-(1) Captopril disulide USP reference standard (2) Captopril USP reference standard
(3) According to USP reference standards certiicate
(4) Resolution between the peaks of captopril and the closest impurity (tR = 3.7 min)
(5) Resolution between the peaks of captopril and disulide
impurity. When captopril (Figure 4a) is dissolved in water, it oxidizes spontaneously at its sulfhydryl group, forming the disulide (Figure 4b) (Nishikawa et al., 2004). Addi-tionally, the captopril molecule has an amide function and
can undergo hydrolysis (Timmins, Jackson, Wang, 1982). The stability of solutions prepared for impurity analysis was therefore a critical parameter to be evaluated.
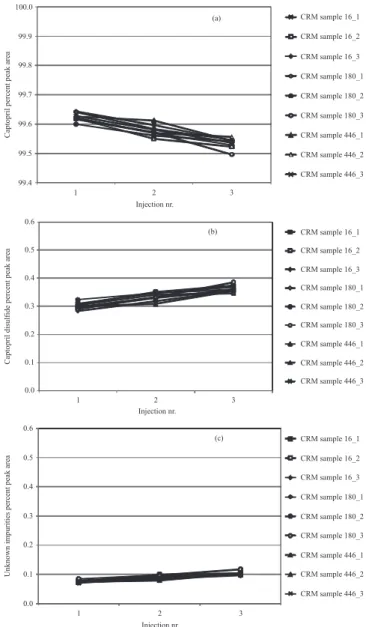
different lasks in triplicate, were analyzed in such a way that the intervals between two sequential injections of the same solution (1/2 and 2/3) were, on average, 5 hours. The captopril percent peak area reduced signiicantly between the irst and the third injections of each analyzed solution (Figure 5a), showing an increase in the percent peak areas of captopril disulide (Figure 5b) and of unknown impu-rities (Figure 5c).
Since the related substances test for captopril des-cribed in the Brazilian Pharmacopeia IV monograph is a limit test (maximum of 1% captopril disulide and 2% total impurities), even if increasing amounts of disulide and unknown impurities are formed, the raw material can still comply with this acceptance criteria. However, the characterization of the captopril CRM required an accurate determination of the organic impurities content, allowing the use of this result for the calculation of the captopril content by mass balance (eq. 1). Additionally, changes in peak areas are also a problem for method validation, especially for repeatability.
Therefore, the validation tests were performed using fresh solutions of captopril, prepared immediately before injection. This procedure signiicantly reduced captopril degradation as well as the corresponding formation of captopril disulide and unknown impurities in solution.
Linearity and working range
Linearity is the ability of the analytical method to produce results directly proportional to the analyte con-centration within a deined range (Inmetro, 2007).
Considering the instability of captopril in solution, the linearity tests were performed using: a) dilutions prepared from the same stock solution (higher risk of de-gradation) and; b) solutions prepared from different stock solutions, immediately prior to injection. Since no degra-dation was observed for the disulide reference standard, its dilutions were prepared from the same stock solution.
The linearity for captopril and captopril disulide
was initially evaluated in the concentration range of 0.01 to 500 µg/g. After determination of the limits of quantitation (LOQ), as described in the next section, the results below LOQ were disregarded. Additionally, the linearity was also evaluated in a narrower range between LOQ and 50 µg/g, which corresponds to the most appropriate concentration range for organic impurities in CRM samples (the limits of captopril disulide and total impurities in captopril samples are 1% and 2%, respectively, according to the Brazilian Pharmacopeia IV, which correspond to 5 µg/g and 10 µg/g for solutions containing 500 µg/g of captopril).
FIGURE 4 - Structural formulas of captopril (a) and of its main
impurity, captopril disulide (b).
FIGURE 5 – Percent peak areas of captopril (a), captopril
The statistics of the calibration curves are shown in Table II. All correlation coeficients complied with the acceptance criteria (r > 0.99 according to Ribani et al.
(2004), equivalent to r2 > 0.98). Therefore, the linearity
has been demonstrated.
Limit of detection (LOD) and limit of quantitation (LOQ)
The limit of detection (LOD) is the lowest analyte concentration that can be detected, but cannot be exactly quantiied, while the limit of quantitation (LOQ) is the lowest analyte concentration that can be quantiied with precision and accuracy (ICH, 1994).
The values of LOD and LOQ of captopril and
capto-TABLE II - Linearity evaluation for captopril disulide and captopril in two different concentration ranges (LOQ to 50 µg/g and
LOQ to 500 µg/g)
Captopril disulide Captopril (same stock solution) Captopril solutions prepared before (different stock injection)
Concentration range LOQ-500 µg/g LOQ-50 µg/g LOQ-500 µg/g LOQ-50 µg/g LOQ-500 µg/g LOQ-50 µg/g
Intercept (1) 7666.82 -3068.42 12075.10 1320.53 484.39 -1851.37
Slope (2) 13122.98 13368.82 10472.04 10707.37 11671.12 11656.76
r2(3) 0.999964 0.999763 0.999934 0.999995 0.999893 0.999278
n (4) 27 18 27 18 27 18
(1) Intercept “a” of the linear regression analysis curve y = bx + a (2) Slope “b” of the linear regression analysis curve y = bx + a (3) Squared correlation coeficient
(4) Number of measurements
TABLE III - Determination of limit of quantitation (LOQ) and limit of detection (LOD) for captopril disulide and captopril
Captopril disulide Captopril solution)(same stock Captopril solutions prepared before (different stock injection)
LOQ (µg/g) LOD (µg/g) LOQ (µg/g) LOD (µg/g) LOQ (µg/g) LOD (µg/g) Estimation from linearity data 0.3277 0.0983 0.2259 0.0678 0.2535 0.0760 Dilution series (1.00 - 0.01 µg/g)
Average - day 1 0.3461 0.1038
Average - day 2 0.3406 0.1022 - - -
-Average - day 3 0.3736 0.1121
Average days 1-3 0.3534 0.1060
SD (1) 0.0177 0.0053 - - -
-CV (%) (2) 5.01 5.01
(1) Standard deviation (2) Coeficient of variation
pril disulide were irst calculated from the linearity data. The estimated values for captopril disulfide were then conirmed by repetition of the experiments using a larger number of samples in the concentration range of 0.01 to 1.00 µg/g and the limits were determined according to the signal-to-noise ratio method (ICH, 2004).
Repeatability and intermediate precision
Repeatability is the degree of compliance between the results of successive measurements under the same analysis conditions (same procedure, analyst and equip-ment, analysis in a short time frame), while the reprodu-cibility evaluates the compliance between measurements under different analysis conditions (different analysts, equipment or laboratories) (Inmetro, 2007).
This reproducibility concept can be evaluated on two levels:
1. Intermediate precision: compliance between results from the same laboratory, albeit on different days and by different analysts (Anvisa, 2003).
2. Reproducibility: agreement between results from different laboratories, usually by means of interlaboratory studies (Anvisa, 2003), which is beyond the scope of this article.
Results for repeatability and intermediate precision are shown in Table IV. Repeatability was demonstrated by the small coeficients of variation (CV) of normalized peak areas and recoveries for six repeated injections of captopril and captopril disulide USP reference standard solutions (CV: 0.41-0.44% for captopril disulfide, 0.13-0.20%
for captopril). Intermediate precision was conirmed by single-factor analysis of variance (ANOVA) (Table V) using the recoveries from Table IV (results for two diffe-rent days, carried out by diffediffe-rent analysts). The calculated F values were smaller than the critical F values and the acceptance criteria were therefore fulilled.
Accuracy
Accuracy is the agreement between the result ob-tained and the reference value accepted as the true value. The accuracy evaluation can be performed by recovery tests, interlaboratory studies, use of reference materials (Inmetro, 2007) and comparison of results from different methods.
Recovery tests
The recovery studies were carried out using so-lutions of captopril disulide USP reference standard at concentrations of 7.5, 10.0 and 12.5 µg/g (75% to 125% of the total organic impurity limit of 10 µg/g), having 500 µg/g of captopril CRM or captopril USP reference standard (considered as matrixes) added or otherwise. Since these matrixes also contained small amounts of
TABLE IV - Repeatability and intermediate precision results for six replicate HPLC injections of captopril disulide and captopril
on two different days
Day-injection
Captopril disulide Captopril
Theoretical conc.
(µg/g) Area
Normalized peak area
(10 µg/g)
Real conc. (µg/g)
Recovery (%)
Theoretical conc.
(µg/g) Area
Normalized peak area
(10 µg/g)
Real conc. (µg/g)
Recovery (%)
1_1 10.97 143817 131089.21 10.55 96.19 10.28 125932 122452.18 10.76 104.59
1_2 10.97 143278 130597.91 10.51 95.81 10.28 126126 122640.82 10.77 104.75
1_3 10.97 142762 130127.58 10.47 95.45 10.28 125880 122401.61 10.75 104.55
1_4 10.97 142868 130224.20 10.48 95.52 10.28 125444 121977.66 10.71 104.19
1_5 10.97 142616 129994.50 10.46 95.35 10.28 125680 122207.14 10.73 104.38
1_6 1097 144068 131318.00 10.57 96.37 10.28 126053 122569.83 10.77 104.69
Average 130558.56 95.78 122374.87 104.53
CV % (1) 0.42 0.44 0.20 0.20
2_1 10.68 139523 130592.44 10.22 95.68 10.98 134529 122541.59 11.49 104.69
2_2 10.68 138921 130028.97 10.18 95.25 10.98 134376 122402.22 11.48 104.57
2_3 10.68 140125 131155.91 10.27 96.12 10.98 134220 122260.12 11.47 104.45
2_4 10.68 139315 130397.75 10.21 95.53 10.98 134628 122631.77 11.50 104.77
2_5 10.68 139047 130146.91 10.19 95.34 10.98 134682 122680.95 11.51 104.81
2_6 10.68 140326 131344.04 10.28 96.26 10.98 134430 122451.41 11.48 104.61
Average 130611.00 95.70 122494.68 104.65
CV % (1) 0.41 0.43 0.13 0.13
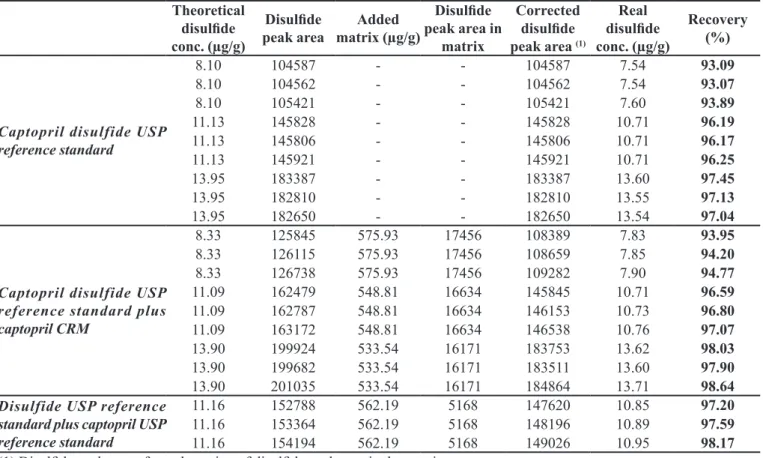
captopril disulide, they were individually analyzed, so that their captopril disulide peak areas could be subtracted before recovery calculation.
The results obtained can be seen in Table VI. The recovery of captopril disulide in the absence of matrixes was in the 93.1% to 97.4% range, while its recovery in the presence of matrixes was between 94.0% and 98.6%. These two ranges are comparable and both com-ply with the established acceptance criteria (recoveries between 90.0 and 110.0%), thus conirming the method accuracy.
Comparison between different methods
The use of different analytical methods is recom-mended to determine the purity of reference materials, in order to obtain metrologically accepted results (Duewer
et al., 2004). For characterization of a candidate certiied reference material in a single laboratory, two possible ap-proaches are presented by the ISO Guide 35:2006: 1) use of one primary method, which is a method that does not rely on the use of a “measurement standard for a quantity of the same kind” (JCGM, 2008), and; 2) combination of two independent secondary methods. The other procedu-res described by the cited ISO Guide require a network of laboratories.
The captopril contents determined by the following methods have been compared:
1. Assay of captopril by oxidation-reduction titration (iodometry) according to the assay method in the Brazilian Pharmacopeia IV monograph;
2. Differential scanning calorimetry (DSC) according to Moreira et al. (2010). This thermal method deter-mines the “degree of deviation from the expected behavior of an ideal 100% pure sample caused by
the presence of impurities that are more soluble in the material’s liquid phase than in its solid phase” (Duewer et al., 2004);
3. Mass balance according to eq. 1, after determination of impurities by RP-HPLC-DAD (organic impuri-ties), residue on ignition (inorganic impurities) and loss on drying (volatiles).
As can be seen in Table VII, the titration results for the captopril CRM were greater than 100% (100.04%, CV 0.32%, n = 24, analysis in triplicate) and therefore this technique, which is a primary method (Duewer et al.,
2004; Gorog, 2005), was not indicated for characterization and certiication of the captopril reference material. These results may be explained by the variability of titrimetric methods (Rodomonte, Montinaro, Bartolomei, 2006) and also by the non-speciicity of this technique (Gorog, 2005), since organic impurities usually contain a moiety of similar reactivity to that of the analyte (Duewer et al., 2004; Gorog, 2005).
The DSC can also be considered a primary method, even if in practice empirical corrections may be necessa-ry (Duewer et al., 2004). The captopril analysis by DSC demonstrated that the purity of analytes with a known im-purity proile, such as captopril CRM, can be determined equivalently by DSC and HPLC (Moreira et al., 2010). The captopril content by DSC was 99.65 ± 0.023% mol/mol, while the result obtained by mass balance was 99.565 ± 0.093% w/w (Table VII), thus indicating the accuracy of both methods.
Robustness
A method is considered robust when it is virtually insensitive to small variations (Inmetro, 2007). The
ro-TABLE V - Single-factor analysis of variance (ANOVA) of recoveries (Table IV) for intermediate precision evaluation
Source of
variation SS(1) df(2) Captopril disulideMS(3) F(4) p-value(5) F Captopril
crit(6) SS df MS F p-value Fcrit
Between
groups 0.0207 1 0.0207 0.1203 0.7359 4.9646 0.0455 1 0.0455 1.4668 0.2537 4.9646 Within
groups 1.7199 10 0.1720 0.3101 10 0.0310
Total 1.7405 11 0.3556 11
(1) Sum of squares (2) Degrees of freedom
(3) Mean square, estimated by the equation MS = SS/df
(4) Calculated F value according to the equation F = MSbetween/MSwithin
(5) If p-value > 0.05 (and F < Fcrit) , there is no signiicant difference between the two data groups
TABLE VI - Recoveries of captopril disulide in the presence of captopril matrixes for accuracy evaluation
Theoretical disulide conc. (µg/g)
Disulide
peak area matrix (µg/g)Added
Disulide peak area in
matrix
Corrected disulide peak area (1)
Real disulide conc. (µg/g)
Recovery (%)
Captopril disulfide USP reference standard
8.10 104587 - - 104587 7.54 93.09
8.10 104562 - - 104562 7.54 93.07
8.10 105421 - - 105421 7.60 93.89
11.13 145828 - - 145828 10.71 96.19
11.13 145806 - - 145806 10.71 96.17
11.13 145921 - - 145921 10.71 96.25
13.95 183387 - - 183387 13.60 97.45
13.95 182810 - - 182810 13.55 97.13
13.95 182650 - - 182650 13.54 97.04
Captopril disulfide USP reference standard plus captopril CRM
8.33 125845 575.93 17456 108389 7.83 93.95
8.33 126115 575.93 17456 108659 7.85 94.20
8.33 126738 575.93 17456 109282 7.90 94.77
11.09 162479 548.81 16634 145845 10.71 96.59
11.09 162787 548.81 16634 146153 10.73 96.80
11.09 163172 548.81 16634 146538 10.76 97.07
13.90 199924 533.54 16171 183753 13.62 98.03
13.90 199682 533.54 16171 183511 13.60 97.90
13.90 201035 533.54 16171 184864 13.71 98.64
Disulfide USP reference standard plus captopril USP reference standard
11.16 152788 562.19 5168 147620 10.85 97.20
11.16 153364 562.19 5168 148196 10.89 97.59
11.16 154194 562.19 5168 149026 10.95 98.17
(1) Disulide peak area after subtraction of disulide peak area in the matrix
TABLE VII - Comparison of captopril contents determined by different methods for accuracy evaluation
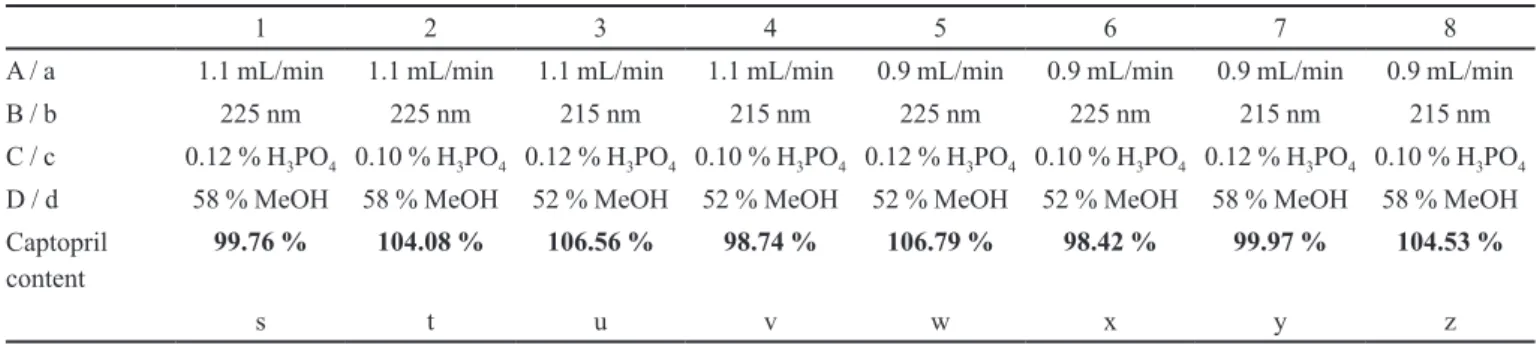
Mass balance (1) Titration DSC
99.565 % + 0.093 % (2) 100.04 % + 0.32 % (3) 99.650 % + 0.023 % mol/mol (3)
(1) According to eq. 1, using the following methods: RP-HPLC-DAD (organic impurities), residue on ignition (inorganic impurities) and loss on drying (volatiles). (2) Expanded measurement uncertainty (U). (3) Standard deviation
bustness test was planned according to Youden & Steiner (Inmetro, 2007) and the parameters evaluated were:
• Mobile phase low-rate (1 mL/min): “A” (1.1 ml/
min), “a” (0.9 mL/min);
• Detection wavelength (220 nm): “B” (225 nm), “b”
(215 nm);
• o-Phosphoric acid concentration in the aqueous
phase (mobile phase) (0.11% v/v): “C” (0.12% v/v), “c” (0.10% v/v);
• Methanol concentration in the organic phase (mobile
phase) (55% v/v): “D” (58% v/v), “d” (52% v/v). The captopril contents in the tested CRM solutions (10 µg/g) (s, t, u, v, w, x, y, z) under eight different expe-rimental conditions are shown in Table VIII.
The factors A, a, B, b, C, c, D and d were calculated by equations 2 to 9 (Inmetro, 2007).
A = (s + t + u + v) / 4 (eq. 2) B = (s + t + w + x) / 4 (eq. 3) C = (s + u + w + y) / 4 (eq. 4) D = (s + t + y + z) / 4 (eq. 5) a = (w + x + y + z) / 4 (eq. 6) b = (u + v + y + z) / 4 (eq. 7) c = (t + v + x + z) / 4 (eq. 8) d = (u + v + w + x) / 4 (eq. 9)
CONCLUSIONS
The results obtained in this study complied with the proposed acceptance criteria, and the RP-HPLC-DAD me-thod for determination of related substances of captopril was considered validated and accurate for quantiication of organic impurities, allowing the use of the mass balance approach for calculation of the captopril content in the captopril candidate CRM.
The observed instability of captopril in solution was resolved by using fresh captopril solutions, prepared immediately before injection into the HPLC system.
ACKNOWLEDGEMENTS
We are grateful for the support provided by “Cristá-lia Produtos Químicos e Farmacêuticos Ltda” and “Med-ley S. A. Indústria Farmacêutica”.
TABLE VIII - Captopril contents (s to z) determined under eight different experimental conditions for method robustness evaluation
1 2 3 4 5 6 7 8
A / a 1.1 mL/min 1.1 mL/min 1.1 mL/min 1.1 mL/min 0.9 mL/min 0.9 mL/min 0.9 mL/min 0.9 mL/min
B / b 225 nm 225 nm 215 nm 215 nm 225 nm 225 nm 215 nm 215 nm
C / c 0.12 % H3PO4 0.10 % H3PO4 0.12 % H3PO4 0.10 % H3PO4 0.12 % H3PO4 0.10 % H3PO4 0.12 % H3PO4 0.10 % H3PO4
D / d 58 % MeOH 58 % MeOH 52 % MeOH 52 % MeOH 52 % MeOH 52 % MeOH 58 % MeOH 58 % MeOH Captopril
content 99.76 % 104.08 % 106.56 % 98.74 % 106.79 % 98.42 % 99.97 % 104.53 %
s t u v w x y z
TABLE IX - Youden and Steiner parameters for method
robustness
Captopril contents (1) Differences Robustness
A (%) a (%) A – a (%) Robust
102.28 102.43 -0.15
B (%) b (%) B – b (%) Robust
102.26 102.45 -0.19
C (%) c (%) C – c (%) Robust
103.27 101.44 1.83
D (%) d (%) D – d (%) Robust
102.09 102.63 -0.54
Average (%) 102.36 SD (2) 0.51
CV (%) (3) 0.50 (1) According to eq. 2 to eq. 9 (2) Standard deviation (3) Coeficient of variation
REFERENCES
ASSOCIAÇÃO BRASILEIRA DE NORMAS TÉCNICAS/ INSTITUTO NACIONAL DE METROLOGIA, NORMALIZAÇÃO E QUALIDADE INDUSTRIAL. Guia para a expressão da incerteza de medição. 3.ed. (revisada). Rio de Janeiro: ABNT/Inmetro, 2003. 120 p.
ASSOCIAÇÃO BRASILEIRA DE NORMAS TÉCNICAS. ABNT NBR ISO/IEC 17025:2005. Requisitos gerais para competência de laboratórios de ensaio e calibração. Rio de Janeiro: ABNT, 2005. 31 p.
AGÊNCIA NACIONAL DE VIGILÂNCIA SANITÁRIA. Resolução-RE Nº 899 de 29 de maio de 2003. Guia para validação de métodos analíticos e bioanalíticos. Diário Oicial da União, Brasília, DF, 02 de junho de 2003. p.56-59. Available at: <http://www.in.gov.br/imprensa/visualiza/ index.jsp?jornal=1&pagina=56&data=02/06/2003>. Accessed on: 17 may 2010.
DUEWER, D.L.; PARRIS, R.M.; WHITE, E.V.; MAY, W.E.; ELBAUM, H. An approach to the metrologically sound traceable assessment of the chemical purity of organic reference materials. National Institute of Standards and Technology special publication 1012. Gaithersburg: National Institute of Standards and Technology (NIST), 2004. 53 p.
FARMACOPEIA BRASILEIRA. 4.ed. São Paulo: Atheneu, 2002. pt.2. p.181. (captopril)
GOROG, S. The sacred cow: the questionable role of assay methods in characterizing the quality of bulk
pharmaceuticals. J. Pharm. Biomed. Anal., v.36, n.5,
p.931-937, 2005.
HOFER, J.D.; OLSEN, B. A.; RICKARD, E. C. Is HPLC assay
for drug substance a useful quality control attribute? J.
I N S T I T U T O N A C I O N A L D E M E T R O L O G I A , NORMALIZAÇÃO E QUALIDADE INDUSTRIAL. DOQ-CGCRE-008. Orientação sobre a validação de métodos de ensaios químicos. rev. 02. Rio de Janeiro, 2007. 24 p. Available at: <http://www.inmetro.gov.br/ Sidoq/Arquivos/CGCRE/DOQ/DOQ-CGCRE-8_02.pdf.>. Accessed on: 01 jul. 2009.
INTERNATIONAL CONFERENCE ON HARMONISATION O F T E C H N I C A L R E Q U I R E M E N T S F O R REGISTRATION OF PHARMACEUTICALS FOR HUMAN USE (ICH). ICH harmonised tripartite guideline. Validation of Analytical Procedures: text and methodology. Q2(R1). Current Step 4 version. Parent Guideline dated 27 October 1994. Complementary Guideline on Methodology dated 6 November 1996 incorporated in November 2005. Available at: <http://www.ich.org/LOB/media/MEDIA417. pdf.>. Accessed on: 01 jul. 2009.
I N T E R N AT I O N A L O R G A N I Z AT I O N F O R STANDARDIZATION. ISO Guide 34. General requirements for the competence of reference material producers. Geneve, 2009. 34 p.
I N T E R N AT I O N A L O R G A N I Z AT I O N F O R STANDARDIZATION. ISO Guide 35. Reference materials - general and statistical principles for certiication. Geneve, 2006. 64 p.
JOINT COMMITTEE FOR GUIDES IN METROLOGY (JCGM). International vocabulary of metrology: basic and general concepts and associated terms (VIM). JCGM 200:2008. 3.ed. Sèvres (France): BIPM, 2008. 90 p. Available at: <http://www.bipm.org/utils/common/ documents/jcgm/JCGM_200_2008.pdf.>. Accessed on: 26 jun. 2010.
LABORATORY OF THE GOVERNMENT CHEMIST (LGC) STANDARDS. Pharmaceutical reference substances and impurities 2010 / 2011. Teddington, 2010. 421 p. Available at: <http://lgcstandards.com/media/559600807.pdf.>. Accessed on: 29 sep. 2010.
MOREIRA, G.F.; BALBO, A.; ACHETE, C.A.; BARIN, J.S.; WOLLINGER, W., NOGUEIRA, R.; BITTENCOURT, C.F.; RODRIGUES, J. M. Aplicação da calorimetria exploratória diferencial (DSC) para determinação de pureza
de fármacos. P&P, v.11, n.1, p.22-29, 2010.
NISHIKAWA, T.; ABE, R.; SUDO, Y.; YAMADA, A.; TAHARA, K. HPLC profile of captopril disulfide that undergoes reversible cis-trans conversion among three
isomers. Anal. Sci., v.20, n.10, p.1395-1398, 2004.
NOGUEIRA, R.; REGO, E.C.P.; SOUSA, M.V.B.; WOLLINGER, W.; SILVA, T.E.; MOREIRA, G.F.; BARIN, J.S.; LAPORTA, L.V.; MESKO, M.F.; BITTENCOURT, C.F.; CAIXEIRO, J.M.R.; CUNHA, V.S. Development
studies of captopril certiied reference material. Braz. J.
Pharm. Sci., v.47, n.2, p.339-350, 2011.
RIBANI, M.; BOTTOLI, C.B.G.; COLLINS, C.H.; JARDIM, C.S.F.; MELO, L.F.C. Validação em métodos
cromatográicos e eletroforéticos. Quim. Nova, v.27, n.5,
p.771-780, 2004.
RODOMONTE, A.L.; MONTINARO, A.; BARTOLOMEI, M. Uncertainty evaluation in the chloroquine phosphate potentiometric titration: application of three different
approaches. J. Pharm. Biom. Anal., v.42, n.1, p.56-63, 2006.
STULZER, H.K.; TAGLIARI, M.P.; KUMINEK, G.; OLIVEIRA, P.R.; BERTOL, C.D.; SILVA, M.A.S. Development and validation of stability indicating LC method for quantify captopril in tablets of controlled
release. Chromatographia, v.69, suppl.2, p.S123-S128,
2009.
THE UNITED STATES PHARMACOPEIA. USP 32 / NF 27. Rockville: The United States Pharmacopeial Convention, 2009. p.236.
THE UNITED STATES PHARMACOPEIAL CONVENTION. Available at: <http://www.usp.org>. Accessed on: 21 apr. 2010.
TIMMINS, P.; JACKSON, I.M.; WANG, Y.J. Factor affecting
captopril stability in aqueous solution. Int. J. Pharm., v.11,
n.4, p.329-336, 1982.
WILLIAMS, R.L.; PROJECT TEAM 4. Oficial USP reference standards: metrology concepts, overview, and scientiic
issues and opportunities. J. Pharm. Biomed. Anal., v.40,
n.1, p.3-15, 2006.
Received for publication on 14th May 2010