http://dx.doi.org/10.1590/s2175-97902017000215154
A
r
*Correspondence: Sriparna Datta. Department of Chemical Technology. Division of Pharmaceuticals and Fine Chemical Technology. University Col-lege of Science and Technology. University of Calcutta. 92, A. P. C. Road, Kolkata, 700 009 - West Bengal, India. E.mail: [email protected], [email protected]
A comparative study of two separate analytical techniques for the
simultaneous determination of diclofenac sodium and diacerein
from combined dosage form
Sanhita Basu Mallick
1, Helen Chattopadhyay
1, Amit Kumar De
2, Sriparna Datta
1,*1Department of Chemical Technology, Division of Pharmaceuticals and Fine Chemical Technology, University College of Science and Technology, University of Calcutta, West Bengal, India, 2Dey’s Medical Stores (Mfg.) Ltd., West Bengal, India
Diclofenac sodium (DS) and diacerein (DC) have emerged as a potential combination therapy for the treatment of knee osteoarthritis. Therefore a validated analytical method is essential for the simultaneous estimation of both from combined dosage form. A ratio derivative spectrophotometric and a chromatographic technique have been developed for the simultaneous determination of DS and DC.
The quantiication was done at 263.00 nm for DC and 304.50 nm for DS in the irst method, whereas 257 nm for DC and at 274 nm for DS for LC-DAD analysis in chromatographic method using acetate bufer and methanol as the mobile phase at a low-rate 0.50 mL/min. Both of these methods are found to be linear in the concentration range under study with r2 value 0.999 and 0.996 for DS and DC respectively in ratio derivative spectroscopy and 0.998 and 0.999 for DS and DC respectively in LC-DAD study. Both of these methods are found to be accurate and precise, though greater robustness and precision is
observed with chromatographic analysis over the ratio derivative spectroscopy. Statistically there was no signiicant diference between proposed ratio derivative spectrophotometric and LC-DAD methods.
Uniterms: Diacerein/comparative study. Diclofenac sodium/comparative study. High Pressure Liquid Chromatography. LC-DAD. Ratio derivative spectroscopy/validation
INTRODUCTION
Diacerein (DC), chemically 4,5-diacetoxy-9,10-dihydro-9,10-dioxo-2- anthracenecarboxylic acid (Figure 1A), is an anti-osteoarthritic (Bartelsyz et al., 2010; Fidelix et al., 2014) drug usually prescribed for the treatment of symptomatic osteoarthritis of knee (Louthrenoo et al., 2007; Zheng et al., 2006). It is a puriied
anthraquinone and on absorption it is entirely transformed into rhein, an active metabolite found in plasma and synovial luid. DC deines a new class of anti-osteoarthritic drug known as “disease modifying osteoarthritis drug” (DMOAD) or “chemoprotective agent” (Verbruggen, 2006; Pelletier, Martel-Pelletier, 2007). It is found to have novel anti-inlammatory properties diferent from classical nonsteroidal anti-inlammatory agents that support its use
in combination with nonsteroidal anti-inlammatory drugs (NSAID) for the treatment of osteoarthritis including rheumatoid osteoarthritis (Tamura et al., 2002). Recently it has been found to reduce visceral pain through inhibition of glutamatergic neurotransmission and cytokine signaling in mice (Gadotti et al., 2012).
and rheumatoid arthritis, inflammations, soft tissue disorders like sprains and several other pathophysiological conditions like acute gout, dysmenorrhea, migraine and even after certain surgical procedures (Zhang et al., 2014).
A recent report presents that the use of DC as an adjuvant to DS improves the therapeutic profile in osteoarthritic knee compared to DS alone (Singh, Sharma, Rai, 2012). Thus a combination of these two drugs forms a newer therapeutic regimen. Here in lies the need for the development of validated and sensitive analytical procedures for the simultaneous estimation of both DC and DS from such formulations.
The ratio derivative spectrophotometry (RDS) is a good analytical technique of great utility for extracting quantitative information from spectra of unresolved bands. In this RDS method the zero-order spectrum for a mixture is divided by the divisor standard spectra of each analyte followed by derivatization and hence the spectrum becomes independent of the other analyte concentration. The use of standardized spectra as divisors minimizes experimental errors and background noise. Easy measurements of separate peaks, higher values of the analytical signals are advantages of ratio derivative spectrophotometry. The presence of a lot of maxima and minima in ratio derivative spectra seems to be advantageous for the method, since these wavelengths give an opportunity for the determination of these compounds in the presence of other active compounds and excipients that may interfere.
High Pressure Liquid Chromatography (HPLC) is used in analytical chemistry or biochemistry to separate chemical compounds in mixtures for analysis or puriication or quantiication from a binary mixture. In this method the sample mixture is pressurized through a column illed with a solid adsorbent material, where each component in the sample interacts slightly diferently with the adsorbent material, causing diferent low rates for the diferent components and leading to the separation of the components as they low out the column.
The review of the literature showed the presence of both spectrophotometric methods (Baghel, Dhiman, 2012; Nebsen et al., 2011; Pandey et al., 2012; Sivakumar
et al., 2010) and chromatographic techniques (Ali et al., 2014; Ashok et al., 2009; Hamrapurkar et al., 2011; Patel
et al., 2014; Sivakumar et al., 2010) for the estimation of DC from diferent formulations in presence of NSAIDs (Baghel, Dhiman, 2012), impurities (Ashok et al., 2009) and its corresponding metabolites from human serum (Ojha, Rathod, Padh, 2009). For the quantiication of DS the pharmacopoeias present its non-aqueous titration in bulk forms and chromatographic procedures for various
formulations (Dahivelkar et al., 2012). Other techniques include mainly spectrophotometric (Botello, Perez-Caballero, 1995) and chromatographic procedures (Abdel-Hamid, Novotny, Hamza, 2001; Carreira et al., 1995; Ji,
Zhan, 2000; Kaale et al., 2013; Thongchai et al., 2006) for
analyzing the drugs individually.
However, extensive literature survey fails to present a rapid and selective spectroscopic analysis and chromatographic procedure for the simultaneous estimation of both these drugs from their combined dosage form. In the current study we present a simple, rapid, sensitive and validated spectroscopic method and a precise and validated chromatographic procedure based on LC-DAD technique for the estimation of both of these drugs in combined dosage from.
MATERIAL AND METHODS
Material
Diacerein (DC) was procured from Biogen Extracts Pvt. Ltd. (Bangalore, India) and diclofenac sodium (DS) was obtained as a gift sample from Dey’s Medical Stores (Mfg.) Ltd. (Kolkata, India), Carbopol 934 (CDH) and triethanolamine (Merck) were purchased from local supplier. HPLC grade solvents like acetonitrile, methanol and water were purchased from Spectrochem India Ltd. All other salts and reagents were of guaranteed reagent grade and were purchased from Merck India Ltd. A C18 column 250 mm x 4.6 mm (Atlantis T3) was purchased from Water’s Corporation (Millford, USA).
Methods
Preparation of drug loaded transdermal gel
The gel was prepared by dispersing 500 mg of carbopol in definite amount of water very slowly with constant stirring. Then drug solution (3.5 mg/mL of each in water) was added, followed by 2.5 g chloroform and distilled water to make the 25 g gel. The pH of the gel was brought to skin pH by adding 500 mg triethanolamine. During pH adjustment, the mixture was stirred gently until the formation of homogeneous gel. The product was allowed to stand for 24 hours at room temperature before further studies (Karade et al., 2012).
Procedure for ratio derivative spectroscopy
nm for standard and sample solutions against phosphate bufer (pH 7.4) as blank.
For sample solution, 1.0 g of the transdermal gel preparation was accurately weighed and transferred to a 50ml volumetric lask. 30 ml of the bufer pH 7.4 and 5 mL of methanol were added and the mass was sonicated for 1hr, allowed to cool to room temperature and the inal volume was made up with the bufer. It was centrifuged at 8000 rpm for 25 minutes and the supernatant was diluted suitably to obtain a inal concentration of 20 µg/mL for both DC and DS.
A study of variables like concentration of the standard spectrum divisor, number of points for the smoothing function and Δλ were necessary for the simultaneous determination of DS and DC using first derivative ratio spectroscopy in order to optimize the signal of the ratio derivative spectra with good selectivity and higher sensitivity (Rote, Bari, 2009). Concentrations of 5µg /mL of DC (DC5) and 6 µg /ml of DS (DS6) were selected as divisor concentration. The divisor concentration was chosen to minimize the background noise and experimental error. The saved spectrums of DC were divided with spectra of selected DS divisor spectra to get ratio spectra of DC and that of DS with DC divisor spectra to get the ratio spectra of DS. A Δλ=5 was chosen as optimum to minimize the background noise. The irst order derivative of all the ratio spectra of DC and DS were done with Δλ=5.
R D S a n a l y s i s w a s d o n e u s i n g U V 1 8 0 0 spectrophotometer (Shimadzu Corporation, Kyoto, Japan) and UV Probe Software, Version 2.42 (Shimadzu Corporation, Kyoto, Japan).
Procedure forLC-DAD analysis
DC and DS (1000 µg/mL) stock solutions were prepared by dissolving each working standard having known purity in 25ml of mobile phase. Diferent dilutions of these stock solutions were taken for preparation of linearity curve and working standard solutions for the purpose of validation.
For sample solution, 1.0 g of the prepared transdermal gel was carefully weighed and transferred to a 50ml volumetric lask. 35 mL of the mobile phase were added and sonicated for 1hr, allowed to cool to room temperature and inally the volume was made up to 50 mL. The inal solution was centrifuged at 8000 rpm for 25 minutes and supernatant was diluted properly to obtain a inal solution having a concentration of 20 µg/mL of each, DC and DS.
The mobile phase was a mixture of 35% of 0.2 M sodium acetate solution and 65% methanol at a low rate of 0.50 mL per minute. The mobile phase and samples were iltered through 0.2µm membrane ilter before each
use. DC and DS concentrations were determined using the external standard calibration curve.
HPLC was performed by using Waters high pressure gradient HPLC module consisting of two Waters 515 pumps (Milfold, MA, USA) and 2996 PDA detector (Milfold, MA, USA). The data analysis and procurement were carried out using Waters Empower 2 software (Milfold, MA, USA).The column Atlantis T3 C18 (particle size 5 µm, 4.6 mm internal diameter × 250 mm length) was used for the separation purpose and kept at room temperature using the detection wavelength 257 nm for DC and 274 nm for DS.
Method validation
The analytical method was validated as per ICH guidelines. The studied parameters were specificity, accuracy, precision, linearity, range, robustness and system suitability studies. The linearity of the method was established by analyzing standard solutions in triplicate.
To ensure reliability and accuracy of the proposed method, recovery studies were carried out by mixing a known quantity of the standard solution with the pre-analyzed samples at three diferent levels (80%, 100% and 120% of assay value) and were reanalyzed using the proposed method.
Precision of the method was measured on the basis of repeatability. For LC-DAD method the repeatability was measured on the basis of six replicate injections of the 20µg/ml of each (DC and DS) solutions keeping the concentration of one component fixed at each concentration of the sample on the same day. The intra-day precision was calculated using six injections at the higher concentration on the same day. This study was repeated on three consecutive days to obtain the inter-day precision. The intermediate precision was obtained by triplicate injection of the sample solution on three diferent days.
The RDS method followed the same protocol mentioned for the LC-DAD analysis. For RDS the scanning range for the experimental solutions was 200-600 nm.
The limit of detection (LOD) and the limit of quantitation (LOQ) were determined using the equations presented as follows.
;
where denotes standard deviation of Y-intercepts, and S denotes slope of the linearity curve
helps to measure accurately the analyte signal in presence of the potent excipients in formulation. The blank gel solution was used as placebo solution for this purpose and was analyzed by both of the proposed methods.
Statistical Analysis
The statistical analysis was carried out using Sigma Plot 10.0 (SSPS Inc., USA) and Microsoft Oice Excel 2010. Each analysis was carried out in three replicates.
RESULTS AND DISCUSSION
Ratio Derivative Spectrum analysis
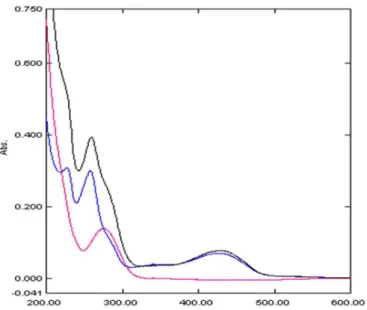
In RDS both, the standard and the sample solutions were scanned between 200 nm to 600 nm. The absorbance maxima of zero order spectrums for DC and DS were observed at 258 nm and at 275 nm respectively. The absorption spectra of DS and DC presented strong overlapping over the range of 250 nm-300 nm (Figure 2). The zero-order spectrum of the mixture provides accurate quantiication of DC at 258 nm only from the mixture, but not DS. In order to improve accuracy in quantiication of DS, ratio derivative analysis was carried out.
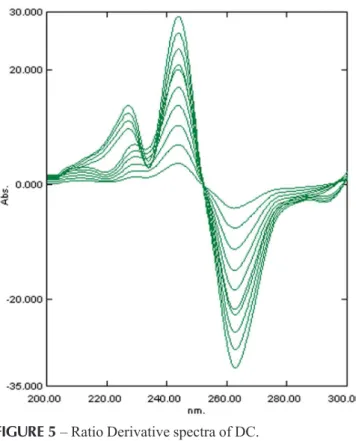
The concentrations of the drugs were calculated from their corresponding regression equations (Equations 1, 2) measuring the intensity of the signals of the ratio derivative spectrum (Figure 3 and 4). Wavelength 304.50 nm was selected for the quantiication of DS and 263.00 nmwas selected for the quantiication of DC in formulation containing both (Figure 5 and 6). Measured analytical
signals at these wavelengths were found to be proportional to the concentrations of these drugs.
y = 1.965x + 0.156 for DS Equation 1
y = 3.054x + 0.464 for DC Equation 2
FIGURE 4 - Ratio spectra of DS by DC5. FIGURE 3 - Ratio spectra of DC by DS6.
FIGURE 2 - Zero order spectrum of DC (blue), DS (red) and
order to study any co-elution. The LC-DAD analysis revealed the peak to be pure and spectrally homogenous with peak purity angle 0.319 being less than the peak purity threshold 0.459 for DS and for DC 0.327 and 0.451 respectively. The average retention time of DC peak was 3.81 ± 0.05 minutes (± S.D.; n=3) and for DS was 9.22 ± 0.11 minutes. A reasonable resolution between the DC and DS peaks was observed in the sample (Figure 7). The peaks were symmetrical and well resolved.
Validation of the developed methods
T h e R a t i o D e r i v a t i v e m e t h o d a n d l i q u i d chromatographic method were validated as per ICH (Q2/ R1) guidelines and the various parameters were evaluated, which are presented as follows.
Linearity and sensitivity (LOD and LOQ)
In case of RDS analysis the method was found to be linear in the concentration range 1-10 µg/mL for both DC and DS with r2 value 0.999 for DS and 0.996 for DC. The LOD and LOQ for DC were 0.361 µg/ml and 0.975 µg/ml and for DS 0.257 µg/mL and 0.444 µg/mL, respectively (Millership, Parker, Donnelly, 2005).
For LC-DAD analysis the linearity concentration region was observed in the range of 5.0 to 40.0 µg/mL. An area versus concentration curve was drawn with the concentration on X- axis and the peak area on the Y-axis. The linear regression parameters were slope 99609 and Y- intercept 99070 at 95% conidence interval (p<0.0015) for DC and slope 44032 and Y- intercept 26445 at 95% conidence interval (p<0.0011) for DS. The correlation coefficient r2was 0.999 for DC and 0.998 for DS. A statistical residual analysis was performed for each point of concentration range corresponding to the diference between the estimated and the mean concentrations. The residual plot analysis demonstrated that the residual values were randomly distributed around the zero value. This conirms the choice of linear model (Snyder, Kirkland, Glajach, 1997).The sensitivity of the method was evaluated on the basis of LOD and LOQ values which were 1.98 µg/mL and 6.01 µg/mL respectively for DS and 3.28 µg/mL and 9.95 µg/mL respectively for DC (Table I ).
Precision
For both RDS and HPLC analysis the precision of the method was analyzed on the basis of repeatability as presented in Table I. The intra-day and inter-day precision values were calculated from the linearity curve and the observed % RSD value was < 2.0 (Ahuja, Scrypinski, 2001; Snyder, Kirkland, Glajach, 1997) (Table I). The FIGURE 6 - Ratio derivative spectra of DS.
FIGURE 5 – Ratio Derivative spectra of DC.
LC-DAD Analysis
obtained intra-day % RSD values were higher than that of the inter-day values although both are in acceptable range. Therefore the results suggest that both the method is more precise in case of inter-day study than the intraday study.
Accuracy
The accuracy of a method is deined as a percentage of systematic error and was calculated as the deviation agreement between the measured value and the true value (Snyder, Kirkland, Glajach, 1997). In our study, the accuracy was determined on the basis of recovery study for both the analytical methods.
For RDS analysis RSD% of 0.145 for DC and 0.526 for DS was observed (Table II) (Millership, Parker, Donnelly, 2005). At three diferent levels – 80%, 100% and 120%. Therefore the results established a satisfactory level of accuracy.
The analysis results revealed a recovery of 99.50% to 100% with a RSD % of 0.45 for DC and 99.00% to 101.00% for DS with RSD% of 0.90 for LC-DAD analysis (Table III). These results also ensured the accuracy of the method.
Robustness
The robustness was tested in order to evaluate the variation of analytical result due to deliberate changes in analytical conditions. The changes in operational
parameters (change in person) did not lead to signiicant changes in the result. The response determined in the robustness test is the percentage of the drug in relation to the nominal amount of sample and the percent variation between them was 0.96% for DC and 0.95% for DS in spectroscopic analysis and 0.97% for DC and 0.98% for DS in chromatographic analysis. The results of robustness study for both the methods established their acceptability (Millership, Parker, Donnelly, 2005).
Specificity
The results obtained from both proposed methods for the placebo and the standard solutions were compared. The specificity with regard to other co-eluting components of DC and DS were separately investigated in HPLC. Sufficient resolution between DS and DC peak were observed under optimized chromatographic conditions (Figure 7). In all cases the purity angle was less than the peak purity threshold indicating the absence of any co-eluting peaks. The resolution factor between the DC and DS peaks in the chromatogram of the sample was 4.81 (Table I).
System Suitability
System suitability study was carried out for the chromatographic analysis only. The approximate results were theoretical plates (N = 12356 for DC and 26359 for FIGURE 7 - Representative chromatograms of DC at 257 nm (A) and DS at 274 nm (B), chromatogram of DC from sample
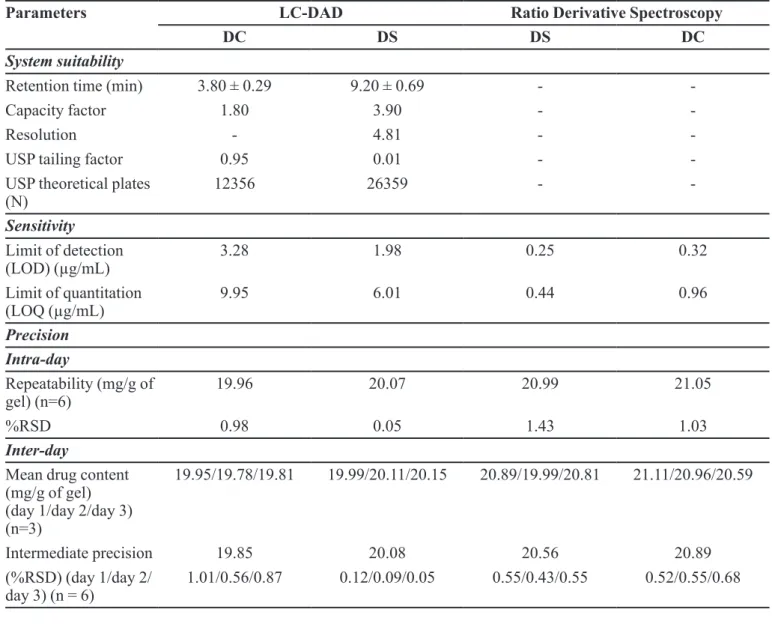
TABLE I - Validation data for the estimation of DC and DS from transdermal gel preparation based on LC-DAD and Ratio derivative
spectroscopic analysis
Parameters LC-DAD Ratio Derivative Spectroscopy
DC DS DS DC
System suitability
Retention time (min) 3.80 ± 0.29 9.20 ± 0.69 -
-Capacity factor 1.80 3.90 -
-Resolution - 4.81 -
-USP tailing factor 0.95 0.01 -
-USP theoretical plates (N)
12356 26359 -
-Sensitivity
Limit of detection (LOD) (µg/mL)
3.28 1.98 0.25 0.32
Limit of quantitation (LOQ (µg/mL)
9.95 6.01 0.44 0.96
Precision Intra-day
Repeatability (mg/g of
gel) (n=6) 19.96 20.07 20.99 21.05
%RSD 0.98 0.05 1.43 1.03
Inter-day
Mean drug content (mg/g of gel) (day 1/day 2/day 3) (n=3)
19.95/19.78/19.81 19.99/20.11/20.15 20.89/19.99/20.81 21.11/20.96/20.59
Intermediate precision 19.85 20.08 20.56 20.89
(%RSD) (day 1/day 2/
day 3) (n = 6) 1.01/0.56/0.87 0.12/0.09/0.05 0.55/0.43/0.55 0.52/0.55/0.68
TABLEII - Table for accuracy study DC and DS for ratio derivative spectroscopy analysis
Average Theoretical concentration
of sample solution (µg/mL)
Solution (%)
Theoretical Concentration
from spiked solution (µg/mL)
Theoretical excess amount
added (µg/mL)
Average actual assay from
sample solution (µg/mL)
Assay from spiked solution (µg/mL)
Observed excess amount (µg/mL)
Recovery
diferrence
(µg/mL)
Accuracy
(%) %RSD
DC 19.99
80.0 15.99 4.00
20.14
15.90 4.24 0.24 99.45
0.145
100 21.99 2.00 21.90 2.08 0.08 99.62
120 23.99 4.00 23.92 4.21 0.21 99.74
DS 20.01
80.0 16.01 4.00
20.03
15.76 4.27 0.27 98.45
0.526
100 22.01 2.00 21.89 2.14 0.14 99.50
DS), capacity factor (k =1.80 for DC and 3.90 for DS),
peak asymmetry or tailing factor (t =0.95 for DC and 0.01
for DS). The values for these parameters were satisfactory in accordance with the literature (Snyder, Kirkland, Glajach, 1997) (Table I).
Solution stability
The prepared solution was evaluated after 7 days and found to be stable only when kept at 4 °C.
Comparison between UV and HPLC method
Both proposed analytical techniques were compared using statistical analysis.
The F-test was applied to determine whether one
population is more variable than another in relative standard deviations (repeatability). Referring to the table of F against 1 degree of freedom (d.f) for between mean square and16 d.f for within mean square, we ind a value 4.49 at 5% level of signiicance. Since the value 1.0003 for F obtained in the present experiment which is far below than the recorded value 4.49, we conclude that the difference between the methods is highly insignificant (p>0.05).
The t-test was applied to determine whether or not
there is a statistically signiicant diference between the mean assay values of two proposed methods. The obtained results were 0.917 and 1.59, for DC and DS respectively, well below the tabled value (2.776) at 95% conidence level.
The calculated F-values and t-values were found
to be less than the critical values at 5% signiicance level (4.49 and 2.776 respectively).
The LOD and LOQ values for both methods suggested that the RDS method was more sensitive than
LC-DAD method. But the regression values helped to predict the determination of DC more accurately by LC-DAD analytical method whereas DS was determined more accurately by RDS method. The RDS technique is simpler, economic, need lesser time and suicient samples can be done within a day compared to LC-DAD method. But LC-DAD analysis method was more precise, speciic and robust than the RDS method.
Therefore the study represented the fact that the RDS method was more accurate and sensitive whereas the LC-DAD analysis was more precise. So, the RDS method and the chromatographic method can be claimed as unique and novel approach for the simultaneous determination of these two drugs in a combined dosage form. Thus the developed new methods will deinitely help in analysis of this combined drug product.
CONCLUSION
The study presents two simple, selective and sensitive methods for the quantiication of both Diacerein and Diclofenac sodium from their combined dosage form. The reliability of the methods is relected from the validation parameters. Statistical studies revealed that there were no signiicant diferences among the proposed methods. However, it appears that the ratio derivative spectrophotometric method is more simple, economic and accurate compared to the chromatographic method although a higher precision can be observed in the latter method.
ACKNOWLEDGEMENTS
Kind acknowledgements to University of Calcutta for providing facility for carry out the work. The authors
TABLEIII - Table for accuracy study DC and DS for chromatographic analysis
Average Theoretical concentration of sample solution (µg/mL) Solution Theoretical concentration from spiked solution (µg/mL) Theoretical excess amount added (µg/mL) Average actual assay from sample solution (µg/mL) Assay from spiked solution (µg/mL) Observed excess amount (µg/mL) Recovery diference (µg/mL) Accuracy (%) %RSD DC 19.99
80.0% 15.99 4.00
19.96
15.91 4.05 0.05 99.50
0.45
100% 21.99 2.00 21.96 2.00 0.00 100.00
120% 23.99 4.00 23.92 3.96 0.04 99.71
DS 20.01
80.0% 16.01 4.00
20.07
16.03 4.04 0.04 101.00
0.90
100% 22.01 2.00 22.05 1.98 0.02 99.00
also acknowledge the invaluable support of Prof. (Dr.) Arup Mukherjee for the successful completion of the work. The authors also thank Dey’s Medical Stores (Mfg.) Ltd. for their invaluable support and providing diclofenac sodium sample.
CONFLICT OF INTEREST
The authors disclose no conlict of interests.
REFERENCES
ABDEL-HAMID, M.E.; NOVOTNY, L.; HAMZA, H.
Determination of Diclofenac sodium, flufenamic acid, indomethacin and Ketoprofen by LC-APCI-MS. J. Pharm. Biomed. Anal., v.24, n.4, p.587-594, 2001.
AHUJA, S.; SCRYPINSKI, S. Hand book of modern
pharmaceutical analysis. Amsterdam: Academic press,
2001. p.415-442.
ALI, N.W.; ABDELWAHAB, N.S.; ABDELKAWY, M.; EMAM, A.A. Validated stability indicating
TLC-densitometric method for the determination of diacerein. J. Chromatogr. Sci., v.52, n.1, p.5-11, 2014.
ASHOK, C.; GOLAK, M.; ADWAIT, D.; KRISHNA, V.; HIMANI, A.; UMESH, P.; AMOL, G.; SRINIVAS, S.; SHARAD, M.; DEEPALI, J.; ATUL, C. Isolation and structural elucidation of two impurities from adiacereinbulk
drug. J. Pharm. Biomed. Anal., v.49, n.2, p.525-528, 2009.
BAGHEL, U.S.; DHIMAN, V. Exploring the application of
hydrotropic solubilization phenomenon for estimating diacerein in capsule dosage form by spectrophotometry methods. Asian Pac. J. Trop. Biomed., v.2, p.S1720-S1727, 2012.
BARTELSYZ, E.M.; BLIDDALYX, H.; SCHONDORFFY, P.K.; ALTMANK, R.D.; ZHANG, W.; CHRISTENSENY,
R. Symptomatic efficacy and safety of diacerein in the treatment of osteoarthritis: a meta-analysis of randomized placebo-controlled trials. Osteoarthritis Cartilage, v.18,
n.3, p.289-296, 2010.
BOTELLO, J.C.; PEREZ-CABALLERO, G. Spectrophotometric determination of diclofenac sodium with methylene blue.
Talanta, v.42, n.1, p.105-108, 1995.
CARREIRA, L.A.; RIZK, M.; EL-SHABRAWY, Y.; ZAKHARI,
N.A.; TOUBAR, S.S. Europium(III)ion probe spectro
luorometric determination of diclofenac sodium. J. Pharm. Biomed. Anal., v.13, n.11, p.1331-1337, 1995.
DAHIVELKAR, P.P.; BHOIR, S.I.; BARI, S.B.; SURANA, S.J.; BHAGWAT, A.M. Simultaneous determination of
diclofenac potassium and drotaverine hydrochloride in human plasma using reversed-phase high-performance liquid chromatography. J. Chromatogr Sci., v.50, n.8,
p.694-701, 2012.
FIDELIX, T.S.; MACEDO, C.R.; MAXWELL, L.J.; FERNANDES, M.T.V. Diacerein for osteoarthritis. Coch. Database Syst. Rev., n.1, CD005117, 2014.
GADOTTI, V.M.; MARTINS, D.F.; PINTO, H.F.; OLIVEIRA,
G.; KASTER, M.P.; QUINTAO, N.L.; SANTOS, A.R. Diacerein decreases visceral pain through inhibition of glutamatergic neurotransmission and cytokine signaling in mice. Pharmacol. Biochem. Behav., v.102, n.4, p.549-554, 2012.
HAMRAPURKAR, P.; PATIL, P.; DESAI, M.; PHALE, M.; PAWAR, S. Stress degradation studies and development of a validated stability-indicating-assay-method for determination of diacerein in presence of degradation products. Pharm. Meth., v.2, n.1, p.30-35, 2011.
JI, W.; ZHAN, J. Determination of diclofenac sodium by capillary zone electrophoresis with electrochemical
detection. J. Chromatogr. A., v. 868, n.1, p.101-107, 2000.
KAALE, E.; NYAMWERU, B.C.; MANYANGA, V.; CHAMBUSO, M.; LAYLOFF, T. The development and
validation of a Thin Layer Chromatography densitometry method for the analysis of diclofenac sodium tablets. Int. J. Chem. Anal. Sci., v.4, n.1, p.73-79, 2013.
KARADE, P.G.; SHAH, R.R.; CHOUGULE, D.D.; BHISE,
S.B. Formulation and Evaluation of Celecoxib Gel. J. Drug Deliv. Therap., v.2, n.3, p.132-135, 2012.
L O U T H R E N O O , W . ; N I L G A N U W O N G , S . ;
AKSARANUGRAHA, S.; ASAVATANBODEE, P.;
SAENGNIPANTHKUL, S. The efficacy, safety and
carry-over efect of diacerein in the treatment of painful
knee osteoarthritis: a randomised, double-blind, NSAID-controlled study. Osteoarthritis Cartilage, v.15, n.6,
MILLERSHIP, J.S.; PARKER, C.; DONNELLY, D. Ratio
spectra derivative spectrophotometry for the determination of furosemide and spironolactone in capsule formulation. Farmaco, v.60, n.4, p.333-338, 2005.
NEBSEN, M.; ABDRAHMAN, M.K.; SALEM, M.Y.; EL-KOSASY, A.M.; EL-BARDICY, M.G. Stability-indicating
spectrophotometric and spectrodensitometric methods for the determination of diacerein in the presence of its degradation product. Drug Test Anal., v.3, n.4, p.221-227, 2011.
OJHA A.; RATHOD, R.; PADH, H. Simultaneous HPLC-UV
determination of rhein and aceclofenac in human plasma. J. Chromatogr. B, v.877, n.11-12, p.1145-1148, 2009.
PANDEY, R.; PATIL, P.O.; PATIL, M.U.; DESHMUKH, P.K.;
BARI, S.B. Quantitative estimation of diacerein in bulk and in capsule formulation using hydrotropic solubilizing agents
by UV-spectrophotometry and the first order derivative
using the area under curve method. Pharm. Meth., v.3, n.1, p.4-8, 2012.
PATEL, N.S.; NANDURBARTKAR, V.P.; PATEL, A.J.; PATEL,
S.G. Simultaneous spectrophotometric determination of
celecoxib and diacerein in bulk and capsule by absorption
correction method and chemometric methods. Spectrochim. Acta A: Mol. Biomol. Spectrosc., v.125, p.46-52, 2014.
PELLETIER, J.P.; MARTEL-PELLETIER, J. DMOAD
developments: present and future. Bull. NYU Hosp. Jt. Dis.,
v.65, n.3, p.242-248, 2007.
ROTE, A.R.; BARI, P.D. Ratio spectra derivative and zero-crossing difference spectrophotometric determination
of olmesartan medoxomil and hydrochlorothiazide
in combined pharmaceutical dosage form. AAPS PharmSciTech., v.10, n.4, p.1200-1205, 2009.
SINGH, K.; SHARMA, R.; RAI, J. Diacerein as adjuvant to
diclofenac sodium in osteoarthritis knee. Int. J. Rheum. Dis.,
v.15, n.1, p.69-77, 2012.
SIVAKUMAR, R.; NALLASIVAN, P.; SARANYA, K.; SAM, S.W.; AKELESH, T.; VENKATNARAYANAN, R. Visible
spectrophotometric estimation of diacerein in bulk and pharmaceutical dosage forms. J. Young Pharm., v.2, n.4,
p.414-416, 2010.
SNYDER, R.L.; KIRKLAND, J.; GLAJACH, L. Pratical HPLC method development. Hoboken, NY, USA: JonhWiley & Sons, 1997. p.643-645.
TAMURA, T.; SHIRAI, T.; KOSAKA, N.; OHMORI, K.; TAKAFUMI, N. Pharmacological studies of diacerein in animal models of inflammation, arthritis and bone resorption. Eur. J. Pharmacol., v.448, p.81-87, 2002.
THONGCHAI, W.; LIAWRUANGRATH, B.; THONGPOON, C.; THEERAPHAN, M. High performance thin layer chromatographic method for the determination of diclofenac sodium in pharmaceutical formulations. Chiang Mai J. Sci., v.33, n.1, p.123-128, 2006.
VERBRUGGEN, G. Chondroprotective drugs in degenerative
joint diseases. Rheumatol., v.45, p.129-138, 2006.
ZHANG, Y.; CUN, D.; KONG, X.; FANG, L. Design and
evaluation of a novel transdermal patch containing diclofenac and teriflunomide for rheumatoid arthritis therapy. Asian J. Pharm. Sci., v.9, p.251-259, 2014.
ZHENG, W.J.; TANG, F.L.; LI, J.; ZHANG, F.C.; LI, Z.G.; SU, Y.; WU, D.H.; MA, L.; ZHOU, H.Q.; HUANG, F.; ZHANG, J.L.; LIANG, D.F.; ZHOU, Y.X.; XU, H. Evaluation of eicacy and safety of diacerein in knee osteoarthritis in
Chinese patients. Chin. Med. Sci. J., v.21, n.2, p.75-80,
2006.
Received for publication on 05th August 2015