123 Radiol Bras. 2011 Mar/Abr;44(2):123–128
Signs in neuroradiology – Part 1
*
Sinais em neurorradiologia – Parte 1
Fabrício Guimarães Gonçalves1, Filipe Ramos Barra2, Valter de Lima Matos3, Cássio Lemos Jovem2, Lázaro Luís Faria do Amaral4, Raquel delCarpio-O’Donovan5
The use of signs or analogies for interpretation and description of medical images is an old and common practice among radiologists. Comparison of findings with animals, food or objects is not unprecedented and routinely performed. Many signs are quite specific and, in some cases, pathognomonic. Indeed, notwithstanding their degree of specificity, signs may help in the characterization of certain diseases. Several neuroradiological signs have been already described. The authors will present 15 neuroradiology signs in the present essay, approaching their main characteristics, the significance of their role in the clinical practice, as well as their respective imaging findings.
Keywords: Radiological signs; Neuroradiology; Computed tomography; Magnetic resonance imaging.
O uso de sinais ou analogias na interpretação de imagens na radiologia médica é prática comum e antiga entre os radiologistas. Comparação entre achados de imagem com animais, alimentos ou objetos se faz de modo natural. Mui-tos sinais são bastante específicos e em alguns casos patognomônicos. Independentemente do grau de especificida-de, sinais auxiliam a prática radiológica. Vários sinais já foram descritos em neurorradiologia. Neste artigo os autores demonstrarão 15 sinais neurorradiológicos. Serão abordados as principais características de cada um, a sua impor-tância na prática clínica e os seus achados de imagem.
Unitermos: Sinais radiológicos; Neurorradiologia; Tomografia computadorizada; Imagem por ressonância magnética. Abstract
Resumo
* Study developed at the Montreal General Hospital, McGill University Health Centre (MUHC), Montreal, Quebec, Canada.
1. Titular Member of Colégio Brasileiro de Radiologia e Diag-nóstico por Imagem (CBR), Clinical Fellow in Neuroradiology at the Montreal General Hospital, McGill University Health Centre (MUHC), Montreal, Quebec, Canada.
2. MDs, Residents in Radiology and Imaging Diagnosis at the Hospital Universitário de Brasília, Brasília, DF, Brazil.
3. MD, Neuroradiologist at the Hospital Universitário de Brasília and Hospital Santa Luzia, Brasília, DF, Brazil.
4. MD, Neuroradiologist, Head of the Department of Neuro-radiology at Medimagem – Hospital da Beneficência Portuguesa de São Paulo and Hospital Santa Catarina, São Paulo, SP, Bra-zil.
5. MD, Neuroradiologist, Professor of Radiology, Director of the Neuroradiology Fellowship Program, McGill University Health Centre (MUHC), Montreal, Quebec, Canada.
Mailing Address: Dr. Fabrício Guimarães Gonçalves. Depart-ment of Diagnostic Radiology, Montreal General Hospital. 1650 Cedar Avenue. Montreal, Quebec, Canada H3G 1A4. E-mail: [email protected]
Received March 23, 2010. Accepted after revision October 5, 2010.
Gonçalves FG, Barra FR, Matos VL, Jovem CL, Amaral LLF, delCarpio-O’Donovan R. Signs in neuroradiology – Part 1. Radiol Bras. 2011 Mar/Abr;44(2):123–128.
diagnosis, and contribute with a certain degree of confidence in the diagnosis. In general, “we recognize what we already know”, and tools that aid in the interpreta-tion of images are valuable. In this first part, the authors discuss 15 neurological signs, with illustrative images for each one of them.
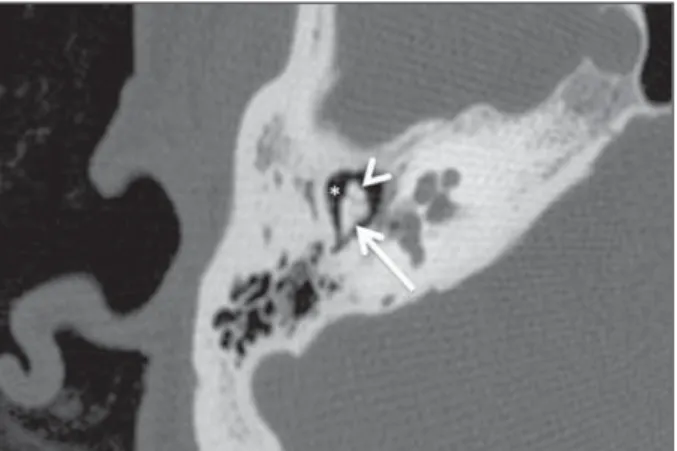
“Ice-cream cone sign” of the temporal bone
The temporal bone ice-cream cone sign represents the normal appearance of the malleoincudal joint on computed
tomogra-phy (CT). The malleus (hammerhead) rep-resents the ice-cream ball, and the body of the incus (anvil) represents cone (Figure 1). The anatomic identification of such struc-tures is important, particularly in cases of trauma in which ossicular luxation may occur.
“Cord sign” in cerebral venous thrombosis
Cerebral venous thrombosis (CVT) is a rare entity, with variable clinical presenta-tions. Seventy-five percent of the CVT occur in young women, between 20 and 40
INTRODUCTION
Descriptive terms in radiology are usu-ally based on standards and consensus. There are cases, however, in which the ra-diologist utilizes metaphors in the form of signs in allusion to foods, animals or ob-jects, to support his hypothesis for a given problem and describe the findings of a par-ticular disease. Signs, when present, are im-portant as they allude to a more specific
years of age, with the superior sagittal si-nus (SSS) being most frequently affected (62% of cases). Such increased incidence can be explained by pregnancy, puberty and use of oral contraceptives(1). The diagnosis can be achieved by means of CT (the most readily available), magnetic resonance im-aging (MRI) (the method of choice) or by conventional angiography (CA) (the most invasive method). In 20% of cases, CT scans are normal. CVT findings can be classified in direct and indirect. The cord sign and the empty delta sign are direct signs of CVT. Indirect signs include: edema, infarction and hemorrhage. The cord sign is characterized as increased den-sity of the sinuses or of the cortical or deep veins (Figure 2), originated from the throm-bosed material inside the affected vessel. The cord sign is most frequently identified within two weeks after the first symptoms onset. With time, the thrombus becomes isodense and subsequently, hypodense(2).
“Empty delta sign” in venous sinuses thrombosis
The empty delta sign may occur in cases of CVT, characteristically involving the SSS. On contrast-enhanced CT/MRI, the sign is characterized by a non-enhancing central triangular shaped area (the throm-bus itself), limited by enhancing dura mater (Figure 3)(3). Numerous factors may lead to CVT, as follows: inflammatory processes, infection, fibrosis of the venous sinuses walls, direct tumoral compression or/and extension, and hypercoagulable states(4). The empty delta sign is usually not identi-fied at the first week (the material is iso-dense) as well as in chronic cases (more than two months), due to thrombus reca-nalization(5).
“Arrow sign” in ruptured middle cerebral artery aneurysm
In ruptured aneurysms the pattern of distribution of subarachnoid hemorrhage can indicate its most likely location. In cases of bifurcation middle cerebral artery (MCA) aneurismal rupture the bleed may present the shape of an arrow, with the shaft and the tip representing blood in the hori-zontal segment of the Sylvian fissure and in the frontotemporal opercular area, re-spectively (Figure 4)(6).
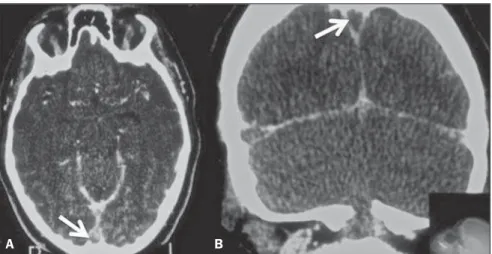
Figure 2. Axial images of a plain CT scan of the brain (A,B) of a female patient with a history of headache for the last seven days, and chronic use of oral contraceptive. The curvilinear hyperdensity at the site of a superficial frontal vein on the left side (arrows) represents the cord sign and confirms de clinical hy-pothesis of cerebral venous thrombosis.
B A
Figure 3. Axial (A) and coronal (B) contrast enhanced CT images of 24-year-old female patient on con-traceptive use, with history of headache over the past ten days. Note a triangular rim of enhancement (dura mater) in the superior sagittal sinus, delimitating a non-enhancing central area (arrows). Such finding represents the empty delta sign which is characteristic of dural venous sinuses thrombosis.
A B
“Dense artery sign” in acute middle cerebral artery infarction
The dense MCA sign is one of the early signs of infarct. This is due an increase in density of its proximal segments, second-ary to thrombosis (Figure 5). False-positive results may occur, particularly in cases of parietal calcification. It is important to observe that the distal branches of the MCAs rarely present parietal calcifications. Focal subarachnoid hemorrhage may simu-late an abnormally dense MCA especially when located at the Sylvian fissure and constitute an additional cause for false-positive results(7).
“Dot sign” in acute middle cerebral artery infarction
The dot sign is one of the early signs of acute infarction and corresponds to a punc-tate hyperdensity in the Sylvian fissure. The signal represents thrombosis in the M2 and M3 segments of the MCA on plain CT scans. The presence of a thrombus/clot within the vessel alters and increases its density (Figure 6). The dot sign has a high specificity and high positive predictive value, but has low sensitivity(8).
“Hot nose sign” at brain death
Figure 4. Axial image from a non-enhanced CT scan of the brain of a 45-year-old male patient with his-tory of intense headache. Moderate subarachnoid hemorrhage is observed adjacent to the left middle cerebral artery bifurcation, with accumulation of blood in the Sylvian fissure. The typical arrow sign is formed by subarachnoid hemorrhage between the insula and the frontotemporal opercular area and along the M1 segment of the middle cerebral ar-tery.
Figure 5. Axial images from a non-enhanced CT scan of the brain of a 24-year-old female patient with history of cocaine abuse. On A, increased density is observed at the M1 segment of the left middle ce-rebral artery, corresponding to thrombosis (arrow). Such finding is one of the early signs of brain infarc-tion. On B, hypodensity is noted, with loss of differentiation between white and grey matter in the insular, opercular and basal ganglia regions (arrow), characterizing an acute infarction.
Figure 7. Digital subtraction angiogra-phy of a 52-year-old male patient clini-cally diagnosed with brain death. The absence of opacification in the intrac-ranial segments of the internal carotid arteries associated with increased flow in the external carotid arteries branches particularly in the nasopharyngeal re-gion, characterizes the hot nose sign. Figure 6. Axial image from a non-en-hanced CT scan of the brain of a 55-year-old patient with a history of left hemiplegia. The finding of punctate hyperdensity at the M2 segment of the right middle cerebral artery (arrow) is also known as the dot sign. This is one of the earliest signs of acute cerebral infarction and represents the presence of a thrombus/clot within the vessel.
A B
of brain death and it is defined by the pres-ence of early and increased radiotracer ac-tivity in the nasopharyngeal region. It may also be seen as an intense blush (hyper-emia) at CA examinations (Figure 7). The phenomenon is a result of a reduced blood flow in the internal carotid artery and in-creased flow in the external carotid branches. Such signal is not exclusive of brain death and may be found in different situations that lead to intracranial flow re-duction in one or both internal carotid ar-teries(9).
“Tau (t) sign” in persistent trigeminal artery
Figure 9. Incidental developmen-tal venous anomaly found in a digital subtraction angiography of a 40-year-old female patient. The pattern of a radial network of di-lated, abnormal medullary veins converging into a dominant cali-brous transparenchymal vein, which then courses into a cortical vein and subsequently into the superior dural sinus (arrow) char-acterizes the caput medusae sign. DVAs are usually incidental find-ings but must be associated with cavernomas, intracranial hemor-rhage, thrombosis and venous infarction.
“Caput medusae sign”
in developmental venous anomaly
The caput medusae sign is indicative of developmental venous anomaly (DVA), and is identifiable at CA, CT and MRI. DVAs correspond to a network of dilated, abnormal medullary veins with radial dis-tribution, converging into a dominant, calibrous transparenchymal vein, which may drain into a cortical vein, dural sinuses or into the deep venous system (Figure 9). DVAs are the most frequent intracranial vascular abnormalities, which are associ-ated with cavernomas in around 30% of cases. Despite being considered incidental findings, in some cases these may lead to intracranial hemorrhage, thrombosis and venous infarction(11). Hemorrhages
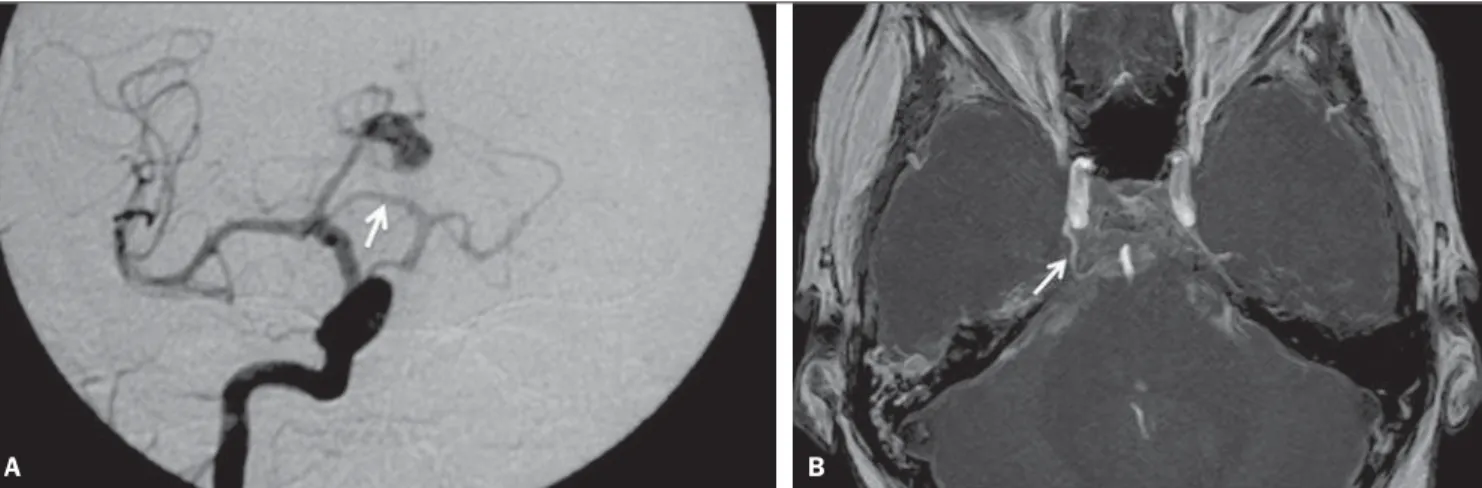
second-Figure 8. Digital angiography of a 45-year-old female patient (A) with carotid-basilar anastomosis, through a persistent trigeminal artery (arrow), also known as the tau (τ) sign. The same finding is noted in another female patient (B), on a MIP MR angiography image (arrow).
A B
ary to DVA are rarely found, with an annual risk of 0.7%(12).
“Spoke wheel sign” in meningioma
The spoke wheel sign refers to the typi-cal angiographic appearance found in men-ingiomas. This sign corresponds to mul-tiple small arteries radially distributed from a dominant feeding artery (Figure 10). Meningiomas are the most common pri-mary intracranial tumors in adults. They are extra-axial, slow-growing, well-vascular-ized lesions with a benign behavior (grade I, according to the World Health Organiza-tion). Another remarkable and very com-mon characteristic of meningiomas is the presence of a dural tail and, in 25% of cases, hyperostosis of the adjacent bone(13).
“Onion skin sign” in Baló’s concentric sclerosis
The onion skin sign is considered pathognomonic for Baló’s concentric scle-rosis(14). According to the first reports on such disorder, most patients had an unfa-vorable history with progression either to death or disability. Recent cases however, have presented a less dramatic course. Baló’s concentric sclerosis may occur as an isolated phenomenon or precede the devel-opment of multiple sclerosis. The lesions present a peculiar pattern of concentric lamellae of demyelination alternated with lamellae of myelinating or remyelinating white matter. Such lesions are most fre-quently found in the frontal lobes, but may be seen in the whole neuroaxis(14). Mag-netic resonance imaging (MRI) is the best method for the disease diagnosis and fol-low-up. In spite of the high sensitivity of T2-weighted images to demonstrate demy-elinating lesions, the concentric rings are better identified on T1-weighted images (Figure 11). The enhancement following contrast administration is variable and probably represents active areas of demy-elination(15).
“Eccentric target sign” in toxoplasmosis
Figure 10. Two female patients with meningioma. Note the characteristic spoke wheel sign in both pa-tients, formed by multiple small arteries radially distributed from a dominant feeding artery. On A, axial T2-weighted image of a 60-year-old patient with a greater sphenoid wing meningioma, and on B, digital subtraction angiography of a 55-year-old female patient with a meningioma in the right temporal region.
of cases. The pathological correlation of such sign is not completely understood, but it is believed to represent internal folds and invaginations of the abscess walls(16).
“Reversal sign” in diffuse cerebral anoxia
Such sign is characterized by the rela-tive inversion of attenuation between the supra and infratentorial structures on unenhanced CT and may indicate diffuse brain ischemia. The sign can explained by relative increase in the density of the cer-ebellum, basal ganglia and thalami, and decreased density of the cerebral cortex and white matter (Figure 13). Reversal sign can occur secondary to head trauma, hypoxia, birth anoxia, near drowning, status
epilepticus, hypothermia, bacterial
menin-gitis and strangulation. The pathogenesis is not completely clarified(17).
“Dawson’s fingers” in multiple sclerosis
The Dawson’s finger’s in multiple scle-rosis are related to white matter inflamma-tory changes that occur around the perimedullary veins. These are ovoid le-sions, with the longest axis perpendicular to the corpus callosum (Figure 14). James Walker Dawson was Scottish pathologist who developed relevant studies on multiple B
A
Figure 12. Axial enhanced T1 image of a 35-year-old female patient with acquired immune deficiency syndrome, encepha-lopathy and decreased level of consciousness. An eccentric enhancing mural nodule is seen in a ring-enhancing lesion char-acterizes the eccentric or asym-metric target sign.
Figure 11. Sagittal T1 (A) and axial T2-weighted images (B) of a female 50-year-old patient with history of progressive weakness particularly on the right side, with sensory aphasia and dysphagia. Concentric rings are observed in the frontal lobes, particularly on the left side. Such lamellar appearance (onion skin sign) is virtually pathognomonic of Baló’s concentric sclerosis. This case is a courtesy by Doctor Silvana Alves (Brasília, DF, Brazil).
A B
sclerosis. The demyelinating plaques are commonly located in the juxtacortical and periventricular white matter, in the corpus callosum and callosal-septal interface, with high signal intensity on sequences with long repetition time and hypo to iso-signal intensity on T1-weighted images(18).
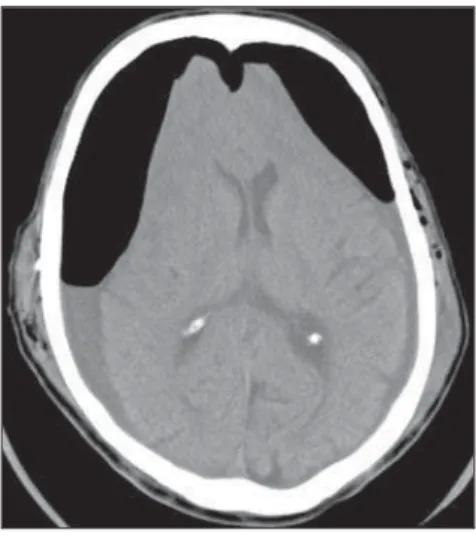
“Mount Fuji sign” in hypertensive pneumocephalus
This sign is seen in bilateral subdural hypertensive pneumocephalus. These air collections cause compression of the fron-tal lobes, which take up a shape similar to the Mount Fuji silhouette (Figure 15). Hy-pertensive pneumocephalus is a neurosur-gical emergency, in which the increased air pressure is thought to be secondary to a check-valve mechanism. Air would enter freely into the subdural space by a defect in the bone but would not scape with ob-structive and the egress of air being blocked by an obstruction. This sign is useful in the differentiation between hypertensive and non-hypertensive pneumocephalus.
Hyper-empty delta sign: frequency and significance in 76 cases of dural sinus thrombosis. Radiology. 1987;162:779–85.
4. Provenzale JM, Joseph GJ, Barboriak DP. Dural sinus thrombosis: findings on CT and MR imag-ing and diagnostic pitfalls. AJR Am J Roentgenol. 1998;170:777–83.
5. Lee EJ. The empty delta sign. Radiology. 2002; 224:788–9.
6. Maramattom BV, Wijdicks EF. Arrow sign in MCA trifurcation aneurysm. Neurology. 2004;63: 1323.
7. Morita S, Ueno E, Masukawa A, et al. Hyperatten-uating signs at unenhanced CT indicating acute vascular disease. Radiographics. 2010;30:111– 25.
8. Barber PA, Demchuk AM, Hudon ME, et al. Hyperdense sylvian fissure MCA “dot” sign: a CT marker of acute ischemia. Stroke. 2001;32:84–8. 9. Orrison WW Jr, Champlin AM, Kesterson OL, et al. MR ‘hot nose sign’ and ‘intravascular en-hancement sign’ in brain death. AJNR Am J Neuroradiol. 1994;15:913–6.
10. Kalidindi RS, Balen F, Hassan A, et al. Persistent trigeminal artery presenting as intermittent iso-lated sixth nerve palsy. Clin Radiol. 2005;60: 515–9.
11. Truwit CL. Venous angioma of the brain: history, significance, and imaging findings. AJR Am J Roentgenol. 1992;159:1299–307.
12. Garner TB, Del Curling O Jr, Kelly DL Jr, et al. The natural history of intracranial venous angio-mas. J Neurosurg. 1991;75:715–22.
13. Campbell BA, Jhamb A, Maguire JA, et al. Men-ingiomas in 2009: controversies and future chal-lenges. Am J Clin Oncol. 2009;32:73–85.
14. Caracciolo JT, Murtagh RD, Rojiani AM, et al. Pathognomonic MR imaging findings in Balo concentric sclerosis. AJNR Am J Neuroradiol. 2001;22:292–3.
15. Simon JH, Kleinschmidt-DeMasters BK. Variants of multiple sclerosis. Neuroimaging Clin N Am. 2008;18:703–16, xi.
16. Fischbein NJ, Dillon WP, Barkovich AJ. Teaching atlas of brain imaging. New York, NY: Thieme; 1999.
17. Han BK, Towbin RB, De Courten-Myers G, et al. Reversal sign on CT: effect of anoxic/ischemic ce-rebral injury in children. AJR Am J Roentgenol. 1990;154:361–8.
18. Traboulsee AL, Li DK. The role of MRI in the diagnosis of multiple sclerosis. Adv Neurol. 2006; 98:125–46.
19. Sadeghian H. Mount Fuji sign in tension pneumo-cephalus. Arch Neurol. 2000;57:1366. tensive pneumocephalus may after the
drainage of subdural hematomas, follow-ing skull base, paranasal sinuses and pos-terior fossa surgeries and in cases of head trauma(19).
CONCLUSION
The aforementioned signs are important tools as they lead to a more specific diag-nosis and add a certain degree of confi-dence in the diagnosis. With such informa-tion, the assisting physician can better es-tablish the correlation between imaging and clinical findings.
REFERENCES
1. Filippidis A, Kapsalaki E, Patramani G, et al. Ce-rebral venous sinus thrombosis: review of the de-mographics, pathophysiology, current diagnosis, and treatment. Neurosurg Focus. 2009;27:E3.
2. Vyas S, Singh P, Rahul K, et al. “Cord sign” in deep cerebral venous thrombosis. J Emerg Med. 2009. [Epub ahead of print].
3. Virapongse C, Cazenave C, Quisling R, et al. The Figure 14. Sagittal FLAIR image of a 39-year-old
female patient with clinical diagnosis of multiple sclerosis. Multiple, ovoid hyperintense periventri-cular lesions are observed at the callosal-septal interface, with the largest axis perpendicular to the corpus callosum. Such finding is known as Dawson’s fingers and is related to perivenular de-myelination found in multiple sclerosis.