Estimating dispersal and gene flow in the neotropical freshwater turtle
Hydromedusa maximiliani
(Chelidae) by combining ecological and genetic
methods
Franco L. Souza
1, Anderson F. Cunha
2, Marcos A. Oliveira
2, Gonçalo A.G. Pereira
2and Sérgio F. dos Reis
31
Departamento de Biologia, Centro de Ciências Biológicas e da Saúde, Universidade Federal de Mato
Grosso do Sul, Campo Grande, Mato Grosso do Sul, Brazil.
2Departamento de Genética, Instituto de Biologia, Universidade Estadual de Campinas, Campinas,
São Paulo, Brazil.
3
Departamento de Parasitologia, Instituto de Biologia, Universidade Estadual de Campinas, Campinas,
São Paulo, Brazil.
Abstract
Hydromedusa maximiliani is a vulnerable neotropical freshwater turtle endemic to mountainous regions of the Atlantic rainforest in southeastern Brazil. Random amplified polymorphic DNA (RAPD) was used to estimate the gene flow and dispersal for individuals inhabiting rivers and streams within a drainage. Nine primers generated 27 scoreable bands, of which 9 (33%) were polymorphic and produced 12 RAPD phenotypes. The gene flow estimates (Nm) among turtles inhabiting different rivers and streams were variable, ranging from 0.09 to 3.00 (mean: 0.60). For some loci, the rates of gene flow could offset population differentiation (Nm > 1), whereas for others random genetic drift could result in population divergence (Nm < 1). Since the genetic variation of this turtle seems to be structured according to the natural hierarchical system of rivers and streams within drainages, management programs involving translocations between different regions across the geographical range ofH. maximiliani should be viewed with caution.
Key words: Hydromedusa maximiliani, dispersal, gene flow, conservation. Received: April 2, 2002; accepted: June 5, 2002.
Introduction
The neotropical freshwater turtle Hydromedusa maximiliani(Chelidae) is endemic to the Atlantic forest of the coastal region of southeastern Brazil, with a geograph-ical distribution ranging from the State of Espírito Santo to the State of São Paulo (Ernst and Barbour, 1989; Iverson 1992). Throughout its range, the distribution of H. maximilianiis disjunct, occurring in isolation at elevations above 600 m. Locally, its habitat is topologically complex, with sequences of ridges and valleys each drained by river and stream systems (Souza, 1995).
Capture-recapture studies have shown that these tur-tles have limited dispersal ability, with a mean daily dis-placement of 2 m (Souza 1995; Souza and Abe, 1997a). Dispersal over longer distances is apparently limited to the rainy season, when temporary or intermittent water systems
are connected with the main watercourses (Souza and Abe, 1997a). The observed limited dispersal suggests that each H. maximilianipopulation inhabits a specific river within a given drainage system, and this hypothesis was addressed in a preliminary work on the population genetic structure of the species, which indicated a substantial partitioning of molecular variation across rivers and streams inhabited by this turtle (Souzaet al., 2002). These findings of population structure on a small spatial scale defined by the complex topographical features of the species’ habitat, a region top-ologically complex, with ridges and valleys drained by nu-merous rivers and streams (Pfeiferet al., 1986; Souza and Abe 1998), could imply that there is little or no gene flow among turtles inhabiting different water courses or distinct drainage. In this study, we used random amplified poly-morphic DNA (RAPD) markers (Williamset al., 1993) to assess levels of gene flow among localH. maximiliani pop-ulations, and briefly discuss the conservation and manage-ment implications of our findings.
Material and Methods
Field work was conducted from November 1998 to November 1999 at the Parque Estadual de Carlos Botelho (PECB), state of São Paulo, southeastern Brazil (24°00’-24°15’S, 47°45’-48°10’W). The PECB is a protected re-serve that encompasses over 37,000 ha of intact tropical montane rain forest typical of southeastern Brazil (Whitmore, 1990; Velosoet al., 1991). In this study, an area of approximately 500 ha containing eight rivers and streams (1-8) was surveyed (Figure 1). This 500 ha area was the same as used in previous studies of this species’ natural history [see Souza and Abe (1995, 1997a,b, 1998) for a more detailed description of the area]. Three sites were defined within these drainage based on the spatial hierarchy of the main rivers and their tributaries: site A (which in-cluded river 1), site B (which inin-cluded rivers 2, 3, 4, and 5), and site C (which included rivers 6, 7, and 8) (Figure 1).
Turtles (n= 25) were hand-caught and 200-300µL of blood was drawn from the scapula vein/brachial artery (Avery and Vitt, 1984) using a 26-gauge needle and a 1 mL syringe. The blood samples were immediately preserved in 1 mL of absolute ethanol (Miyakiet al., 1997) in plastic vi-als and stored at room temperature. The turtles were re-leased at the point of capture after blood sample collection.
Genomic DNA was extracted from the blood samples by two successive organic extractions with phenol:chloro-form:isoamyl alcohol as outlined by Brufordet al. (1992) and Miyakiet al. (1998), and then precipitated with 1/10 volume of 1 M sodium acetate (pH 5.3) and two volumes of 100% ethanol. The quality of the extracted DNA was evalu-ated in agarose gels (0.7%) stained with ethidium bromide and quantified by comparison with DNA standards run in the same gel. DNA was diluted to a working concentration of approximately 0.6 ng/µL.
Eighty primers (Operon Technologies, Inc.; Alame-da, California, EUA) were initially screened for consis-tently reproducible and scoreable amplified bands. Nine primers that met these criteria were used to analyze the DNA samples from the 25 individuals captured in the stud-ied area. The polymerase chain reaction (PCR) was per-formed in a Perkin-Elmer GeneAmpTMPCR system 9700 with a total volume of 12.5µL containing 10 mM Tris HCl (pH 8.4), 50 mM KCl, 3.5 mM MgCl2, 1µL of each dNTP, 2µL of primer, 0.3µLTaqpolymerase, 1.2 ng of genomic DNA and sterile water. Negative controls in which water was substituted for DNA were run to check for the possibil-ity of contamination. Reproducibilpossibil-ity was gauged by com-paring duplicate reactions, which were usually adjacent to one another in the thermocycler, and products were run side-by-side on the same gel. The reaction conditions in-volved initial denaturation of DNA for 2 min at 94 °C, 39 cycles of 1 min denaturation at 94 °C, 1 min annealing at 40 °C, 2 min extension at 72 °C, and one 5 min cycle at 72 °C for final extension. The amplification products were
separated on 1.3% agarose gels stained with ethidium bro-mide, run in buffer 1X TAE at a constant voltage of 80 V for 5 h. Monochrome photographic negatives were taken of the gels and the individual profiles were scored by two of the authors (FLS and AFC) for the presence/absence of fragments for each primer (see Souzaet al., 2002, for a full description of these methods).
Allele frequencies were estimated for standard ge-netic analysis of population structure. Most (~90%) alleles amplified by arbitrarily primed PCR segregate as dominant markers. Since these RAPD alleles are revealed as the pres-ence or abspres-ence of a band, it is not generally possible to dis-tinguish heterozygous individuals from those homozygous for the dominant allele at such loci because both have the “band present” phenotype (Ferreira and Grattapaglia, 1998). We assumed that all loci considered in our analyses met this criterion and that the genotypes were in Hardy-Weinberg equilibrium. Allele frequencies were obtained using the asymptotically unbiased estimator, , derived by Lynch and Milligan (1994), as follows
$ $ $
$
q x 1 Var(x) 8x2
= −
where is the frequency of the null allele calculated as the square root of the frequency of the null phenotype (i.e., ab-sent band).
The analysis of molecular variance, AMOVA (Excoffieret al., 1992) was used to measure the variation in allelic frequencies for each locus among populations of tur-tles inhabiting different rivers and streams from the sam-pled drainage. Gene flow (Nm) was estimated from F-statistics, FST, as a measure of the genetic interaction
Figure 1- Map of the study site at Parque Estadual de Carlos Botelho, state of São Paulo, southeastern Brazil. The sample drainage for
among populations, indicating the number of immigrants per population per generation (Slatkin, 1985, 1987). We used the formulaFST= 1/(4Nm+ 1), whereNis the local
population size andmis the average rate of immigration. For this estimate, we assumed neutrality, negligible muta-tion and a stepping-stone populamuta-tion structure model (Kimura and Weiss, 1964). This assumption was crucial because the relation ofFSTto underlying microevolutionary
parameters changes with different models of population structure (Slatkin, 1985, 1987). Contingency chi-square values were calculated to determine whetherFSTestimates
varied from zero (significant population differentiation), using the formulaχ2 = 2N FST(k-1), where N is the total
sample size, andkis the number of alleles; df = (k-1)(m-1), wheremis the number of samples (in this case, the number of sites within sampled drainage) (Johnson and Black, 1991).
Results
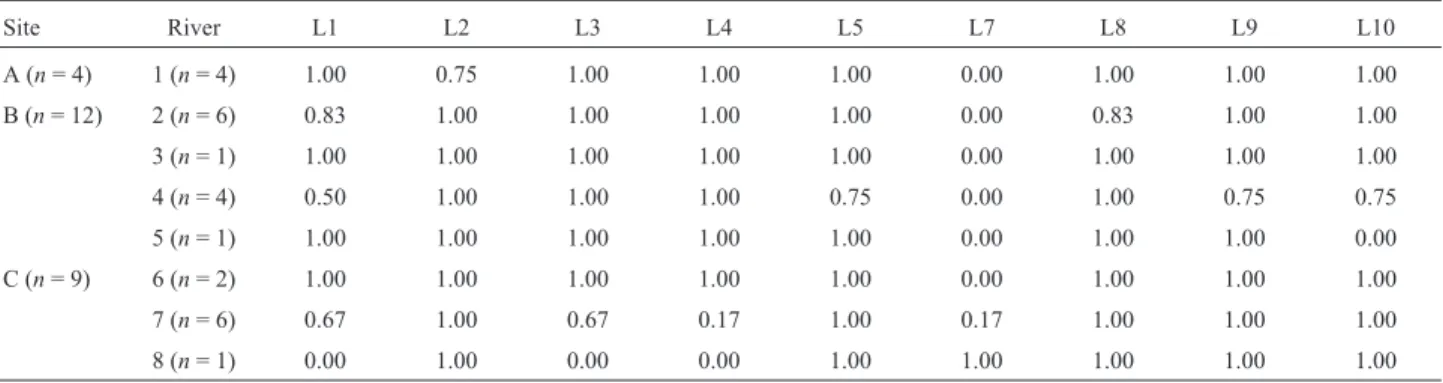
Nine of the 80 primers used yielded band patterns that were clear and could be scored with confidence. These primers produced 27 potentially scoreable bands (range 1-6; mean 3), of which nine bands (33%) were polymorphic and produced 12 RAPD phenotypes. The estimated allele frequencies at RAPD-encoding loci from these nine poly-morphic bands varied among rivers and streams, indicating that most loci were spatially structured (Table I) and en-demic to some rivers and streams. Locus 2 was found only for site A (river 1), which was the river located farthest west in this drainage. Two unique alleles were found for turtles inhabiting river 4 at site B (loci 5 and 9), while one unique allele (locus 8) was found for individuals from river 2 (site B). One allele, locus 1, was the most widespread allele and was detected at all three sites, including rivers 2, 4, 7, and 8 (Table I).
The estimatedFSTfor each locus ranged from 0.077 to
0.743 (Table II), and only one locus (locus 7) showed no significant difference among populations (p > 0.05). The overall differentiation (FST= 0.293) among populations of
turtles inhabiting different rivers and streams from the sam-pled drainage was significant (χ218= 132.03; p < 0.0001), indicating variation among populations. The averageNm estimate was 0.60 (range = 0.09-3.00).
Discussion
The combination of ecological and biogeographical processes is an important mechanism for shaping the genetic structure of populations. Thus, life-traits (mating systems, dispersal ability), historical events (fragmenta-tion, range expansion, colonization), and landscape matrix (mountain ridges, watersheds) may provide the background for understanding the geographic structure of genetic varia-tion among populavaria-tions (Templetonet al., 1995).
Nmestimates of more than one immigrant into the av-erage deme per generation, as calculated for five loci (loci 1, 5, 7, 8, and 9), indicated that gene flow among popula-tions inhabiting different rivers and streams was sufficient to deter population differentiation if they were at equilib-rium between migration and random genetic drift (Wright,
Table I- Band frequencies (locus: L) among nine oligonucleotide primers forH. maximilianisampled from eight rivers and streams which formed the three sites (A, B, and C) of a drainage in the Parque Estadual de Carlos Botelho. The values indicate the presence frequency of variable bands (n= sample size).
Site River L1 L2 L3 L4 L5 L7 L8 L9 L10
A (n= 4) 1 (n= 4) 1.00 0.75 1.00 1.00 1.00 0.00 1.00 1.00 1.00
B (n= 12) 2 (n= 6) 0.83 1.00 1.00 1.00 1.00 0.00 0.83 1.00 1.00
3 (n= 1) 1.00 1.00 1.00 1.00 1.00 0.00 1.00 1.00 1.00
4 (n= 4) 0.50 1.00 1.00 1.00 0.75 0.00 1.00 0.75 0.75
5 (n= 1) 1.00 1.00 1.00 1.00 1.00 0.00 1.00 1.00 0.00
C (n= 9) 6 (n= 2) 1.00 1.00 1.00 1.00 1.00 0.00 1.00 1.00 1.00
7 (n= 6) 0.67 1.00 0.67 0.17 1.00 0.17 1.00 1.00 1.00
8 (n= 1) 0.00 1.00 0.00 0.00 1.00 1.00 1.00 1.00 1.00
Table II- Among population differentiation (FST) and gene flow estimates
(Nm) of RAPD allele frequencies for nine variable loci (L) from
Hydromedusa maximilianispecimens inhabiting a drainage in the Parque Estadual de Carlos Botelho, state of São Paulo, southeastern Brazil. d.f.: degrees of freedom.
Locus FST χ2 d.f. p Nm
L1 0.1411 7.06 2 0.05 1.52
L2 0.4620 23.10 2 0.001 0.29
L3 0.3858 19.29 2 0.001 0.39
L4 0.7428 37.14 2 0.001 0.09
L5 0.1864 9.32 2 0.01 1.09
L7 0.0770 3.85 2 0.05 3.00
L8 0.1864 9.32 2 0.01 1.09
L9 0.1864 9.32 2 0.01 1.09
L10 0.2726 13.63 2 0.01 0.67
1931; Slatkin, 1985, 1987). In contrast,Nmvalues for four loci (loci 2, 3, 4, and 10) were less than one, implying that the differentiation among populations could have occurred through random genetic drift alone (Slatkin, 1985, 1987). Overall, the Nm estimate of 0.589 indicated that the H. maximilianipopulations inhabit different rivers.
Population structure bears an inverse relationship with the dispersal capability of organisms (Hartl and Clark, 1997), and the observed pattern ofH.maximiliani popula-tion structure on a local spatial scale (Souzaet al., 2002) is consistent with the known dispersal behavior of the species. Direct and indirect methods for estimating gene flow (Slatkin, 1987) in this species yielded similar results. Esti-mates of dispersal forH.maximilianibased on mark-recap-ture data (direct method) gathered during a 1993-1994 study (Souza and Abe, 1997b) showed that the movement of individuals was fairly restricted, with a mean daily dis-placement of two meters, suggesting that turtles from each river and stream within a drainage could be structured in as a metapopulation (Hanski and Simberloff, 1997). Indeed, individuals from which blood samples were taken for the present study in 1999 were found only a few meters from the site where they had been marked in 1993-1994.
The hypothesis of a metapopulation structure was confirmed by indirect (genetic) methods. The fact that sev-eral alleles were unique for rivers and streams within a drainage indicated that, because of the turtles’ limited dis-persal, mating must be restricted to related individuals, which would facilitate the development of a local genetic structure. Furthermore, the molecular markers produced highFSTvalues and low Nmvalues, indicating low gene
flow among turtles inhabiting different rivers and streams. Templeton et al. (1990) found that mitochondrial DNA haplotypes in strictly aquatic salamanders were partitioned according to rivers within drainage, in a similar manner to the partitioning of RAPD variation forH.maximiliani. For organisms with a sedentary nature and low dispersal ability, such as snails, the genetic structuring of populations on small geographic scales is frequently detected (Johnson and Black, 1991; Arnaud et al., 1999, 2001), and could have originated from limited gene flow among populations.
Additional sampling of drainages and rivers and streams within drainage, as well as the use of mitochondrial and nuclear sequence markers will be necessary to estimate effective population sizes, population genealogies and other aspects fundamental toH. maximilianiconservation. These genetic analyses are important for the protection and management of this turtle species because such information could be useful in determining options for translocations. The genetic variation in this turtle species is structured ac-cording to the natural hierarchical system of rivers and streams within drainage, and limited gene flow is detected among populations from different rivers and streams. Thus, each watershed may harbor endemic populations, which
suggests a strong degree of genetic structure and differenti-ation in the geographical range of the species.
Acknowledgements
The authors thank E.L.A. Monteiro-Filho and L.C. Duarte for helpful comments and criticisms on the script, S. Hyslop for reviewing the English of the manu-script, and C.Y. Miyaki for assistance in the early stages of this study. The Instituto Florestal provided logistic support and P.P. Soares and A. John provided assistance in the field. J.R. Somera helped with the line drawings. This study was funded by the Fundação de Amparo à Pesquisa do Estado de São Paulo, Brazil (FAPESP, grant 00/00805-9) and Fundo de Apoio ao Ensino e à Pesquisa, Universidade Estadual de Campinas, São Paulo, Brazil (FAEP, grant 0023/00). FLS was the recipient of a post-doctoral fellow-ship from FAPESP (contract number 99/02761-0). SFR is partially supported by a research fellowship from the Conselho Nacional de Desenvolvimento Científico e Tecnológico (CNPq), Brazil.
References
Arnaud JF, Madec L, Bellido A and Guiller A (1999) Microspatial genetic structure in the land snailHelix aspersa (Gastro-poda: Helicidae). Heredity 83:110-119.
Arnaud JF, Madec L, Guiller A and Bellido A (2001) Spatial anal-ysis of allozyme and microsatellite DNA polymorphism in the land snailHelix aspersa(Gastropoda: Helicidae). Mol. Ecol. 10:1563-1576.
Avery HW and Vitt LJ (1984) How to get blood from a turtle. Copeia 1984:209-210.
Bruford MW, Hanotte O, Brookfield JFY and Burke T (1992) Sin-gle-locus and multilocus DNA fingerprinting. In: Hoelzel AR (ed) Molecular Genetic Analysis in Conservation, Ox-ford, pp 225-270.
Ernst CH and Barbour RW (1989) Turtles of the World. Smithso-nian Institution Press, Washington, D.C., 313pp.
Excoffier L, Smouse PE and Quattro JM (1992) Analysis of mo-lecular variance inferred from metric distances among DNA haplotypes: application to human mitochondrial DNA re-striction data. Genetics 131:479-491.
Ferreira ME and Grattapaglia D (1998) Introdução ao Uso de Marcadores Moleculares em Análise Genética. Embrapa, Brasília, 220 pp.
Hanski I and Simberloff D (1997) The metapopulation approach, its history, conceptual domain, and application to conserva-tion. In: Hanski IA and Gilpin ME (eds) Metapopulation Bi-ology: Ecology, Genetics, and Evolution. Academic Press, New York, pp 5-26.
Hartl D and Clark AG (1997) Principles of Population Genetics. Sinauer, Sunderland, 389 pp.
Iverson JB (1992) A Revised Checklist with Distribution Maps of the Turtles of the World. Privately printed, Richmond, 363pp.
Kimura M and Weiss GH (1964) The stepping stone model of population structure and the decrease of genetic correlation with distance. Genetics 49:561-576.
Lynch M and Milligan BG (1994) Analysis of population genetic structure with RAPD markers. Mol. Ecol. 3:91-99. Myiaki CY, Pereira SL, Biasia I and Wajntal A (1997) DNA
fin-gerprint applied to parrot captive breeding programs. Ara-rajuba 5:127-133.
Miyaki CY, Matioli SR, Burke T and Wajntal A (1998) Parrot evolution and paleogeographical events: mitochondrial DNA evidence. Mol. Biol. Evol. 15:544-551.
Pfeifer RM, Carvalho WA, Silva DA, Rossi M and Mendicino LF (1986) Levantamento semi-detalhado dos solos do Parque Estadual de Carlos Botelho, SP. Bol. Tec. I. F., São Paulo, 40:75-109.
Slatkin M (1985) Gene flow in natural populations. Ann. Rev. Ecol. Syst. 16:393-430.
Slatkin M (1987) Gene flow and the geographic structure of natu-ral populations. Science 236:787-792.
Souza FL (1995) História natural do cágadoHydromedusa maxi-miliani(Mikan 1820) no Parque Estadual de Carlos Botelho, SP, região de Mata Atlântica (Reptilia, Testudines, Che-lidae). MS Thesis, Universidade Estadual Paulista, Rio Cla-ro.
Souza FL and Abe AS (1997a) Population structure, activity, and conservation of the neotropical freshwater turtle, Hydro-medusa maximiliani, in Brazil. Chel. Conserv. Biol. 2:521-525.
Souza FL and Abe AS (1997b) Seasonal variation in the feeding habits ofHydromedusa maximiliani(Testudines, Chelidae). Bol. Asoc. Herpetol. Esp. 8:17-20.
Souza FL and Abe AS (1998) Resource partitioning by the neo-tropical freshwater turtle, Hydromedusa maximiliani. J. Herpetol. 32:106-112.
Souza FL, Cunha AF, Oliveira MA, Pereira GAG, Pinheiro HP and dos Reis SF (2002) Partitioning of molecular variation at local spatial scales in the vulnerable neotropical freshwa-ter turtle,Hydromedusa maximiliani(Testudines, Chelidae): implications for conservation of aquatic organisms in natu-ral hierarchical systems. Biol. Conserv. 104:119-126. Templeton AR, Shaw K, Routman E and Davis SK (1990) The
ge-netic consequences of habitat fragmentation. Ann. Miss. Bot. Gard. 77:13-27.
Templeton AR, Routman E and Phillips CA (1995) Separating population structure from population history: a cladistic analysis of the geographical distribution of mitochondrial DNA haplotypes in the tiger salamander, Ambystoma tigrinum. Genetics 140:767-782.
Veloso HP, Rangel-Filho ALR and Lima JCA (1991) Classi-ficação da Vegetação Brasileira Adaptada a um Sistema Universal. Instituto Brasileiro de Geografia e Estatística, Rio de Janeiro, 123 pp.
Whitmore TC (1990) An Introduction to Tropical Rain Forests. Oxford University Press, Oxford, 296 pp.
Williams JGK, Hanafey MK, Rafalski JA and Tingey SV (1993) Genetic analysis using random amplified polymorphic DNA markers. Met. Enzymol. 218:704-740.