Parentage testing and effect of misidentification on the estimation of breeding
value in Gir cattle
Erica E. Baron
1, Mário L. Martinez
2, Rui S. Verneque
2and Luiz L. Coutinho
1 1Department of Animal Production, Escola Superior de Agricultura “Luiz de Queiroz” - ESALQ, USP.
2
Empresa Brasileira de Pesquisa Agropecuária - Embrapa, Centro Nacional de Pesquisa de Gado de Leite.
Abstract
A correct relationship among sires is essential for an efficient breeding program. Microsatellite markers were used in progeny tests, to assess the paternity of seventy-four probable offspring of nine Gir dairy sires. A 36% misidentification rate was observed; however, these errors had minimal effects on the ranking of the nine bulls with regard to their genetic values. The results suggest that paternity tests should be performed in breeding programs, in order to prevent inappropriate paternities from influencing the genetic value of bulls in the future.
Key words: microsatellite, Gir, cattle, breeding, parentage, PCR. Received: May 29, 2000; accepted: August 7, 2002.
Introduction
Breeding programs have been of considerable impor-tance to improve productivity in the animal industry. In dairy cattle, progeny testing is the method of choice; how-ever, this method presents two drawbacks limiting its use: 1) high cost, and 2) increased generation intervals. These obstacles can be overcome when large numbers of proge-nies are obtained by artificial insemination. Therefore, ac-curate parentage information is of critical importance for the estimation of the genetic values of the animals.
Different types of markers have been used in pater-nity testing. In recent years, microsatellite markers have been used, because of their large polymorphism informa-tion content, widespread distribuinforma-tion in the genome, the type of samples that can be used (e.g., blood and hair), the possibility to process several samples at the same time, and the fact that the results are easy to interpret. Many micro-satellites have been described in bovine genomes (Barendseet al., 1994; Mooreet al., 1994; Vaimanet al., 1994; Burns et al., 1995, Glowatzki-Mulis et al., 1995; Stoneet al., 1995; Ushaet al., 1995; Heyenet al., 1997; Kappeset al., 1997) and, due to their high polymorphism, they have been proposed as relationship verification mark-ers for bovine herds. Usha (1995) and Heyen (1997) sug-gested using at least five microsatellite markers in the same analysis to achieve a 0.99 probability of exclusion of an in-correct sire.
The purpose of this study was to verify the paternity of Gir bulls participating of a progeny test, and to calculate the misidentification rate and its effect on genetic value es-timation, using microsatellite markers.
Material and Methods
Animals
Nine bulls and 74 progenies (six to nine per sire) from 15 different herds participanting of a Gir dairy cattle prog-eny test were used.
DNA extraction
Two protocols were used for blood samples: the stan-dard protocol for “FTA cards” and “Gene cards” (GIBCO BRL - Life Technologies), and the protocol for Chelex-100 (Bio-Rad). For the first one, we used a 2 mm punch to re-move samples from the FTA cards for blood collection. The samples were placed in an amplification tube of at least 300µL. Three times 200µL of FTA purification reagent (GIBCO - Life Technologies) each were added to each tube, with a five-minute interval between washings. Then, 200µL of modified TE solution (10 mM Tris-HCL pH 8.0 and 0.1 mM EDTA) were added, and the paper washed twice, with a 5 min interval between washings. The paper was then completely dried for one hour at room tempera-ture, or for 30 min at 60 °C. Finally, PCR (polymerase chain reaction) solution was added to the tubes to a final volume of 40µL.
www.sbg.org.br
Send correspondence to L.L.Coutinho. Departamento de Produção Animal, ESALQ-USP, Av. Padua Dias, 11, 13418-900 Piracicaba, SP, Brazil. E-mail: [email protected].
For the Chelex-100 protocol (Walsh et al., 1991), 6 mm of the FTA cards were cut out, placed in 1 mL water, and left at room temperature for 30 min. Samples were then centrifuged at 10,000 rpm for 5 minutes. The supernatant was removed, and 200 µL 5% Chelex were added. The tubes were incubated at 56 °C for 35 min. After being vortexed at high speed for 5-10 s, the samples were boiled for 8 min and separated in aliquots.
DNA was extracted from semen samples using proteinase k, according to the protocol used by Shuster (1992), followed by a CTAB (hexadecyltrimethyl-ammonium bromide) cleaning method described by Via (1993).
PCR reaction
Blood
Amplification reactions were prepared for a final vol-ume of 40µL. The PCR protocol for five of the six micro-satellites (BM8246, BMS963, BMS483, INRA112, and TEXAN15) was as follows: 5.0 µL 10X PCR buffer; 3.0µM MgCl2; 0.2µM forward primer; 0.2µM reverse
primer; 2 mm “FTA card” or “Gene card”; 0.25µM dNTP; 2 units of Taq DNA polymerase. For microsatellite CSFM50, the conditions were different regarding primer concentration, which was 0.01µm for both primers. Forty amplification cycles were performed.
The steps used for PCR amplifications were: initial DNA denaturation at 96 °C for 5 min; 40 denaturation cy-cles at 94 °C for 2 min, annealing at primer-specific tem-perature (Table I) for 30 s, extension at 72 °C for 30 s, and a final extension at 72 °C for 4 min.
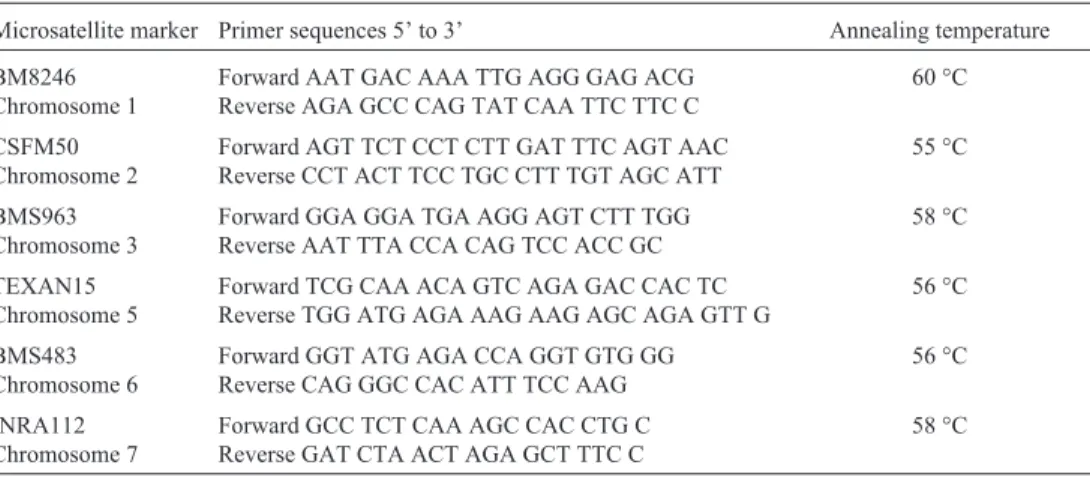
Table I shows the primer sequences of the six micro-satellites, as well as their annealing temperatures.
Semen
Each 200µL sample of semen DNA was divided into 5µL aliquots for PCR analysis. Thermocycle programs for all six microsatellites were the same as those used to am-plify the blood samples, including the number of cycles in
the “PTC-100 Programmable Thermal Controller” (M.J. Research) and the “GeneAmp PCR System 9600” (Perkin-Elmer). However, concentrations and total vol-umes were different. For a total volume of 25µL, the fol-lowing were used: 2.5µL PCR buffer10x; 1.5 mM MgCl2;
0.32µM forward primer; 0.32µM reverse primer; 5µL ex-traction solution; 0.2µM dNTP; 1 unit Taq DNA polymer-ase.
Allele size determination
Microsatellite alleles were separated in a 6% polya-crylamide gel on an A.L.F. sequencer (Pharmacia). Inter-nal (IS) and exterInter-nal standards (ES) were used to accurately determine the size of the amplified products.
Sample size determination
The sample size representing the animals involved in the progeny test was calculated according to Barnett (1974):
n N 1 1 N D ZS N 1 1 N D ZS 2 1 2 ≥ + = + −
where N = total number of animals with production records used in the evaluation; Z = 1.96 forα= 0.95; S = square root of N (number of animals sampled) multiplied by p (percent-age of paternity error found) multiplied by q (1-p); D = the difference between p sampled to p of population (error dif-ference that can occur due to sampling forα= 0.95) and p = 0.36 (misidentification rate found).
Exclusion probability (EP)
The exclusion probability of a sire was calculated in relation to the progeny only, since in most cases there was no information on the dam. According to Ronet al.(1996):
PE = (1 - pi)2
Table I- Description of six microsatellite primers and their respective annealing temperatures.
Microsatellite marker Primer sequences 5’ to 3’ Annealing temperature
BM8246 Chromosome 1
Forward AAT GAC AAA TTG AGG GAG ACG Reverse AGA GCC CAG TAT CAA TTC TTC C
60 °C
CSFM50 Chromosome 2
Forward AGT TCT CCT CTT GAT TTC AGT AAC Reverse CCT ACT TCC TGC CTT TGT AGC ATT
55 °C
BMS963 Chromosome 3
Forward GGA GGA TGA AGG AGT CTT TGG Reverse AAT TTA CCA CAG TCC ACC GC
58 °C
TEXAN15 Chromosome 5
Forward TCG CAA ACA GTC AGA GAC CAC TC Reverse TGG ATG AGA AAG AAG AGC AGA GTT G
56 °C
BMS483 Chromosome 6
Forward GGT ATG AGA CCA GGT GTG GG Reverse CAG GGC CAC ATT TCC AAG
56 °C
INRA112 Chromosome 7
Forward GCC TCT CAA AGC CAC CTG C Reverse GAT CTA ACT AGA GCT TTC C
where pi = sum of the frequencies of the two sire alleles. Allele frequencies were determined from 64 not closely related Gir animals.
For multiple loci, the combined exclusion probability (CEP) was calculated according to Ronet al. (1996):
CPE 1 (1 PEi)
m
= −
∏
−where m = number of genotyped loci
i = ithmarker (1, 2, ..., m)
Exclusion was considered whenever the genotype of the bull was incompatible with the genotype of the mother-progeny pair with regard to at least one of the six markers.
Genetic evaluation
The MTDFREML system (Boldmanet al., 1995) was used to evaluate the sires. The animal model used was: Y =µ+ animal + herd/year of calving + season of calving + genetic composition of daughter + age of cow at calving + error.
The initial records included all lactations of all daughters of all sires of all herds and the herd mates. Only the daughter’s first lactation was taken into account. All lactations considered abnormal were excluded. Examples of abnormal factors are calf death or separation of calf from mother, disease, death or sale of a cow during lactation, teat loss due to mastitis, partial or total loss of lactation infor-mation, and intervals between test days greater than 75 days before completing 305 days of lactation.
To determine the impact of paternity error on the breeding program, the genetic values of the animals were compared before and after exclusion of the misidentified offspring from the analysis. Both results were compared by ordered correlation, using the Spearman method for 58 sires in the progeny test. This method evaluates the degree of association between the results of the two evaluations. The first one without corrections, and the second one after exclusion of the offspring records with incorrect paternity.
Results and Discussion
Information on allelic frequencies for several markers is available for many breeds. However, for Gir cattle, lim-ited information has been published. Therefore, in order to calculate exclusion probabilities, we had to determine first the allelic frequencies of the microsatellites used in this study. The allelic frequencies of six microsatellites ob-tained from 64 unrelated individuals from several herds are presented in Table II.
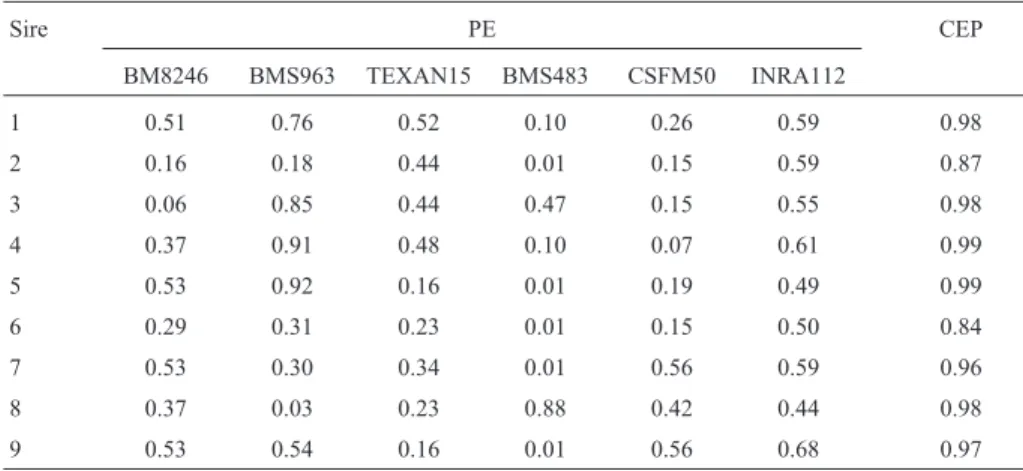
The results obtained for both types of probability (ex-clusion and combined ex(ex-clusion) according to Ronet al. (1996) are shown in Table III. Exclusion probability refers to the probability of excluding an incorrect paternity. For example, the probability of an incorrect paternity for sire 1
based on locus BM8246 only is 0.510203, and the com-bined probability for the same sire using all six markers is 0.98.
The combined exclusion probability (CEP) for the markers within the respective families varied from 0.842 to 0.989, which is less than the ideal 0.99. The CEP for seven markers with an EP of 0.5 would be 0.992. A CEP of the same magnitude (0.991) could be reached with only four markers with an EP = 0.7 (Rosa, 1997). Furthermore, ac-cording to Ronet al.(1996), if eight loci were genotyped with five alleles with the same 0.2 frequency for all loci, CEP would be 0.986. Consequently, the power of exclusion will be maximized whenever the alleles of the probable sire are rare.
Microsatellite parentage testing revealed incompati-ble genotypes for at least one marker in 27 of the 74-bull/calf pairs studied (36%). However, if only daugh-ters which were incompatible with regard to at least two markers were excluded, 16 of the 74 animals analyzed would have incorrect paternity, and the misidentification rate would be 22%.
Since we sampled only part of the animals in the progeny test, we used Barnett’s equation to determine if our sample size was sufficient to represent the population. Ac-cording to our calculations, the use of a sample of 74 ani-mals and a misidentification rate of 36% resulted in a type I error of 0.051, which was adequate for our study.
The 36% misidentification rate is higher than those found by Geldermannet al.(1986), Ronet al.(1996), and Rosa (1997), which varied between 4% and 23%. This ob-servation indicates that more accurate procedures to iden-tify the animals are necessary. Alexander et al. (1983) suggested that, for information on cattle breeding to be con-sidered accurate, data need to be based on a variety of fac-tors, such as secure animal containment, visual control of mounting or artificial insemination, and observation of par-turition or suckling activity.
It is interesting to note that, of the 27 daughters con-sidered to have incorrect paternity, eight had already been excluded by the data verification procedures already in place in the progeny test. Thus, the criteria used to decide whether or not lactation should be considered are justified for the detection of incorrect or dubious data.
An important factor contributing to misidentification is incorrect identification of the semen used in the receptor cows. We assumed that animals which did not get pregnant upon the first insemination and were re-inseminated would be more likely to have an incorrect record. Our data, how-ever, did not show any relationship between the number of inseminations and progeny misidentification. An identical number of wrong paternities was observed for animals re-sulting from first and from second inseminations.
be-Table II- Allele frequencies of microsatellites.
BM8246 BMS963 TEXAN15
Allele Frequency Allele Frequency Allele Frequency
171 0.015873 134 0.016129 201 0.301587
175 0.134921 136 0.419355 203 0.166667
177 0.023810 138 0.040323 205 0.214286
179 0.230159 140 0.008065 207 0.111111
181 0.015873 144 0.008065 209 0.047619
183 0.015873 146 0.153226 215 0.007937
187 0.039683 148 0.024194 217 0.007937
189 0.007937 150 0.161290 219 0.087302
191 0.031746 152 0.008065 221 0.055556
193 0.039683 154 0.032258
195 0.373016 156 0.112903
197 0.055556 158 0.016129
199 0.015873
BMS483 CSFM50 INRA112
Allele Frequency Allele Frequency Allele Frequency
105 0.015873 174 0.008197 188 0.008065
107 0.230159 170 0.245902 190 0.008065
109 0.460317 176 0.196721 186 0.048387
111 0.031746 178 0.106557 164 0.032258
113 0.095238 172 0.057377 184 0.040323
115 0.158730 168 0.368852 172 0.112903
117 0.007937 180 0.016393 182 0.104839
178 0.064516
168 0.088710
170 0.129032
174 0.072581
180 0.169355
166 0.120968
Table III- Exclusion probability (EP) and combined exclusion probability (CEP) for nine bulls and six microsatellite markers.
Sire PE CEP
BM8246 BMS963 TEXAN15 BMS483 CSFM50 INRA112
1 0.51 0.76 0.52 0.10 0.26 0.59 0.98
2 0.16 0.18 0.44 0.01 0.15 0.59 0.87
3 0.06 0.85 0.44 0.47 0.15 0.55 0.98
4 0.37 0.91 0.48 0.10 0.07 0.61 0.99
5 0.53 0.92 0.16 0.01 0.19 0.49 0.99
6 0.29 0.31 0.23 0.01 0.15 0.50 0.84
7 0.53 0.30 0.34 0.01 0.56 0.59 0.96
8 0.37 0.03 0.23 0.88 0.42 0.44 0.98
cause a mutation may generate a new allele in the offspring, wrongly suggesting exclusion of paternity (Halos et al., 1999). However, since the mutation rate in microsatellites is relatively small, it would have a minimal impact on our study.
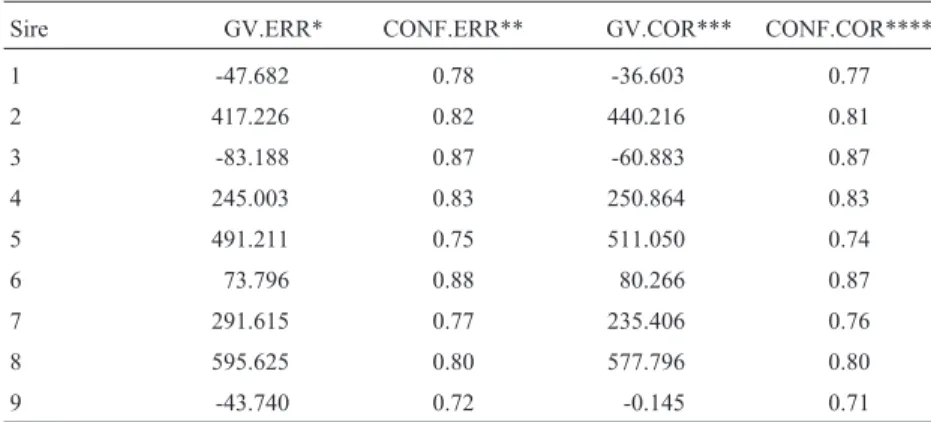
In order to investigate the effect of misidentification on the estimation of breeding value in Gir cattle, the genetic values of the sires were compared before and after the ex-clusion of the animals which were not daughters of the indi-cated bull. The resulting correlation of order by the Spearman method using the SAS system was 0.997, show-ing that the difference found in bull classification before and after the correction was not significant.
As can be seen by the results, the genetic value of some sires was altered after the second evaluation (Table IV). The effect, however, was small and had a minimal in-fluence on the ranking of the sires. It was interesting to ob-serve that some sires which were not tested for paternity had their genetic values changed (data not shown). This could be due to some relationship that might exist among them, or, in other words, other daughter companions to the herd which could influence the evaluation of a given sire. In conclusion, our study clearly demonstrates that there is a need to conduct paternity evaluation in progeny test pro-grams to assure accuracy of the genetic values of the sires.
Acknowledgments
This research was funded by Fundação de Amparo à Pesquisa do Estado de São Paulo (FAPESP) and by Empresa Brasileira de Pesquisa Agropecuária - Embrapa Gado de Leite. The authors thank FAPESP for financing this study. E.E.Baron is recipient of a scholarship from FAPESP. L.L.Coutinho, M.L.Martinez and R.S.Verneque are recipients of scholarships from CNPq (Conselho Nacional de Desenvolvimento Científico e Tecnológico).
References
Alexander G, Stevens D and Mottershead B (1983) Problems in the accurate recording of lambing data. Aust J Exp Agric Anim Husb 23:361-368.
Barendse W, Armitage SM, Kossarek LM, Shalom A, Kirkpatrick BW, Ryan AM, Clayton D, Li L, Neibergs HL, Zhang N, Grosse WM, Weiss J, Creighton P, McCarthy F, Ron M, Teale AJ, Fries R, McGraw RA, Moore SS, Georges M, Soller M, Womack JE and Hetzel DJS (1994) A genetic link-age map of the bovine genome. Nat Genet 6:227-235. Barnett V (1974) Elements of sampling theory. London: English
University Press, 151p.
Boldman KG (1995) A Manual for use of MTDFREML: A set of programs to obtain estimates of variances and covariances. Lincoln, USDA, 120 pp.
Burns BM, Taylor JF, Herring KL, Herring AD, Holder MT, Col-lins JS, Guerra TM, Sanders JO and Davis SK (1995) Bo-vine microsatellite dinucleotide repeat polymorphisms at the TEXAN11, TEXAN12, TEXAN13, TEXAN14 and TEXAN15 loci. Anim. Genet. 26:201-213
Geldermann H, Pieper U and Weber WE (1986) Effect of mis-identification on the estimation of breeding value and herita-bility in cattle. J of Anim Sci 63:1759-1768.
Glowatzki-Mullis M-L, Gaillard C, Wigger G and Fries R (1995) Microsatellite-based parentage control in cattle. Anim Genet 26:7-12.
Halos SC, Chu JY, Ferreon ACM and Magno MMF (1999) Philip-pine population database at nine microsatellite loci for forensic and paternity applications. Forensic Sci Int 101:27-32.
Heyen DW, Beever JE, Da Y, Evert RE, Green C, Bates SRE, Ziegle JS and Lewin HA (1997) Exclusion probabilities of 22 bovine microsatellite markers in fluorescent multiplexes for semiautomated parentage testing. Anim Genet 28:21-27. Kappes SM, Keele JW, Stone RT, McGraw RA, Sonstegard TS,
Smith TPL, Lopez-Corrales NL and Beatie CW (1997) A second generation linkage map of the bovine genome. Ge-nome Res 7:235-249.
Table IV- The genetic values of sires altered after the second evaluation.
Sire GV.ERR* CONF.ERR** GV.COR*** CONF.COR****
1 -47.682 0.78 -36.603 0.77
2 417.226 0.82 440.216 0.81
3 -83.188 0.87 -60.883 0.87
4 245.003 0.83 250.864 0.83
5 491.211 0.75 511.050 0.74
6 73.796 0.88 80.266 0.87
7 291.615 0.77 235.406 0.76
8 595.625 0.80 577.796 0.80
9 -43.740 0.72 -0.145 0.71
Moore SS, Byrne K, Berger KT, Barendse W, McCarthy F, Womack JE and Hetzel DJS (1994) Characterization of 65 microsatellites. Mamm Genome 5:84-90.
Ron M, Blanc Y, Band M, Ezra E and Weller JI (1996) Misidenti-fication rate in the Israeli dairy cattle population and its im-plications for genetic improvement. J Dairy Sci 79:676-681.
Rosa AJM (1997) Caracterização da raça Nelore e teste de pater-nidade por marcadores moleculares. Piracicaba, p.125. Mas-ter’s Thesis - Escola Superior de Agricultura “Luiz de Queiroz”, Universidade de São Paulo.
Shuster DE, Kehrli MEJr, Ackermann MR and Gilbert RO (1992) Identification and prevalence of a genetic defect that causes leukocyte adhesion deficiency in Holstein cattle. Proc Natl Acad Sci 89:9225-9229.
Stone RT, Pulido JC, Duyk GM, Kappes SM, Keele JW and Beatie CW (1995) A small-insert bovine genomic library highly enriched for microsatellite. Mamm Genome 6:714. Usha AP, Simpson SP and Williams JL (1995) Probability of
ran-dom sire exclusion using microsatellite markers for parent-age verification. Anim Genet 26:155-161.
Vaiman D, Mercier D, Moazami-Goudarzi K, Eggen A, Ciampolini R, Lepingle A, Velmala R, Kaukinen J, Varvio SL, Martin P, Levéziel H and Guérin G (1994) A set of 99 cattle microsatellite: characterization, synteny mapping and polymorphism. Mamm Genome 5:288-297.
Via LE, Jr and Stewart CN (1993) A rapid CTAB DNA isolation technique useful for RAPD fingerprinting and other PCR applications. BioTechniques 14:748-751.