DOI: 10.1590/0004-282X20150059
ARTICLE
EGFR, p53, IDH-1 and MDM2
immunohistochemical analysis in glioblastoma:
therapeutic and prognostic correlation
Análise imunoistoquímica para EGFR, p53, IDH-1 e MDM2 em glioblastoma: correlação
terapêutica e prognóstica
Richard Murdoch Montgomery, Luciano de Souza Queiroz, Fabio Rogerio
Gliomas are the most common brain tumor in adults, ac-counting for about 70% of primary neoplasms of the central ner-vous system (CNS). Glioblastoma (GBM) is the most common glioma, accounting for approximately 70% of astrocytomas and 15% of all intracranial neoplasms. About 90% of GBMs are
clas-siied as primary. Such lesions afect mainly the elderly (mean
age 62 years), have rapid evolution (less than 3 months) and no clinical or histopathological evidence of precursor lesions1. On
the other hand, secondary GBMs afect younger individuals (av -erage age 45 years) and progress slowly from a lower degree of
difuse astrocytoma. Histologically indistinguishable from each
other, the two forms of GBM have poor prognosis. Patients with
primary GBM have a median survival of approximately 5 months and those with a secondary form, 8 months1,2,3.
Histological analysis deines the type of an astrocytic neo
-plasm. However, diagnostic diiculties may arise due to the
heterogeneity of the tumor, morphological overlap with other gliomas or partial sampling of the lesion. As a result, in re-cent decades, several studies have used molecular techniques
aiming to ind biomarkers with diagnostic and/or prognostic relevance. Such studies not only allowed the identiication of such markers, but also led to a signiicant increase in knowl
-edge of the pathogenesis of gliomas and identiication of po -tential targets for new therapeutic approaches1,2,3.
Universidade Estadual de Campinas, Faculdade de Ciências Médicas, Departamento de Anatomia Patológica, Campinas SP, Brazil.
Correspondence: Fabio Rogerio; UNICAMP, Faculdade de Ciências Médicas, Departamento de Anatomia Patológica; Rua Tessália Vieira de Camargo, 126; Cidade Universitária Zeferino Vaz; 13083-887 Campinas SP, Brasil; E-mail: [email protected]
Conflict of interest: There is no conflict of interest to declare.
Received 15 August 2014; Received in final form 18 February 2015; Accepted 09 March 2015 ABSTRACT
We studied 36 glioblastoma cases at HC-UNICAMP from 2008 to 2012 and classified the immunohistochemical distribution of the wild-type epidermal growth factor receptor (EGFR), mutated forms of p53 protein and isocitrate dehydrogenase-1 (IDH-1) and murine double protein 2 (MDM2). Immunostaining findings were correlated with clinical data and response to treatment (surgery, chemotherapy and radiotherapy). About 97% of the tumors were primary, most of them localized in the frontal lobe. Mean time free of clinical or symptomatic disease and free time of radiological disease were 7.56 and 7.14 months, respectively. We observed a significant positive correlation between expressions of p53 and MDM2, EGFR and MDM2. Clinical, radiological and overall survivals also showed a significant positive correlation. p53 staining and clinical survival showed a significant negative correlation. The current series provides clinical and histopathological data that contribute to knowledge on glioblastoma in Brazilians.
Keywords: glioblastoma, neurosurgery, temozolomide, immunohistochemistry, clinical prognosis.
RESUMO
Estudamos 36 casos de glioblastoma acompanhados no HC-UNICAMP de 2008 a 2012 e classificamos a marcação imunoistoquímica da forma selvagem do receptor do fator de crescimento epidérmico (EGFR), formas mutantes da proteína p53 e isocitrato desidrogenase-1 (IDH-1) e proteína murina dupla 2 (MDM2). Os resultados de imunoistoquímica foram correlacionados com dados clínicos e resposta ao tratamento (cirurgia, quimioterapia e radioterapia). Cerca de 97% dos tumores foram primários, grande parte localizada no lobo frontal. O tempo médio livre de doença clínica ou sintomática e o tempo livre de doença radiológica foram de 7.56 e 7.14 meses, respectivamente. Observou-se correlação positiva entre a expressão das proteínas p53 e MDM2, EGFR e MDM2. Sobrevivências clínica, radiológica e global também mostraram correlação positiva e significativa. A expressão para p53 e sobrevivência clínica mostrou correlação negativa. O estudo fornece dados clínicos e histopatológicos que contribuem para o conhecimento sobre glioblastoma em brasileiros.
Particularly in recent years, molecular indings identiied as important biological markers of clinical outcome and/or the
therapeutic response are: overexpression of epidermal growth factor receptor (EGFR), mutation of TP53 gene and its derived
protein (p53), mutation of isocitrate dehydrogenase-1 (IDH-1)
and altered expression of murine double protein 2 (MDM2).
High protein levels of EGFR occur in about 90% of as -trocytic tumors, suggesting that alterations in transcrip-tion and translatranscrip-tion of this gene may also participate in tu-morigenesis. Alterations in EGFR gene are more commonly
found in primary GMBs. Speciically, EGFR is ampliied in 40%, overexpressed in 60% and mutated in 20-30% of the pa-tients1. Ampliications and rearrangements of EGFR are
high-ly indicative of high-grade gliomas, with a worse prognosis than estimated from just histopathologic grading4. his fact
has prompted the investigation of EGFR inhibitors aiming to promote apoptosis of cancer cells and increasing tumor sen-sitivity to possible adjuvant therapies.
It has been considered that the increased expression of TP53 is a response to aggression to DNA5,6,7. Cells with
im-paired function of p53 may develop genetic aberrations and lead to the development of malignancies1. In secondary
GBMs, in which alterations in the TP53 gene are more com-mon than in primary lesions, p53 may be mutated in more than 65% of the cases1.
Speciically, mutations in the IDH1 gene were identiied
in gliomas of low and high grade, including GBM. In the lat-ter, it was found that such mutations occur predominantly in younger individuals, with the secondary form of cancer and
longer survival. he IDH1 gene encodes the cytosolic isoform
of IDH that takes part in cellular respiration. Under physi -ological conditions, this enzyme catalyzes the conversion of isocitrate to α-ketoglutarate, a process in which there is
synthesis of nicotinamide adenine dinucleotide phosphate
(NADPH) from reduced NADP +. Both α-ketoglutarate as the NADPH are considered to be protective against oxidative
damage. All of the IDH1 mutations known to date are hetero
-zygous and somatic. he most common alteration in the pro -tein occurs in the amino acid position 132 and determines
the substitution of arginine for histidine (R132H)8,9,10,11,12,13.
IDH1 mutations alter the normal enzyme activity reducing
the synthesis of α-ketoglutarate and NADPH, which makes the cell more susceptible to oxidative stress. he mutated IDH also has a gain of function that leads to the reduced
α-ketoglutarate D-2-hydroxyglutarate (2HG). his new enzy -matic activity leads to the consumption of α-ketoglutarate and NADPH, further impairing the protection against oxida
-tive stress. he 2HG produced in excess is considered an on -cogenic metabolite as it induces epigenetic changes that lead
to aberrant regulation of gene expression. his compound also induces increased levels of HIF-1α (hypoxia-inducible factor-1 α), a transcription factor that promotes angiogen-esis by increasing the expression of vascular endothelial growth factor (VEGF)4.
he protein Murine Double Protein 2 (MDM2) inhibits
the p53 function of activating genes responsible for apoptosis or cellular repair proteins14. MDM2 also inhibits the function
of other suppressor genes such as pRb, which in turn stimu-lates DNA synthesis in the S phase of mitosis15. hus, changes
in the levels of MDM2 may cause disturbance in cell cycle
control and contribute to oncogenesis. Usually MDM2 is as -sociated with mutation of the p53 protein with direct and proportional relationship to the degree of malignancy and
proliferation indices, speciically the number of mitoses per ield14,15. Genetic alterations in MDM2 may be found in both
primary and secondary forms of GBM. In primary GBMs, MDM2 is ampliied in approximately 10% of the cases and
overexpressed in over 50%1. MDM2 is overexpressed in 10%
of secondary GBMs1.
he aim of this study was to investigate the prevalence of GBMs in the General Hospital of the State University of Campinas (UNICAMP) and correlate the immunostaining patterns of EGFR, p53, IDH1 and MDM2 with neoplastic morphological indings, clinical evolution, response to treat -ment and prognosis.
METHOD
he present study was retrospective and based on clinical
and histopathological analyses of surgical samples from pa-tients with primary or secondary GBM treated at the General
Hospital of the State University of Campinas (UNICAMP) from January 2008 to December 2012. his investigation
was approved by the Ethical Committee of the institution
(Protocol: CAAE: 03307712.9.0000.5404). he following inclu -sion criteria were adopted: (1) only adult patients (> 18 years of age at diagnosis), (2) only patients submitted to the stan-dard protocol of treatment (surgery with total or subtotal gross resection followed by initial chemotherapy with
temo-zolomide (200 mg/m2) only and radiotherapy with 60 Gy),
(3) available and consistent data from the patients’ charts, and (4) available and consistent retrievable data from the
histopathological sections. Patients and/or surgical samples that did not fulill all the listed criteria were excluded from the study. he age of evaluated patients ranged from 22 to
81 years old. Age, gender, overall survival, radiological sur-vival, survival time free of clinical disease, total or subtotal
gross resection, use of other chemotherapy and/or extra dos -es of radiation (other than those initially administrated as part of the treatment protocol) were reviewed and correlated
with histopathological and immunohistochemical indings.
Clinical, radiological and histopathological data were used to
diferentiate between primary and secondary GBMs. Primary
cases were considered as patients without previous clinical,
neuroimaging and/or histopathological diagnosis of GBM.
Histopathological analysis was performed in specimens obtained from the Department of Pathology – UNICAMP. Tumor tissue was previously ixed in 10% neutral buf
-ered formalin and processed for parain embedding. 4 µm thick sections were stained with hematoxylin and eosin (H&E). According to the last edition of the World Health Organization (WHO) classiication of CNS tumors3, the
di-agnosis of GMB was conirmed by identifying at least three
of the following features in astrocytic tumors: cellular atypia,
mitotic igures, necrosis and/or microvascular proliferation.
Immunohistochemical reactions using streptavidin-biotin peroxidase complex method were performed by using the antibodies shown in Table 1. For identifying the reac-tions, the sections were exposed to the detection system
containing the secondary antibody (EnvisionTM+Dual Link System-HRP® - Dako, cat# K4061 for EGFR and MDM2 primary antibodies; AdvanceTMHRP® - Dako, cat# K4068 for p53 and IDH-1 antibodies) following the manufacturer’s
instructions. 3.3 diaminobenzidine (DAB) was used as the chromogenic substrate. Positive and negative controls of the immunohistochemical reaction were used in all reactions.
he immunostaining patterns for p53, EGFR and MDM2 were evaluated considering both cellular (cytoplasm and/or
nucleus) and tissue distribution. Regarding the latter
eval-uation, we adapted the semi-quantitative classiications
proposed by Giordana et al14 and Korolopoulou et al15.
Particularly, for each biological marker, the percentage of
immunopositive cells was estimated by counting the
num-ber of immunopositive cells in ten high-power (40x) ields,
which were systematically randomized throughout the
sec-tion. For each ield, the ratio of positive cells/total number of cells was calculated (%). hen, the mean value of the ten
ields obtained from a section was considered as the esti -mated percentage of immunopositivity assigned to the tumor sample. Such value was allocated in a percentage in-terval here designated as class (1: 0-25%; 2: 26-50%; 3: 51-75%; and 4: 76-100%). Each case was evaluated by one person and
subsequently reviewed by another observer. For IDH-1 stain
-ing, it was used the binomial classiication of “positive” or “negative”, according to the presence or absence of neoplas -tic cells with cytoplasmic staining11,12,13.
For statistical analysis, mean absolute and relative
frequen-cy, Kruskal-Wallis and Chi-Square methods and the correlation coeicient of Pearson were used. he Kruskal-Wallis test was used to assess the diference between the means of quantitative variables in diferent categories (samples) for categorical vari
-ables. he Chi-Square test was used to assess the independence
between categories of two categorical variables. Pearson
cor-relation coeicient was used to assess the corcor-relation between
two quantitative variables. All tests of hypotheses developed in
this study considered 5% signiicance level, ie, the null hypoth -esis was rejected when p-value was less than 0.05.
RESULTS
In the present study we evaluated 36 patients, whose mean age was 57 years old with a median of 59 years. In 8 in-dividuals the diagnosis was made after 67 years. Of all cas-es studied, 16 (45%) were male and 20 (55%) female. Two tumors were found in the diencephalon, 10 in the temporal lobe, 17 in the frontal lobe, 6 in the parietal lobe and 1 in the
occipital lobe. hirty-ive tumors were diagnosed as prima
-ry and only one as seconda-ry. he treatment of all cases was
standardized: surgery with total or subtotal gross resection,
initial chemotherapy with temozolomide (200 mg/m2) only
and radiotherapy with 60 Gy. Follow-up with new cycles of te-mozolomide occurred according to the progress of each case.
he mean free time of clinical disease was 7.56 months, with a
median of 7.56 months (minimum of 4 months and maximum
of 11 months). he average free time of radiological disease
was 7.14 months, with a median of 7 months (minimum of 4 months and maximum of 10 months) (Table 2). In all cases
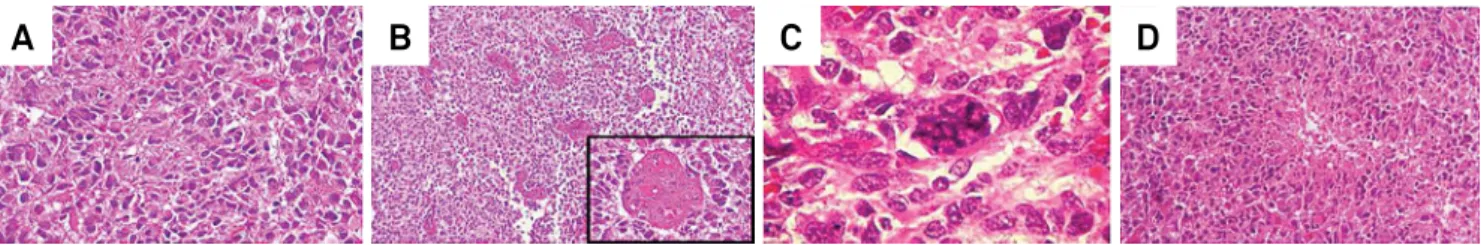
the classic GBM histological indings were observed: atypia,
mitosis, microvascular proliferation and necrosis (Figure 1).
Table 1. Technical specifications of antibodies used for immunohistochemical analyses.
Primary antibody Clone Dilution Origin
EGFR EGFR1(1005) 1:500 Santa Cruz®
MDM2 1B10 1:50 Abnova®
p53 DO-7 1:200 Dako®
IDH-1 HMab-1 1:50 Millipore®
EGFR: epidermal growth factor receptor; MDM2: murine double protein 2; p53: protein p53; IDH-1: isocitrate dehydrogenase-1.
A) Atypical cells displaying pleomorphic, irregular and hyperchromatic nuclei (40x). B) Multiple neoplastic vessels with endothelial hyperplasia (4x; inset: 40x). C) Atypical mitotic figure (100x). D) Necrotic focus (pseudopalisades) (10x).
Figure 1.Representative histological sections showing diagnostic features of glioblastoma (hematoxylin and eosin staining).
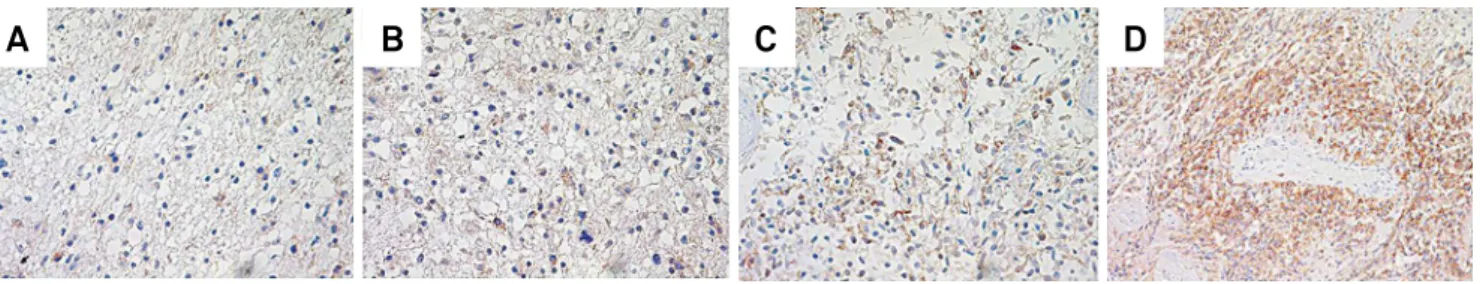
Regarding EGFR immunopattern, cytoplasmic positivity was noted with irregular distribution in the lesion,
intensi-ty ranging from weak to strong. Positiviintensi-ty for EGFR was cat -egorized in 4 classes with the following corresponding per-centage of positive cells: class 1 (0-25%), class 2 (26-50%),
class 3 (51-75%) and class 4 (76 to 100%). Within the total of
36 patients, 1 was assigned class 1, 7 class 2, 18 class 3 and 10 class 4 (Figure 2 and Table 2).
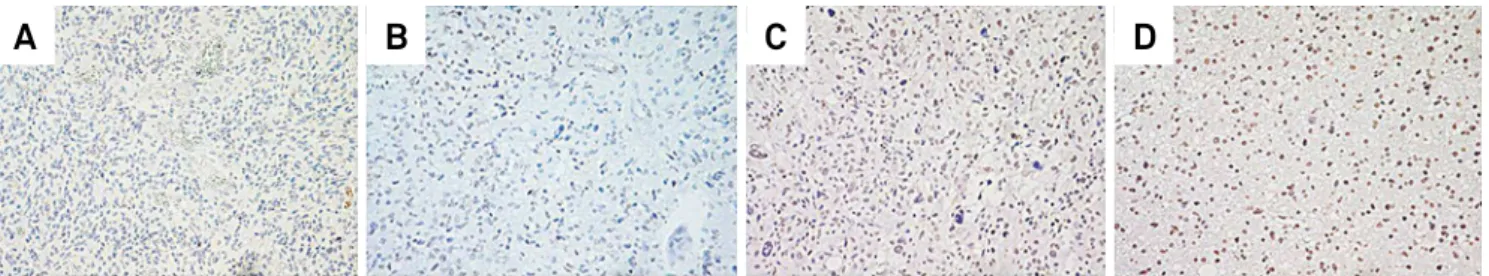
The staining pattern for p53 protein was nuclear, with an irregular tissue distribution and strong inten-sity. As used for EGFR, positivity for p53 was described in 4 classes. Thus, within the total of 36 patients, no one was assigned class 1 (0-25%), 5 were considered class 2 (26-50%), 17 class 3 (51-75%) and 14 class 4 (76-100%) (Figure 3 and Table 2).
Immunopositivity for the mutated form of IDH-1 was ob -served in one case and its pattern was cytoplasmic, ranging
from weak to strong and irregularly distributed. In parallel, we investigated a sample of low-grade difuse astrocytoma (WHO grade II) obtained from our institution iles and with known immunopositivity for this mutated enzyme (positive
external control) (Figure 4 and Table 2).
he pattern of immunostaining for MDM2 was nuclear
with an irregular tissue distribution and strong intensity. As used for EGFR and p53, positivity for MDM2 was described in 4 classes: 2 patients were allocated in class 1, 13 class 2, 16 class 3 and 5 class 4 (Figure 5 and Table 2).
Dependence, ie, a statistically signiicant relation -ship, was detected between immunostaining for p53 and
MDM2 (p-value = 0.00) and between EGFR and MDM2 (p-value = 0.04).
A negative correlation was detected between
immunos-taining for p53 and clinical survival (p-value = 0.02). In fact,
the higher the class for p53, the lower the clinical survival in months.
All correlations between mean clinical, radiological and total survivals were statistically significant and posi-tive (all p-values < 0.0001). The strongest correlation was between clinical and radiological survivals (0.79), followed by radiological and total (0.75) and clinical and total sur-vival (0.69).
Comparisons among immunohistochemical indings
between patients older or younger than 50 years of age were performed, as therapy trails have shown that younger GBM
patients show better prognosis. We correlated younger than
50 year-old individuals with EFGR, p53 and MDM2 classes 1 and 2, as we presumed that such classes would be associ-ated with a better prognosis. For the same reason, we cor-related individuals older than 50 years of age with classes 3 and 4, since we considered that those classes would imply
a worst prognosis. Nonetheless, no signiicant correlations were found (< 50 yo: EGFR class 1 (p-value = 0.23), EGFR class 2 (p-value = 0.14), p53 class 1 (p-value = 0.09), EGFR class 2 (p-value = 0.12), MDM2 class 1 (p-value = 0.13), MDM2 class 2 (p-value = 0.07); > 50 yo: EGFR class 3 (p-value = 0.12), EGFR class 4 (p-value = 0.19), p53 class 3 (p-value = 0.17), EGFR class 4 (p-value = 0.08), MDM2 class 3 (p-value = 0.08), MDM2 class 4 (p-value = 0.10)).
Finally, comparisons were made only among EGFR, p53 and MDM2 higher classes (3 and 4) and total, clinical and
ra-diological survival times. However, no correlation was sig
-niicant (Total survival - EGFR class 3 (p-value = 0.12), EGFR
Representative fields of areas classified as 1 (A), 2 (B), 3 (C) or 4 (D) (all pictures: 20x). Figure 2.Immunostaining for epidermal growth factor receptor (EGFR) in glioblastoma.
A
B
C
D
Representative fields of areas classified as 1 (A), 2 (B), 3 (C) or 4 (D). Even though some fields were assigned class 1, no specimen was considered class 1 after thoroughly analysis of the complete histological section (all pictures: 10x).
Figure 3.Immunostaining for p53 protein in glioblastoma.
class 4 (p-value = 0.09), p53 class 3 (p-value = 0.10), p53 class 4 (p-value = 0.11), MDM2 class 3 (p-value = 0.18), MDM2 class 4 (p-value = 0.08); Clinical survival - EGFR class 3 (p-value = 0.085),
EGFR class 4 (p-value = 0.065), p53 class 3 (p-value = 0.075), p53 class 4 (p-value = 0.19), MDM2 class 3 (p-value = 0.13), MDM2 class 4 (p-value = 0.17); Radiological survival - EGFR
class 3 (p-value = 0.20), EGFR class 4 (p-value = 0.16), p53 class 3 (p-value = 0.07), p53 class 4 (p-value = 0.14), MDM2 class 3 (p-value = 0.09), MDM2 class 4 (p-value = 0.14)).
DISCUSSION
In general, the set of clinical data collected from the medical records of our institution approximates the data obtained from the literature1,16,17,18. Among the 36 cases we analyzed, only one
(around 3%) was considered to be secondary. his percentage
is close to the value observed by other authors, that is, around 5%1,16,18. However, the present inding that the majority of the
tumors were localized in the frontal lobe is at variance with
Table 2. Clinical and immunohistochemical data from the 36 patients with glioblastoma whose surgical samples were analyzed in the present study.
Patient Age Genre Localization TR MFCDT MFRDT Survival Chemo Additional doses
Other drugs Radio
Other
doses IDH-1 EGFR P53 MDM2
1 79 M Frontal left Y 8 9 15 Yes Yes No Protocol No Negative 3 4 3
2 81 M Diencephalon N 8 7 12 Yes No No Protocol No Negative 3 3 3
3 56 F Frontal left Y 9 8 13 Yes Indeterminated No Protocol No Negative 2 3 2
4 61 M Frontal left Y 7 8 12 Yes No No Protocol No Negative 4 3 3
5 41 M Frontal left Y 6 5 9 Yes Yes No Protocol No Positive 4 3 2
6 42 M Temporal right N 4 4 9 Yes Yes No Protocol Yes Negative 2 3 2
7 34 F Parietal right Y 7 6 11 Yes Yes No Protocol No Negative 3 3 2
8 47 M Temporal left Y 5 5 9 Yes Yes No Protocol No Negative 4 4 3
9 24 F Frontal right Y 8 6 10 Yes Yes Yes Protocol No Negative 4 3 2
10 48 M Parietal left Y 10 9 15 Yes Yes No Protocol No Negative 2 2 1
11 77 F Frontal right N 4 4 6 Yes No No Protocol No Negative 3 4 4
12 52 F Parietal right Y 10 8 12 Yes Yes No Protocol No Negative 3 4 3
13 67 M Temporal left Y 6 6 10 Yes Yes Yes Protocol No Negative 4 3 3
14 57 M Frontal right Y 9 7 12 Yes No No Protocol No Negative 2 3 3
15 67 F Occipital left Y 7 7 10 Yes No No Protocol No Negative 3 4 3
16 62 M Frontal right Y 10 8 10 Yes No No Protocol Yes Negative 3 3 2
17 67 M Temporal left Y 6 6 9 Yes No No Protocol No Negative 3 4 2
18 38 F Frontal left N 9 10 14 Yes No No Protocol No Negative 3 3 2
19 56 F Frontal right Y 7 7 10 Yes Yes No Protocol No Negative 4 4 4
20 67 F Frontal right Y 9 10 15 Yes No No Protocol No Negative 3 4 3
21 57 F Temporal left N 7 7 11 Yes No No Protocol Yes Negative 2 4 3
22 60 F Temporal right Y 7 7 12 Yes Yes Yes Protocol No Negative 3 4 3
23 78 M Parietal left N 9 10 13 Yes No No Protocol No Negative 4 3 3
24 22 F Diencephalon N 11 7 14 Yes Yes No Protocol Yes Negative 2 3 2
25 67 F Frontal left Y 6 7 10 Yes No Yes Protocol No Negative 2 4 3
26 75 F Frontal right Y 7 8 9 Yes No No Protocol No Negative 4 4 3
27 50 F Temporal left Y 10 9 10 Yes No No Protocol No Negative 3 2 2
28 51 M Frontal right Y 5 5 9 Yes No No Protocol No Negative 4 3 2
29 46 F Temporal left Y 9 8 8 Yes No No Protocol No Negative 3 2 2
30 65 F Frontal left Y 6 7 10 Yes No No Protocol No Negative 3 4 4
31 67 F Parietal right Y 6 5 8 Yes No No Protocol No Negative 3 4 4
32 46 F Frontal right Y 8 7 13 Yes No No Protocol No Negative 1 2 1
33 56 M Parietal left Y 7 6 9 Yes Yes No Protocol No Negative 3 3 2
34 67 M Temporal left Y 6 6 10 Yes No No Protocol Yes Negative 3 3 3
35 67 F Frontal right Y 9 9 14 Yes Yes Yes Protocol No Negative 4 3 4
36 63 M Temporal left Y 10 9 14 Yes No Yes Protocol No Negative 3 2 3
Age is indicated in years. Survival is indicated in months after histopathological diagnosis. 1, 2, 3 and 4: Immunohistochemical
previous reports in which a slight preponderance of glioblasto-ma was frontal1,18. his divergence between our study and those
from others may be due to the number of patients who were evaluated, such number being higher in the latter reports.
he choice of treatment performed at our institution fol -lows what is found in several protocols of services around
the world. However, some patients were not subjected to this treatment protocol, as side efects of radiotherapy and/or
chemotherapy or clinical conditions prevented the standard treatment and, consequently, inclusion in the present study.
hus, we selected only patients who underwent the regular protocol approach. his limitation reduced the number of
patients to be included in this study. On the other hand, the
selection uniied our sample for comparison of results, thus
allowing more reliable correlations (with minimal interfer-ence from external variables).
he time free from clinical or symptomatic disease is char -acterized by the interval (in months) after surgery, from which directly or indirectly related clinical cancer manifestations are
checked, for example, the onset of seizures, headache, depres -sion, secondary infections and deep vein thrombosis. In this
investigation, the average was 7.56 months. To our knowledge,
this is an original data in a Brazilian sample, since we did not
ind such information in previous studies for comparison. he free time of radiological disease (FTRD) is the inter -val (in months) between the surgical resection and the onset
or increase of the lesion detected by radiological methods,
regardless of clinical manifestations. In our work this interval
showed an average of 7.14 months, slightly lower than the free
time of clinical disease. his diference could be explained by
the fact that the lesion usually increases or reappears before clinical manifestations. A larger FTRD would be expected if patients only performed radiological examinations after its
clinical manifestations. However, it is not what happens at the Department of Neurosurgery at UNICAMP, where visits and pre-stipulated regular checkups occur.
Regarding the immunostaining, positivity for EGFR was cytoplasmic and focally distributed, ie, some areas of the
le-sion with strong or weaker labeling. It is possible that the pat -tern of immunostaining obtained be the result of technical
pre-analytical issues like ixation and / or processing of the
material. Indeed, the labeling may vary according to the tech-nique used, the exposure time to antibodies and lesion
sam-pling. With respect to the immunostaining pattern for EGFR
that we observed it was assigned class 3 and 4 ( from 50% to 100% of the section analyzed) in 28 of 36 cases. Such range of percentage is similar to that described in other studies in which the wild type of EGFR was studied1,4,19,20. hus, our clas
-siication allows a reliable comparison with previous reports. he immunostaining pattern for p53 that we observed was nuclear and the distribution, difuse. Of the 36 cases analyzed,
31 were positive for p53 mutated in at least 50% of each evalu-ated histological sections (classes 3 and 4). Such distribution could be explained by the fact that p53 mutation is an early event in the pathogenesis of glioblastoma and the cases that we evaluated were constituted by tumors in a later stage, thus harboring a wide distribution of the mutated protein in the
tu-mor section evaluated. his result is close to those reported by
other authors1,6.
he investigation of the mutated form of IDH-1 in our
study allowed the detection of only one positive case, ie,
about 3% of individuals. his ratio is close to the number
found in more recent studies1,8, which is around 5%. he
mutation of IDH-1 seems to point to a slightly better prog -nosis and perhaps this is the reason to be found more fre-quently in secondary tumors8,9,10. However, in our sample of
patients, we found only one case of secondary glioblastoma,
which was negative for the mutated form of IDH-1. his re -sult can be explained by the fact that the average probability
Representative fields of areas classified as 1 (A), 2 (B), 3 (C) or 4 (D) (all pictures: 20x). Figure 5.Immunostaining for Murine Double Protein 2 (MDM2) in glioblastoma.
A
B
C
D
A) Cytoplasmic positivity (yellow arrow) in neoplastic astrocytes of a WHO grade II diffuse astrocytoma (20x). B) Cytoplasmic staining (yellow arrow) similar to that observed in the lower grade neoplastic cells. The pattern shown was verified in only one of the glioblastoma specimens evaluated and showed irregular distribution throughout the lesion (20x).
Figure 4.Immunostaining for the mutated form of isocitrate dehydrogenase-1 (IDH-1) in low-grade diffuse astrocytoma and glioblastoma.
of a secondary glioblastoma be positive for this mutation is less than 20%1,8,9.
he immunostaining for Murine Double Protein 2
(MDM2) was nuclear with an irregular distribution through-out the section. Similarly to what was observed in the EGFR-stained specimens, some areas of the lesion showed
strong labeling whereas others were weakly marked. Such
focal distribution might be explained by the same reasons described above for EGFR, ie, variability in histological
tu-mor sample and technical conditions for ixation and immu
-nohistochemistry. With respect to MDM2 gene expression in
glioblastomas, their ampliication and overexpression in the
tumor appear to relate to early pathogenesis and may be pos-itively correlated with TP53 gene mutations1,2. Speciically, in
this study 21 cases showed positivity that was categorized as class 3 and 4. MDM2 positivity in GBM was previously report-ed in a similar proportion of cases1,2, however the pattern of
distribution in the sample was not speciied.
Regarding the analysis of correlations between clini-cal and morphologiclini-cal data, dependence was detected, ie, a
statistically signiicant relationship between p53 and MDM2 immunopatterns (p-value = 0.00) and between staining for EGFR and MDM2 (p-value = 0.04). Particularly, the relation -ship between the expression of the mutated form of p53 and MDM2 expression is well established in the literature1,2. his
relationship supports the fact that these biological events are early changes in high-grade astrocytomas, increasing cell sur-vival due to decreased ability of cells to trigger apoptotic death. In the present study, there is a negative statistically signif-icant relationship between p53 immunostaining and clinical
survival (p-value = 0.02). he correlation between the expres -sion of MDM2 and that of the wild variant of EGFR was
posi-tive (p-value = 0.04). It is known that overexpression of EGFR contributes to the diferentiation, proliferation, survival,
migration and invasiveness of cancer cells and increases tumor angiogenesis1. All these features reduce the
respon-siveness to chemotherapy and radiotherapy. Furthermore, MDM2 gene encodes a nuclear enzyme called E3 ubiquitin li-gase that promotes tumor formation by targeting suppressor genes such as p53, for proteosomal degradation1,2. Our
cor-relation data suggest that the cor-relationship between the wild type EGFR and MDM2 protein would be indirect and prob-ably mediated by TP53 gene1,2.
he correlations between clinical, radiological and over
-all survival rates were -all positive and statistic-ally signii
-cant with p-value less than 0.0001. he strongest correla -tion was between clinical and radiological survival rates
(R = 0.79), followed by radiological and total (R = 0.75) and clinical and total (R = 0.69) rates. hese values are naturally
expected as an increase in tumor visualized through imag-ing techniques directly yields the appearance of symptoms (clinical survival) and subsequent death (overall survival). On
the other hand, we observed a lack of correlation among age
(< 50 or > 50 years old) and immunohistochemical classes for EGFR, p53 and MDM2 (1 and 2 for younger; 3 and 4 for old-er patients), as well as among EGFR, p53 and MDM2 high-er classes and total, clinical and radiological survival times. Again, the limited sample we evaluated may have hampered
the identiication of signiicant relations.
Our study allows proposing the hypothesis of correlation between EGFR and p53 and between MDM2 and p53 classes of immunostaining patterns. It also points to a negative rela-tion between p53 and total survival. In addirela-tion to corrobo-rating previous studies on the clinical-radiological and
path-ological correlations, our study describes for the irst time a
casuistic from a Brazilian institution. Although limited by the
relative small number of patients, this work intends to con
-tribute to the advancement of knowledge on GBM in Brazil.
References
1. Wen PY, Kesari S. Malignant gliomas in adults. N Engl J Med. 2008;359(5):492-507. http://dx.doi.org/10.1056/NEJMra0708126
2. Bishop JM. Molecular themes in oncogenesis. Cell. 1991;64(2):235-48. http://dx.doi.org/10.1016/0092-8674(91)90636-D
3. Louis DN, Ohgaki H, Wiestler OD, Cavenee (Eds). WHO classification of tumors of the central nervous system. 4th Edition. Lyon: International Agency for Research on Cancer, 2007: 33-49.
4. Pelloski CE, Ballman KV, Furth AF, Zhang L, Lin E, Sulman EP et al. Epidermal growth factor receptor variant III status defines clinically distinct subtypes of glioblastoma. J Clin Oncol. 2007; 25(16):2288-94. http://dx.doi.org/10.1200/JCO.2006.08.0705
5. Collins VP. Mechanisms of disease: genetic predictors of response to treatment in brain tumors. Nat Clin Pract Oncol. 2007;4(6):362-74. http://dx.doi.org/10.1038/ncponc0820
6. Furnari FB, Fenton T, Bachoo RM, Mukasa A, Stommel JM, Stegh A et al. Malignant astrocytic glioma: genetics, biology, and paths to treatment. Genes Dev. 2007;21(21):2683-710. http://dx.doi.org/10.1101/gad.1596707
7. Sathornsumetee S, Reardon DA, Desjardins A, Quinn JA, Vredenburgh JJ, Rich JN. Molecularly targeted therapy for malignant glioma. Cancer. 2007;110(1):13-24. http://dx.doi.org/10.1002/cncr.22741
8. Dang L, White DW, Gross S, Bennett BD, Bittinger MA, Driggers EM et al. Cancer-associated IDH1 mutations produce 2-hydroxyglutarate. Nature. 2009;462(7274):739-44. http://dx.doi.org/10.1038/nature08617
9. Smeitink J. Metabolism, gliomas, and IDH1. N Engl J Med. 2010;362(12):1144-5. http://dx.doi.org/10.1056/NEJMcibr0912922
10. Yan H, Parsons DW, Jin G, McLendon R, Rasheed BA, Yuan W et al. IDH1 and IDH2 mutations in gliomas. N Engl J Med. 2009;360(8): 765-73. http://dx.doi.org/10.1056/NEJMoa0808710
11. Juratli TA, Kirsch M, Geiger K, Klink B, Leipnitz E, Pinzer T et al. The prognostic value of IDH mutations and MGMT promoter status in secpmdary high-grade gliomas. J Neurooncol. 2012;110(3):325-33. http://dx.doi.org/10.1007/s11060-012-0977-2
13. Ohno M, Narita Y, Miyakita Y, Matsushita Y, Yoshida A, Fukushima S et al. Secondary glioblastomas with IDH1/2 mutations have longer glioma history from preceding lower-grade gliomas. Brain Tumor Pathol. 2013;30(4):224-32. http://dx.doi.org/10.1007/s10014-013-0140-6
14. Giordana MT, Duó D, Gasverde S, Trevisan E, Boghi A, Morra I et al. MDM2 overexpression is associated with short survival in adults with medulloblastoma. Neuro Oncol. 2002;4(2):115-22. http://dx.doi.org/10.1093/neuonc/4.2.115
15. Korkolopoulou P, Christodoulou P., Kouzelis K; Hadjiyannakis M. Priftis A, Stamoulis G et al. MDM2 and p53 expression in gliomas: a multivariate survival analysis including proliferation markers and epidermal growth factor receptor. Br J Cancer. 1997;75(9):1269-78. http://dx.doi.org/10.1038/bjc.1997.216
16. Brandsma D, Stalpers L, Taal W, Sminia P, van den Bent MJ. Clinical features, mechanisms, and management of pseudoprogression in malignant gliomas. Lancet Oncol 2008;9(5):453-61. http://dx.doi.org/10.1016/S1470-2045(08)70125-6
17. Brem SS, Bierman PJ, Black PH, Brem H, Chamberlain MC, Chiocca EA et al. Central nervous system cancers. J Natl Compr Canc Netw. 2008;6(5):456-504.
18. Barajas Jr RF, Phillips JJ, Parvataneni R, Molinaro A, Essock-Burnes E, Bourne G et al. Regional variation in histopathologic features of tumor specimens from treatment-naive glioblastoma correlates with anatomic and physiologic MR imaging. Neuro-oncol. 2012;14(7):942-54. http://dx.doi.org/10.1093/neuonc/nos128
19. Jain RK, di Tomaso E, Duda DG, Loeffler JS, Sorensen AG, Batchelor TT. Angiogenesis in brain tumours. Nat Rev Neurosci. 2007;8(8):610-22. http://dx.doi.org/10.1038/nrn2175