Brain spect in mesial
temporal lobe epilepsy
Comparison between visual analysis and spm
Bárbara Juarez Amorim1, Celso Darío Ramos1,
Allan Oliveira dos Santos1, Mariana da Cunha Lopes de Lima1, Li Li Min2, Edwaldo Eduardo Camargo1, Fernando Cendes2,
Elba Cristina Sá de Camargo Etchebehere1
ABSTRACT
Objective: To compare the accuracy of SPM and visual analysis of brain SPECT in patients with mesial temporal lobe epilepsy (MTLE). Method: Interictal and ictal SPECTs of 22 patients with MTLE were performed. Visual analysis were performed in interictal (VISUAL(inter)) and ictal (VISUAL(ictal/inter)) studies. SPM analysis consisted of comparing interictal (SPM(inter)) and ictal SPECTs (SPM(ictal)) of each patient to control group and by comparing perfusion of temporal lobes in ictal and interictal studies among themselves (SPM(ictal/inter)). Results: For detection of the epileptogenic focus, the sensitivities were as follows: VISUAL(inter)=68%; VISUAL(ictal/inter)=100%; SPM(inter)=45%; SPM(ictal)=64% and SPM(ictal/inter)=77%. SPM was able to detect more areas of hyperperfusion and hypoperfusion. Conclusion: SPM did not improve the sensitivity to detect epileptogenic focus. However, SPM detected different regions of hypoperfusion and hyperperfusion and is therefore a helpful tool for better understand pathophysiology of seizures in MTLE. Key words: brain perfusion, SPECT, SPM, seizures, epilepsy.
SPECT cerebral na epilepsia de lobo temporal mesial: comparação entre análise visual e SPM
RESUMO
Objetivo: Comparar a acurácia do SPM com a análise visual na detecção do foco epileptogênico e alterações perfusionais à distância no SPECT cerebral. Método: Foram realizados os SPECTs ictal e interictal de 22 pacientes com epilepsia de lobo temporal mesial (ELTM). A análise visual foi realizada nos estudos interictal (VISUAL(inter)) e ictal (VISUAL(ictal/inter)). Na análise com SPM foi comparado o estudo interictal (SPM(inter)) e ictal (SPM(ictal)) de cada paciente com o grupo controle e comparou-se a perfusão dos lobos temporais entre os estudos ictal e interictal (SPM(ictal/inter)). Resultados: Para a detecção do foco epileptogênico, as sensibilidades foram as seguintes: VISUAL(inter)=68%; VISUAL(ictal/inter)=100%; SPM(inter)=45%; SPM(ictal)=64% and SPM(ictal/inter)=77%. O SPM foi capaz de detectar mais áreas de hiperperfusão e hipoperfusão. Conclusão: O SPM não aumentou a sensibilidade na detecção do foco epileptogênico. Entretanto, o SPM detectou diferentes regiões de hipoperfusão e hiperperfusão e portanto, ele pode ser uma ferramenta de ajuda para se melhor entender a patofisiologia das crises na ELTM. Palavras-chave: SPECT cerebral, SPECT, SPM, crises, epilepsia.
Correspondence Bárbara Juarez Amorim Serviço de Medicina Nuclear Hospital das Clínicas da Unicamp Caixa Postal 6142
13083-888 Campinas SP - Brasil E-mail: [email protected]
Received 24 June 2009
Received in final form 29 September 2009 Accepted 15 October 2009.
School of Medical Sciences, Campinas State University (Unicamp), Campinas SP, Brazil: 1Division of Nuclear Medicine, Department of Radiology; 2Department of Neurology.
he most frequent type of epilepsy re-fractory to antiepileptic drugs is complex partial seizure and the majority of foci are in the temporal lobe1. Temporal lobe
ep-ilepsy (TLE) is recognized as a specific syndrome2 because of its high prevalence.
on histological analysis3. Temporal lobe resection gives a
complete or almost complete control of seizures in about 70% to 80% of patients4. he success of surgery relies on
tests that can help identify the source and side of the sei-zures. Brain perfusion single photon emission comput-ed tomography (SPECT) is an accurate method for de-tecting the origin of the seizure. hese epileptogenic foci classically appear as a region of normal perfusion or hy-poperfusion in the interictal study that becomes hyper-perfused in ictal study. he speciicity of this combination is nearly 100% by visual analysis alone. he sensitivity for detection of the origin of the epileptic focus in patients with TLE by the visual assessment of interictal SPECTs alone is about 44%, while the sensitivity of the evaluation of the ictal SPECT study alone has a sensitivity of nearly 96%5. In addition to visual inspection, statistical
paramet-ric mapping (SPM) may be used to help localize the epi-leptic focus. SPM is a software that allows comparisons, voxel by voxel, of the radioactivity in the entire brain of the patient to a control group.
he majority of studies using SPM SPECT in epilep-sy compare the entire patient population to the control group6-8, while a few studies compare SPM SPECT of each
patient to the control group. SPM sensitivity in ictal SPECT, in all these studies, ranges from 50%6 to 89%9. However,
SPM sensitivities are not compared to visual analysis6,10-13.
There are only two studies9,14 comparing SPM
sensi-tivity to visual analysis in SPECT in patients with TLE. In the present study, SPM SPECT analysis was per-formed comparing patients with chronic refractory MTLE to age-matched neurologically healthy controls.
We hypothesized that SPM SPECT may have a high sensitivity for detection of the epileptogenic focus and distant perfusion alterations if the SPM SPECT analysis was performed in the same manner as the visual analy-sis (by comparing the ictal and interictal studies). To our knowledge, this SPM SPECT analysis has not yet been described.
METHOD
patients and control group
Twenty-two patients with chronic drug-refractory MTLE were studied (14 women, 8 men; mean age: 28 years). All patients were submitted to serial eletrencepha-lography (EEG), long-term-video-EEG monitoring, mag-netic resonance imaging (MRI) and ictal and interictal brain SPECT imaging. he side of the epileptogenic focus was determined by evaluation of the clinical data, EEG indings, long-term-video-EEG and MRI. Histopatholog-ical analysis and surgHistopatholog-ical outcome data were used to con-irm the side and exact location of the epileptogenic fo-cus in 18/22 patients (82%).
he control group consisted of 50 healthy volunteers
with ages between 25 and 53 years, mean age 31 years, 29 women and 21 men.
All patients signed an informed consent and the study was approved by the Ethics Committee of the School of Medical Sciences, Campinas State University (Unicamp), Campinas SP, Brazil.
electroencephalography
All patients underwent serial routine EEG recording using the 10-20 system with additional anterior tempo-ral and zygomatic electrodes. hey were also submitted to long-term-video-EEG monitoring with scalp electrodes for seizure recording.
Magnetic resonance imaging (MRI)
MRI was performed in a 2.0 T scanner (Elscint Pres-tige, Haifa, Israel). he imaging protocol consisted of: (a) sagital T1 spin-echo, 6 mm thick (TR=430, TE=12) for optimal orientation of the subsequent images; (b) coronal T1 inversion recovery (IR), 3 mm thick (lip angle=200o;
TR=2700, TE=14, TI=840, matrix=130 × 256, FOV=
16 × 18 cm); (c) coronal T2-weighted “fast spin-echo” (FSE), 3-4mm thick (lip angle=120o, TR=4800, TE=129,
matrix=252×320, FOV=18×18 cm); (d) axial images parallel to the long axis of the hippocampus; T1 gradi-ent echo (GRE), 3 mm thick (flip angle=70o, TR=200,
TE=5, matrix=180×232, FOV=22×22 cm); (e) axial T2 FSE, 4 mm thick (lip angle=120o, TR=6800, TE=129,
matrix=252×328, FOV=21×23 cm); (f ) volumetric (3D) T1 GRE, acquired in the sagital plane for multiplanar re-construction, 1 mm thick (lip angle=35o, TR=22, TE=9,
matrix=256×220, FOV=23×25 cm).
Visual analysis of MRI and multi-planar reconstruc-tion were systematically performed in a workstareconstruc-tion (O2 Silicon Graic) using the Omnipro software (Elscint Pres-tige, Haifa, Israel).
Brain spect acquisition
Both interictal and ictal studies were acquired for all patients. For all the control participants as well as for the patients’ interictal scans, the participants were asked to rest in a dark, quiet room for 15 minutes, with a per-manent intravenous access through a butterfly connect-ed to a catheter with saline solution. While at rest, 1110 MBq (30 mCi) of 99mTc-ECD was injected. he
partici-pants rested for another 10 minutes prior to the SPECT acquisition.
saline solution. To ensure a fast injection of the radiop-harmaceutical, the syringe was connected to the cathe-ter and protected with a lead shield. Upon seizure onset, 1110 MBq (30 mCi) of 99mTc-ECD was injected as quickly
as possible. Seizures were conirmed by the EEG and vid-eo recordings. SPECT images were acquired 30-90 min-utes after cessation of the seizure and stabilization of pa-tient symptoms.
All SPECT images were performed in a computed scintillation camera with a fan-beam collimator. Sixty im-ages were acquired in a 64×64 matrix, every 6 degrees, in a total of 360 degrees. Raw data were reconstructed by il-tered back projection and attenuation correction was per-formed using Chang’s method with a 0.115 attenuation coeicient. Images were displayed in the transaxial, coro-nal, sagital and temporal (parallel slices to the longest axis of the temporal lobe) planes for interpretation.
Visual analysis
Qualitative analysis was performed by two experi-enced nuclear physicians who searched for regions of hy-poperfusion or hyperperfusion in the brain SPECT im-ages by comparing the perfusion in the cortical and sub-cortical regions with the perfusion in the cerebellum and looking for hemisphere asymmetries. he observers were aware that all patients had MTLE but blinded from all other patient clinical data.
he visual analysis of the interictal SPECTs were la-beled VISUAL(inter) and were analyzed by looking for re-gions of hypoperfusion in the temporal lobes.
he ictal SPECTs were named VISUAL(ictal/inter) and were analyzed by looking for regions of hypeperfu-sion in the temporal lobes during the ictal study that was hypoperfused or had normal perfusion in the interictal study. In the VISUAL(ictal/inter) analysis, distant regions of hyper and hypoperfusion were also evaluated.
processing of images in spM
he reconstructed SPECT images were converted into the Analyze format using MRIcro software (www.mric-ro.com). In this software the SPECTs from patients with left epileptogenic focus were left-right lipped, in order to evaluate all MTLE patients as a single group (thus all epileptogenic foci were on the right hemisphere). Vox-el-based analysis was performed using SPM2 (Wellcome Department of Cognitive Neurology, www.fil.ion.ucl. ac.uk). To allow group comparison, the size and shape of each individual’s scans were normalized to stereotaxic space (warping each image to match the default SPECT template that is distributed with SPM2). his process in-volves a 12 parameter linear transformation. he normal-ized images were smoothed by convolution with an
Iso-tropic Gaussian Kernel (FWHM) of 6 mm. The 99m
Tc-ECD distribution was standardized to the mean global uptake using a proportional scale.
spM analysis
he following SPM analyses were performed using a two-sample t-test:
1. SPM(inter) – he interictal SPECTs of each patient
was compared to the control group, similar to visual anal-ysis for detection of the epileptogenic focus (p<0.05; clus-ter ≥32 voxels). Only perfusion alterations in the tempo-ral lobes were analyzed. he epileptogenic focus was con-sidered a true positive study if the perfusion in the focus was lower than the perfusion in the contralateral tem-poral lobe.
2. SPM(ictal) – he ictal SPECT from each patient
was compared to the control group. In this analysis all regions of hyper and hypoperfusion were considered (p<0.05; cluster ≥32 voxels).
he epileptogenic focus was determined (a true pos-itive study) if the perfusion in the focus was higher than the perfusion in the contralateral temporal lobe.
he time of injection was compared with perfusion alterations using the Spearman’s correlation coeicient; p<0.05.
Areas of hyperperfusion were correlated among themselves using the Spearman’s correlation coeicient; p<0.05. These areas were the temporal lobes, frontal lobes, parietal lobes, basal ganglia bilaterally and the cer-ebellar hemispheres.
3. SPM(ictal/inter) – he perfusion of the
tempo-ral lobes in the ictal and interictal studies were correlat-ed. his analysis was performed to improve the sensitiv-ity of SPM and to approximate the SPM with the clini-cal practice.
RESULTS
patient group
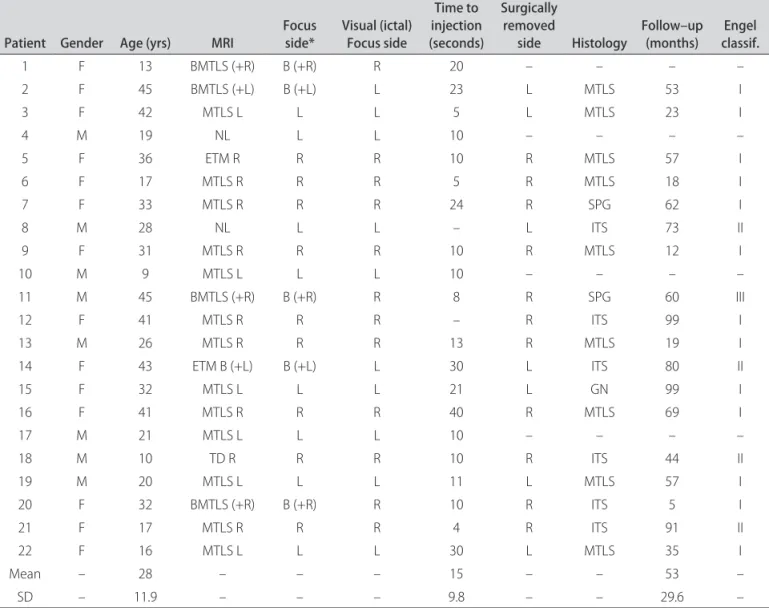
Among the 22 patients studied, nine patients were classiied as having right temporal lobe foci, eight as hav-ing left temporal lobe foci and ive as asymmetric bilat-eral foci (Table 1).
The five patients with bilateral foci had asymmet-ric hippocampal atrophy on MRI and a predominance of the epileptiforme abnormalities and seizure onsets in one side, on the video-EEG recordings.
Eighteen patients were submitted to surgery. Histo-pathological analysis showed mesial temporal sclerosis in 9 patients, subpial gliosis in 2 patients and a glial nodule in 1 patient. In 6 patients, the tissue sample was insui-cient for proper histopathological evaluation. hirteen pa-tients (72%) were classiied as Engel class I, four papa-tients (22%) as Engel class II and one (6%) as Engel class III15.
here were no signiicant diferences among the con-trol and patient groups in relation to gender (p=0.2018; Chi-square test) or age (p=0.3294; Mann-Whitney test).
he mean time of the radiotracer injection after the beginning of the seizure was 15 seconds (from 4 to 40 seconds).
Visual analysis
1. VISUAL(inter) – In the interictal study,
tempo-ral lobe hypoperfusion (the epileptogenic focus) was ob-served in 15 patients (sensitivity of 68%). Two patients had hypoperfusion in both temporal lobes and therefore their studies were not considered as true positive. hese two patients had bilateral foci.
2. VISUAL(ictal/inter) – In the ictal study, temporal
lobe hyperperfusion (epileptogenic focus) was observed in all 22 patients, including one patient with a normal MRI. his patient was classiied as Engel II after surgery.
Ipsilateral hyperperfusion of the basal ganglia was ob-served in 12 patients and bilateral basal ganglia hyper-perfusion, in two patients. Other hyperperfused regions were the ipsilateral thalamus (2/22), contralateral thala-mus (1/22), bilateral thalami (2/22), ipsilateral cerebellar hemisphere (1/22) and contralateral temporal lobe (1/22).
Hypoperfused regions were also noted during seizure and these included the bilateral frontal lobes (7/22), ip-silateral frontal lobe (3/22), difuse cortical hypoperfu-sion (4/22), bilateral parieto-occipital region (1/22), ipsi-lateral parieto-occipital region (1/22), contraipsi-lateral pari-etal lobe (1/22), ipsilateral paripari-etal lobe (1/22) and con-tralateral temporal lobe (1/22).
spM analysis
1. SPM(inter) – he epileptogenic focus was detected
in ten patients (sensitivity of 45%). Two studies were sidered false positive because hypoperfusion in the
con-table 1. Patient data.
patient Gender Age (yrs) MRI Focus side* Visual (ictal)Focus side
time to injection (seconds)
surgically removed
side Histology Follow–up (months) classif.engel
1 F 13 BMTLS (+R) B (+R) R 20 – – – –
2 F 45 BMTLS (+L) B (+L) L 23 L MTLS 53 I
3 F 42 MTLS L L L 5 L MTLS 23 I
4 M 19 NL L L 10 – – – –
5 F 36 ETM R R R 10 R MTLS 57 I
6 F 17 MTLS R R R 5 R MTLS 18 I
7 F 33 MTLS R R R 24 R SPG 62 I
8 M 28 NL L L – L ITS 73 II
9 F 31 MTLS R R R 10 R MTLS 12 I
10 M 9 MTLS L L L 10 – – – –
11 M 45 BMTLS (+R) B (+R) R 8 R SPG 60 III
12 F 41 MTLS R R R – R ITS 99 I
13 M 26 MTLS R R R 13 R MTLS 19 I
14 F 43 ETM B (+L) B (+L) L 30 L ITS 80 II
15 F 32 MTLS L L L 21 L GN 99 I
16 F 41 MTLS R R R 40 R MTLS 69 I
17 M 21 MTLS L L L 10 – – – –
18 M 10 TD R R R 10 R ITS 44 II
19 M 20 MTLS L L L 11 L MTLS 57 I
20 F 32 BMTLS (+R) B (+R) R 10 R ITS 5 I
21 F 17 MTLS R R R 4 R ITS 91 II
22 F 16 MTLS L L L 30 L MTLS 35 I
Mean – 28 – – – 15 – – 53 –
SD – 11.9 – – – 9.8 – – 29.6 –
tralateral temporal lobe was more signiicant than in the epileptogenic focus.
2. SPM(ictal) – he epileptogenic focus was detected
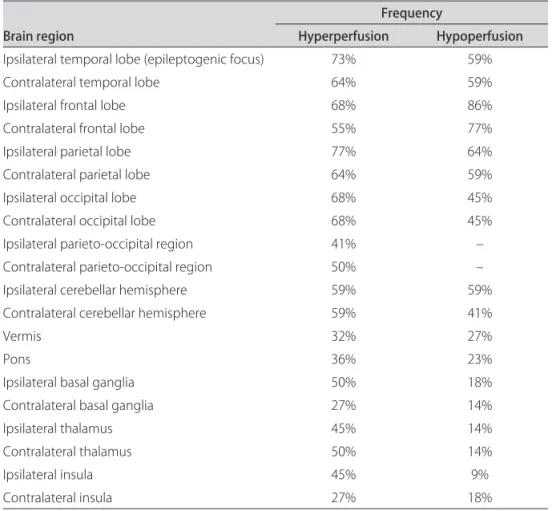
in 14 patients (sensitivity of 64%) (Fig 1). here were two studies considered false positive because hyperperfusion was more signiicant in the contralateral temporal lobe. he distant perfusion alterations detected by this analy-sis are displayed in Table 2.
here were no signiicant correlations between in-jection time and regions of hyperperfusion (p=0.4098; p=0.0727) (Fig 2) and hypoperfusion (p=–0.3026; p=0.1946) (Fig 3). here was a tendency to ind more
re-gions of hyperperfusion when the time elapsed between the onset of seizure and injection was longer. In contrast, there was a tendency to ind more regions of hypoperfu-sion when the time elapsed between the onset of seizure and injection was shorter.
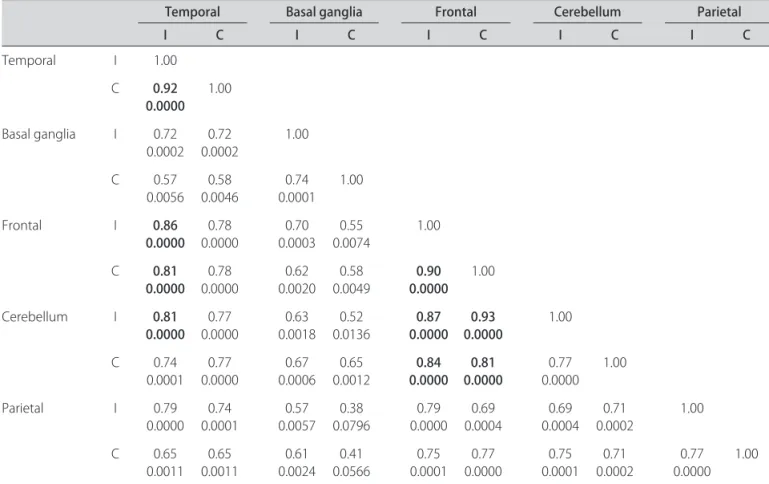
Hyperperfusion in the epileptogenic focus correlated strongly with hyperperfusion in the contralateral tempo-ral lobe, ipsilatetempo-ral frontal and conttempo-ralatetempo-ral frontal and ipsilateral cerebellar hemisphere. Hyperperfusion in the ipsilateral frontal lobe had a strong correlation with the contralateral frontal lobe, the ipsilateral cerebellar hemi-sphere and the contralateral cerebellar hemihemi-sphere.
Con-Fig 1. SPM(ictal) result from one patient (p<0.05). It is observed a marked hyperperfusion in the mesial ipsilateral temporal lobe (epilepto-genic focus) and a less intense hyperperfusion in the contralateral temporal lobe.
table 2. Areas of distant hyper and hypoperfusion identiied in SPM(ictal) (p<0.05).
Brain region
Frequency
Hyperperfusion Hypoperfusion Ipsilateral temporal lobe (epileptogenic focus) 73% 59%
Contralateral temporal lobe 64% 59%
Ipsilateral frontal lobe 68% 86%
Contralateral frontal lobe 55% 77%
Ipsilateral parietal lobe 77% 64%
Contralateral parietal lobe 64% 59%
Ipsilateral occipital lobe 68% 45%
Contralateral occipital lobe 68% 45%
Ipsilateral parieto-occipital region 41% –
Contralateral parieto-occipital region 50% –
Ipsilateral cerebellar hemisphere 59% 59%
Contralateral cerebellar hemisphere 59% 41%
Vermis 32% 27%
Pons 36% 23%
Ipsilateral basal ganglia 50% 18%
Contralateral basal ganglia 27% 14%
Ipsilateral thalamus 45% 14%
Contralateral thalamus 50% 14%
Ipsilateral insula 45% 9%
tralateral frontal lobe hyperperfusion had a strong corre-lation with the ipsilateral cerebellar hemisphere and the contralateral cerebellar hemisphere (Table 3).
3. SPM(ictal/inter) – The detection of the
epilep-togenic focus by this methodology had a sensitivity of 77% which was higher than the sensitivity of 64% from the SPM(ictal) . he two false positive studies seen in the SPM(ictal) analysis were considered true positive in this analysis, since the perfusion in the epileptogenic focus was compared among the ictal and interictal studies, and not among lobe hemispheres in the same study.
DISCUSSION
SPM has been already performed in the TLE patients7,8,12,16. We previously studied a group of MTLE
using SPM16 and did not ind signiicant areas of
hypop-erfusion in the interictal SPECT images. However, we did ind signiicant hyperperfusion in the temporal lobe (ep-ileptogenic focus) in the ictal SPECT images. his type of group analysis is helpful only to describe a pathologi-cal behavior in a group of patients with a speciic disor-der, but is not helpful to detect the epileptogenic focus in an individual patient.
Fig 2. Dispersion of hyperperfusion voxels versus the injection time.
0 10 20
Injection time
30 40
0
100000
200000
V
o
x
e
ls nu
mb
e
r
300000
Fig 3. Dispersion of hypoperfusion voxels versus the injection time.
0 10 20
Injection time
30 40
0
100000
200000
V
o
x
e
ls nu
mb
e
r 300000
400000
table 3. Correlation among areas of hyperperfusion (Spearman’s coeicient and p-values).
temporal Basal ganglia Frontal cerebellum parietal
I c I c I c I c I c
Temporal I 1.00
C 0.92 0.0000
1.00
Basal ganglia I 0.72
0.0002 0.00020.72 1.00 C 0.57
0.0056 0.58 0.0046
0.74 0.0001
1.00
Frontal I 0.86
0.0000 0.78 0.0000
0.70 0.0003
0.55 0.0074
1.00
C 0.81 0.0000
0.78
0.0000 0.00200.62 0.00490.58 0.00000.90 1.00
Cerebellum I 0.81
0.0000 0.00000.77 0.00180.63 0.01360.52 0.00000.87 0.00000.93 1.00 C 0.74
0.0001 0.77 0.0000
0.67 0.0006
0.65
0.0012 0.00000.84 0.00000.81
0.77 0.0000
1.00
Parietal I 0.79
0.0000 0.00010.74 0.00570.57 0.07960.38 0.00000.79 0.00040.69 0.00040.69 0.00020.71 1.00
C 0.65
0.0011 0.00110.65 0.00240.61 0.05660.41 0.00010.75 0.00000.77 0.00010.75 0.00020.71 0.00000.77 1.00
he voxel based statistical analysis with SPM has in-creasingly become more useful in neuroimaging, how-ever only two studies compare SPM and visual analysis sensitivities9,14. In the present study, SPM was used in
or-der to increase the detection of the epileptogenic focus and also help identify distant perfusion alterations.
he VISUAL(inter) analysis had a sensitivity of 68% which was slightly higher than the interictal SPECT sen-sitivity reported in the literature. In the metanalysis by Devous et al.5 their sensitivity was of 44% for TLE, and
included almost only visual analysis. A possible explana-tion for the high sensitivity in our study is that the nu-clear medicine physicians analyzed the interictal and ic-tal SPECTs together, possibly overestimating alterations seen in the interictal studies.
Sensitivity of SPM(inter) analysis was 45%, which was lower than the VISUAL(inter) analysis. Two false positive cases were due to patients with bilateral temporal lobe sclerosis on MR images, with predominance on one side. VISUAL(ictal/inter) analysis had a sensitivity of 100% which was similar to the 97% sensitivity described by De-vous et al.5.
Detection of the epileptogenic focus by the SPM(ictal) had a sensitivity of 64%. his sensitivity was inferior to the VISUAL(ictal) analysis. Studies have shown the SPM sen-sitivity to range from 50%6 to 89%9. Only two studies9,14
performed a comparison between SPM and visual analy-sis and both found identical sensitivities: 80% sensitivity by Bruggeman et al.14 and 89% sensitivity by Lee et al.9.
he SPM(ictal/inter) analysis showed the highest sen-sitivity (77%) among the SPM analyses. We tried to ap-proximate the SPM analysis to the visual analysis per-formed in routine clinical practice in order to observe the capacity of SPM to detect the epileptogenic focus, and still, VISUAL(ictal/inter) showed a higher sensitiv-ity (100% vs 77%).
here are two possibile explanations for the lower sen-sitivity of SPM(ictal/inter) compared to the VISUAL(ictal/ inter) analysis:
1. A 64 ×64 matrix was used to perform these stud-ies, which has a lower resolution and could pose as a problem in the SPM processing. Even so, the SPM sen-sitivities obtained in this study were very similar to that described in the literature.
2. Variation of image signal due to diferences in the injected and absorbed doses. A global normalization of SPM images is performed. However, when there is a large variation, this normalization may not be suicient and most commonly occurs in the ictal studies because the global increase in brain metabolism is assymetric among patients.
SPM did not have a better performance than visual analysis for detection of the epileptogenic focus.
How-ever, SPM was able to detect more areas hyperperfusion and hypoperfusion in the brain.
VISUAL(ictal/inter) analysis detected basal ganglia hyperperfusion in 55% of patients while in the SPM(inter) this inding was noted in 50% of the patients. Basal gan-glia have many connections with the frontal and temporal lobes and hyperperfusion in this region is probably due to activation of the corticostriatal pathway17,18. Activation of
the basal ganglia, which can occur in MTLE, can stimu-late the corticopontocerebellar pathways and cause hyper-perfusion in contralateral cerebellar hemisphere as well 19-21. However, Marks et al.22 observed that in TLE,
contral-ateral cerebellar hyperperfusion occurs mainly secondary to ipsilateral frontal lobe hyperperfusion, since the tem-poral lobe only has a few bilateral projections to the cer-ebellum. his description by Marks et al.22 was conirmed
in our study in the SPM(ictal/inter) analysis because fron-tal lobe hyperperfusion had a strong correlation with cer-ebellar hemisphere hyperperfusion.
SPM(ictal/inter) analysis detected hyperperfusion in both occipital lobes in 68% of patients. his was probably due to hyperactivation of these regions because injection was performed without supression of lights, in contrast to control individuals, in which the radiotracer injection was performed in a dark room.
SPM detected more distant areas of hypoperfusion in relation to visual analysis. he inding of bilateral frontal lobe hypoperfusion was similar to the study of Van Paess-chen et al.7, and may be explained by a deviation of low to
the temporal lobe23, absence of cognitive processes during
seizure24 and ictal inhibition in regions near the focus25.
Areas of hypoperfusion have to be interpreted with caution since there is strong evidence from EEG and SPECT indings that there is an increase in neural activity and global perfusion during the early phase of seizure. In the present analysis the global perfusion was normalized to minimize the variables in the administered and absorbed doses, and therefore, hypoperfusion could be relative to other regions with extremely high levels of perfusion. An interesting inding in the SPM(ictal) was the ten-dency to ind more areas of hyperperfusion as the time between radiotracer injection and the beginning of the seizure increased. he more regions of hyperperfusion could be explained by global neuronal activation due to seizure generalization. In contrast, there was a tendency to observe more areas of hypoperfusion as the time be-tween radiotracer injection and the beginning of the sei-zure decreased. he more regions of hypoperfusion could be explained by a global neuronal deactivation as a defense mechanism to avoid seizure generalization. Studies with more patients are necessary to conirm these indings.
detect-ed diferent regions of hypo and hyperperfusion and is therefore a helpful tool for the better understanding the pathophysiology of seizures in MTLE.
REFERENCES
1. Rowe CC, Berkovic SF, Sia STB, et al. Localization of epileptic foci with pos-tictal single photon emission computed tomography. Ann Neurol 1989;26: 660-668.
2. Engle JrJ. Epileptic syndromes. In: Engel Jr J (Ed). Seizures and epilepsy. Phil-adelphia: FA Davis Company, 1989:195-201.
3. Babb TL, Brown WJ, Pretorius J, Davenport C, Lieb JP, Crandall PH. Temporal lobe volumetric cell densities in temporal lobe epilepsy. Epilepsia 1984;25: 729-740.
4. Engle Jr J. Outcome with respect to epileptic seizures. In: Engel Jr J (Ed). Sur-gical treatment of the epilepsies. New York: Raven Press, 1987:553-571. 5. Devous MD, Thisted RA, Morgan GF, Leroy RF, Rowe CC. SPECT brain
imag-ing in epilepsy: a meta-analysis. J Nucl Med 1998;39:285-293.
6. Lee JD, Kim HJ, Lee BI, Kim OJ, Jeon TJ, Kim MJ. Evaluation of ictal brain SPET using statistical parametric mapping in temporal lobe epilepsy. Eur J Nucl Med 2000;27:1658-1665.
7. Van Paesschen W, Dupont P, Driel GV, Billoen HV, Maes A. SPECT perfusion changes during complex parcial seizures in patients with hippocampal scle-rosis. Brain 2003;126:1103-1111.
8. Blumenfeld H, McNally KA, Vanderhill SD, et al. Positive and negative network correlations in temporal lobe epilepsy. Cerebral Cortex 2004;14:892-902. 9. Lee JJ, Kang WJ, Lee DS, et al. Diagnostic performance of 18F-FDG PET and
ictal 99mTc-HMPAO SPET in pediatric temporal lobe epilepsy: Quantitative
analysis by statistical parametric mapping, statistical probabilistic anatomi-cal map, and subtraction ictal SPET. Seizure 2005;14:213-220.
10. Lee DS, Lee JS, Kang KW, et al. Disparity of perfusion and glucose metabo-lism of epileptogenic zones in temporal lobe epilepsy demonstrated by SPM/ SPAM analysis on 15O water PET, [18F]FDG-PET, and [99mTc]-HMPAO SPECT.
Ep-ilepsia 2001;42:1515-1522.
11. Chang DJ, Zubal IG, Gottschalk C, et al. Comparison of statistical parametric mapping and SPECT diference imaging in patients with temporal lobe ep-ilepsy. Epilepsia 2002;43:68-74.
12. Tae WS, Joo EY, Kim JH, et al. Cerebral perfusion changes in mesial temporal lobe epilepsy: SPM analysis of ictal and interictal SPECT. Neuroimage 2005; 24:101-110.
13. McNally KA, Paige AL, Varghese G, et al. Localizing value of ictal-interictal SPECT analyzed by SPM ISAS. Epilepsia 2005;46:1450-1464.
14. Bruggemann JM, Som SS, Lawson JA, Haidl W, Cuningham AM, Bye AME. Ap-plication of statistical parametric mapping to SPET in the assessment of in-tractable childhood epilepsy. Eur J Nucl Med Mol Imaging 2004;319:369-377. 15. Engel Jr J, Ness PCV, Rasmussen T, Ojeman LM. Outcome with respect to ep-ileptic seizures. In: Engel Jr J (Ed). Surgical treatment of the epilepsies. New York: Raven Press, 1993:609-621.
16. Amorim BJ, Etchebehere ECSC, Camargo EC, et al. Statistical voxel-wise analy-sis of ictal SPECT reveals pattern of abnormal perfusion in patients with tem-poral lobe epilepsy. Arq Neuropsiquiatr 2005;63:977-983.
17. Yang CR, Mongenson GJ. An electrophysiological study of the neural projec-tion from the hippocampus to the ventral pallidum and the subpallidal ar-eas by way of the nucleus accubens. Neuroscience 1985;15:1015-1024. 18. Dupond S, Semah F, Baulac M, Samson Y. The underlying pathophysiology
of ictal dystonia in temporal lobe epilepsy. Neurology 1998;51:1289-1292. 19. Won JH, Lee JD, Chung TS, Park CY, Lee BI. Increased contralateral
cerebel-lar uptake of technetium-99m-HMPAO on ictal brain SPECT. J Nucl Med 1996;37:426-429.
20. Bohnen NI, O’Brien TJ, Mullan BP, So EL. Cerebellar changes in partial seizures: clinical correlations of quantitative SPECT and MRI analysis. Epilepsia 1998; 39:640-650.
21. Shin WC, Hong SB, Tae WS, Seo DW, Kim SE. Ictal hyperperfusion of cerebel-lum and basal ganglia in temporal lobe epilepsy: SPECT subtraction with MRI coregistration. J Nucl Med 2001;42:853-858.
22. Marks DA, Katz A, Hofer P, Spencer SS. Localization of extratemporal epileptic foci during ictal single photon emission computed tomography. Ann Neurol 1992;31:250-255.
23. Rabinowicz AL, Salas E, Beserra F, Leiguarda RC, Vazquez SE. Changes in re-gional cerebral blood low beyond the temporal lobe in unilateral temporal lobe epilepsy. Epilepsia 1997;38:1011-1014.
24. Fuster JM. The prefrontal cortex – an update: time is of the essence. Neuron 2001;30:319-333.