Nutritional assessment of children of the Jequitinhonha Valley region
in Brazil with NCHS and the new WHO growth charts
Avaliação nutricional de crianças do Vale do Alto Jequitinhonha com a utilização das novas curvas de crescimento do NCHS e da OMS
Francisco José F. Silveira1, Joel Alves Lamounier2
ABStrACt
Objective: To compare the nutritional assessment of chil-dren of low socio-economic status in a poor region of Minas Gerais, Brazil, using NCHS and World Health Organization (WHO) growth reference standards.
Methods: Cross-sectional study performed in three cities of the Alto Jequitinhonha Valley, Minas Gerais, Brazil. Data were collected during July, 2000. Comparative analysis was made between NCHS and the new WHO growth charts by Epi-Info 6.04b, Excel and Anthro 2005 programs.
Results: A total of 450 children were assessed in the study. The socioeconomic status of the children was low and 85.3% of their family earned less than half of the minimum wage per capita. Using respectively WHO and NCHS growth charts, weight/height deiciency was de-tected in 4.2 and 2.2% in children up to ive months and 2.3 and 3.2% in those with 12 months or more; height/ age deiciency was noted in 18.8 and 7.5% of the children up to ive months and 2.8 and 7.4% in those with 12 months or more; overweight was shown in 12.5 and 8.6% up to ive months of age, 7.4 and 5.1% in children with 12 months or more.
Conclusions: Differences in the detection of nutritional deicits were found. The WHO growth chart is more updated and the data was collected from children in good environ-ment conditions and healthy feeding habits, favoring their normal growth. The WHO chart may be considered more adequate to assess children growth.
Key-words: nutritional assessment; reference standards; World Health Organization.
reSumO
Objetivo: Analisar comparativamente a avaliação nutri-cional de crianças em uma região carente do estado de Minas Gerais, utilizando curva de crescimento padrão de referência do NCHS e da Organização Mundial da Saúde (OMS).
Métodos: Estudo transversal realizado em três municípios da região do Alto Jequitinhonha, Minas Gerais. Foram in-cluídas as crianças com até 24 meses de idade, residentes nas áreas rurais e urbanas. A coleta de dados foi feita em julho de 2000. Análises comparativas foram feitas utilizando-se as curvas de crescimento do NCHS e da OMS com os programas Epi-Info 6.04b, Excel e Anthro 2005.
Resultados: Foram analisados dados de 450 crianças. A po-pulação era predominantemente de baixo nível socioeconômico, sendo 85,3% com renda per capita inferior a meio salário mínimo. Utilizando-se respectivamente as curvas da OMS e do NCHS, o déicit peso/altura foi detectado em 4,2 e 2,2% em crianças com até cinco meses e 2,3 e 3,2% com 12 ou mais meses; o déicit altura/idade em 18,8 e 7,5% com até cinco meses e 2,8 e 7,4% com 12 meses ou mais; o sobrepeso em 12,5 e 8,6% com até cinco meses e 7,4 e 5,1% com 12 meses ou mais.
Conclusões: Foram encontradas diferenças na detecção de deiciências nutricionais. As curvas da OMS são mais atuali-zadas e foram elaboradas a partir de uma amostra composta de crianças vivendo em boas condições ambientais e de hábitos alimentares saudáveis, o que possibilitou seu crescimento adequado, podendo ser consideradas mais apropriadas para o acompanhamento do crescimento.
Palavras-chave: avaliação nutricional; padrões de refe-rência; Organização Mundial da Saúde.
Instituição: Faculdade de Ciências Médicas de Minas Gerais e Universidade Federal de Minas Gerais (UFMG), Belo Horizonte, MG, Brasil
1Doutor em Pediatria. Professor assistente da Faculdade de Ciências
Médi-cas de Minas Gerais (FCMMG), Belo Horizonte, MG, Brasil
2Doutor em Pediatria. Professor Titular do Departamento de Pediatria da
Faculdade de Medicina da UFMG, Belo Horizonte, MG, Brasil
Endereço para correspondência: Francisco José Ferreira da Silveira
Rua Galba Veloso, 304, apto 404 – Santa Tereza CEP 31015-080 – Belo Horizonte/MG
Introduction
Standard growth charts illustrate the growth of normal children and constitute a valuable instrument for assessing the health status of child populations, especially when em-ployed correctly by health professionals. Growth charts are designed based on studies with individuals considered to be normal, supposedly living in environmental conditions that are favorable to the fulillment of their potential for growth and development. The charts that are best known and most widely employed in Brazil are the growth curves derived from American children and published by the National Center for Health Statistics (NCHS)(1), formerly recommended by the World Health Organization (WHO), and also charts plotted by Marcondes et al., based on data obtained with children from Santo André, Brazil(2). More recently, charts were pub-lished by the Centers for Disease Control and Prevention (CDC)(3), using growth data from American children (CDC, 2000) and based on more recent survey data when compared to the NCHS standards. Data were collected from 1963 to 1994 in the United States, and the new growth standards were published in May 2000, introducing certain innova-tions, such as the inclusion of body mass index and samples from several different ethnic groups. Nevertheless, the CDC charts still did not correctly illustrate the growth of breastfed children, particularly those on exclusive breastfeeding, since the infants included in the sample were on combined feeding with formula and breastmilk.
In April 2006, the WHO published new growth curves for children up to ive years of age, based on a population study carried out between 1997 and 2003 in ive countries: Brazil, Ghana, India, Oman, and the United States. The research proj-ect was entitled the “Multicenter Growth Reference Study” (MGRS), and it only enrolled children who were breastfed and whose feeding habits were in line with the nutritional standards currently considered satisfactory, particularly with relation to breastfeeding, and who were living in environmen-tal conditions favorable to normal growth(4). Therefore, the resulting curves illustrate the growth patterns of children with good nutrition and living in good environmental conditions, and are an international reference since they were based on data collected in more than one country.
Growth charts are important for assessing the nutritional status of children, in addition to being useful for detecting childhood health problems. The WHO considers these new charts to be an improvement on those used previously and recommends their use in Brazil and in other countries.
The applicability of the new charts has been demonstrated in a study involving ive different countries with varying socioeconomic conditions(5). However, few studies have been undertaken with the aim of evaluating the new charts and the results they provide in comparison with the NCHS curves. The objective of this study was therefore to comparatively analyze results obtained with the WHO and NCHS charts while assessing the nutritional status of children up to 24 months old in a region with a low socioeconomic status in the Brazilian state of Minas Gerais.
methods
The present cross-sectional study was carried out in the municipalities of Carbonita, São Gonçalo do Rio Preto, and Datas, all in the Alto Jequitinhonha region in the state of Minas Gerais, Brazil. The primary objective of the study was to evaluate the breastfeeding duration and nutritional status of children living in these three areas. All three municipali-ties are members of the Alto Jequitinhonha Intermunicipal Health Partnership (Consórcio Intermunicipal de Saúde do Alto Jequitinhonha, CISAJE), are under the responsibility of the Diamantina Regional Health Directorate (Diretoria Regional de Saúde de Diamantina), and are located 30, 50 and 120 kilo-meters, respectively, from Diamantina. These municipalities were selected for the study because they have total coverage from the Family Health Program (Programa de Saúde da Família, PSF) and because they are afiliated with the Rural Residency Program run by Faculdade de Ciências Médicas de Minas Gerais (FCMMG), which facilitated implementation of the study. Carbonita, São Gonçalo do Rio Preto and Datas have a population of 11,000, 3,000 and 5,100 inhabitants, respectively. The purchasing power of the population is low in all three municipalities, and the main economic activities are extraction of timber and charcoal production in Carbo-nita, and farming in São Gonçalo do Rio Preto and Datas.
This study included data from all children up to 24 months old living in the three municipalities. Data collec-tion was carried out in July 2000, during interviews with the children’s mothers or guardians, by medical students from
The questionnaire employed consisted of closed questions designed to elicit the following variables: identiication, date of birth, date of interview, breastfeeding, age at breastfeeding cessation, socioeconomic data, weight and length/height of the child. The children were weighed on pediatric balances accurate to 10 g, and measured in the horizontal position using anthropometric rules.
In urban areas, data collection was carried out at a health center or at the children’s home whenever their mothers did not attend. In the rural areas, in view of the wide dispersal of residences, interviews were conducted at locations previ-ously chosen on the basis of the facilities available in each area (health centers, schools, community centers). Mothers and children were recruited at home with the aid of com-munity health workers.
Data were analyzed on a microcomputer using Epi-Info version 6.04b, Excel, and Anthro 2005 (WHO). Malnutrition was classiied in accordance with WHO recommendations, deining children as malnourished if their Z scores were below -2 and severely malnourished if their Z scores were below -3 Z for all indicators. The indicators analyzed were weight/age, height/age and weight/height. Children were deined as over-weight if their over-weight/height Z score was greater than +2.
Results were plotted as graphs considering three age groups (up to ive months, six to 11 months, 12 to 24 months), in line with the NCHS and WHO standards, for the detection of malnutrition and obesity. Comparisons were also made between the means obtained with both growth charts for seven age groups (up to three months, four to seven months, eight to 11 months, 12 to 15 months, 16 to 19 months, 20 to 23 months, 24 months).
The research protocol was approved by the Pediatrics Department and Research Ethics Committee at Universidade Federal de Minas Gerais.
results
A total of 450 children with up to 24 months of age were analyzed, 234 (52.0%) males and 216 (48.0%) fe-males. Their ages were as follows: 21.8% were less than six months old, 25.1% were six to 11 months old, 24.4% were 12-17 months old, and 28.7% were aged 18 to 24 months. The population was predominantly low-income; 85.3% of the children’s families had a per capita income of less than half the minimum monthly wage. Their dietary habits were unhealthy, with a low median duration of exclusive breastfeeding (1.5 month), although median breastfeeding duration was 10.9 months.
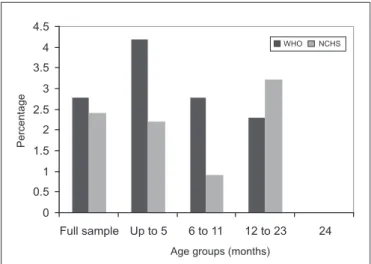
The comparison between NCHS and WHO charts in terms of the detection of malnourished children revealed that the WHO chart classiied 4.2% of the children up to 5 months old as having weight/height deicit, while the result obtained with the NCHS curve was 2.2%; at six to 11 months, these igures were 2.8 and 0.9%, respectively; and at 12 months or more, 2.3 and 3.2% (Figure 1). Height/age deicit was detected by WHO and NCHS curves, respectively, in 18.8 and 7.5% of the children aged up to ive months, in 17.9 and 14.0% of those aged six to 11 months, and in 14.8 and 11.1% of the children aged 12 months or more (Figure 2); weight/ age deicit was detected in 9.4 and 8.6% of the children up to ive months old, in 7.5 and 8.4% of those aged six
0 2 4 6 8 10 12 14 16 18 20
Full sample Up to 5 6 to 11 12 to 23 24
Age groups (months)
Percentage
WHO NCHS
Figure 2 – Comparison of height/age deicits according to WHO
and NCHS growth charts.
0 0.5 1 1.5 2 2.5 3 3.5 4 4.5
Full sample Up to 5 6 to 11 12 to 23 24
Age groups (months)
P
e
rc
e
nt
a
ge
WHO NCHS
Figure 1 – Comparison of weight/height deicits according to
to 11 months, and in 2.8 and 7.4% of those 12 months or older (Figure 3). Respectively, the WHO and NCHS charts classiied as overweight 12.5 and 8.6% of the chil-dren aged up to ive months, 7.5 and 6.5% of the chilchil-dren aged six to 11 months, and 7.4 and 5.1% of those aged 12 months or more (Figure 4).
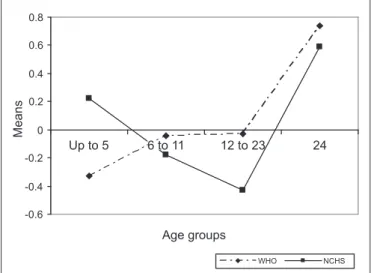
With relation to mean weight/age Z scores, those calculated according to the WHO standard were found to be lower during the irst months, with an intersec-tion between seven and eight months; from that age on, the Z scores calculated according to NCHS were lower (Figure 5). Height/age Z scores calculated according to the WHO standard were lower during the irst months, became equal to NCHS scores between seven and eight months, and then became lower again from 16 months on (Figure 6).
Discussion
The NCHS growth charts have been used for some decades in countries all over the world and their use has been recom-mended by the WHO. On the other hand, these charts have also been the subject of much debate, and their deiciencies have been analyzed in several different publications(6-9). The NCHS growth charts were irst recommended for use in the United States in 1977. Later, they were also recommended for international use by the WHO, and were adopted by the Bra-zilian Ministry of Health. Considered to be the gold standard, these charts were accepted as the most adequate instruments to fulill the aim of assessing growth and nutritional status of children in different populations. The NCHS charts were rec-ommended on the basis of evidence that children’s growth is primarily inluenced by factors such as nutrition, environment
0 2 4 6 8 10 12 14
WHO NCHS
Full sample Up to 5 6 to 11 12 to 23 24
Age groups (months)
Percentage
Figure 4 – Comparison of overweight results according to WHO
and NCHS growth charts.
0 1 2 3 4 5 6 7 8 9 10
WHO NCHS
Full sample Up to 5 6 to 11 12 to 23 24
Age groups (months)
Percentage
Figure 3 – Comparison of weight/age deicits according to WHO
and NCHS growth charts.
-1 -0.8 -0.6 -0.4 -0.2 0 0.2 0.4 0.6 0.8
Up to 5 6 to 11 12 to 23 24
Age groups
Means
WHO NCHS
Figure 6 – Comparison of mean height/age results according
to WHO and NCHS growth charts. -0.6
-0.4 -0.2 0 0.2 0.4 0.6 0.8
Up to 5 12 to 23 24
Age groups
Means
WHO NCHS
6 to 11
Figure 5 – Comparison of mean weight/age results according
and the socioeconomic conditions of their families, which, if adequate, would result in anthropometric data that follow a similar pattern of development. Racial differences, therefore, were thought to have a lesser inluence(10), reducing probable ethnic interferences with the assessments, even taking into consideration the fact that only American children had been analyzed for the development of these curves.
Nevertheless, certain questions have been raised by many authors with relation to the methodology employed to design the NCHS curves and consequently to their use as an ideal standard. Worthy of note among the questions raised was the fact that the populations studied for these charts were predominantly composed of children who had not been breastfed. Using children with dietary habits that are con-sidered healthier was in itself suficient justiication for the development of new growth standards. Furthermore, data for children less than three years old on the NCHS curves originated from surveys carried out between 1921 and 1975, and are no longer considered representative of the current child population(4-6).
Therefore, the WHO developed a new reference standard based on breastfed children who had enjoyed environmental conditions favorable to their development. From this perspec-tive, the new curves represent an improvement, since they illus-trate the growth of children who are realizing their potential in the best manner possible. These curves can thus be considered to be not only descriptive, but also prescriptive, since they illustrate the way in which children “should grow,” and not just how they actually do grow in a speciic place at a speciic time(11). Published in 2006, the WHO growth charts can be accessed at www.who.int/childgrowth/en. The document is extensive, including a great deal of information, graphs and tables that can be employed in clinical practice(12).
The NCHS charts were developed based on data from children studied without the same inclusion and exclusion criteria deined for the WHO charts, and with children who had not been breastfed. Therefore, signiicant differences between the two reference charts were expected. In this study with children from the Alto Jequitinhonha region, differences were observed in all of the indicators analyzed. The WHO charts offered greater sensitivity for the detection of weight/height deicits (wasting), except in older children, and the same was true of height/age deicits (stunting), with higher prevalence rates associated with the WHO charts. The prevalence of weight/age deicits (underweight) according to the WHO charts was higher only in children less than six months of age; thereafter, the prevalence rate according
to the NCHS charts was greater. The WHO charts also de-tected more overweight in all age groups. These results are comparable with previously reported indings(13).
Comparing mean Z scores calculated according to the two standards, weight scores resulted greater using the NCHS charts up to approximately six months of age, with the reverse being true thereafter. The low duration of exclusive breastfeeding found in the study population may have af-fected this result, namely, median exclusive breastfeeding and median breastfeeding durations of 1.5 months and 10.9 months, respectively(14,15). Furthermore, children with adequate dietary habits should grow healthy, without be-coming overweight or accumulating fatty tissues; the fact that WHO charts detect more overweight may therefore explain the higher mean Z scores obtained for weight. Mean height Z scores were higher using the NCHS charts during the irst months and again after 12 months. These indings also demonstrate that the children studied for the WHO curves had better growth, and the WHO charts offer greater sensitivity for the detection of growth deiciencies.
It is important to point out that the children assessed in the present study originate from families with a low socio-economic status and live in a poor region of the state. The increased detection of nutritional deiciencies, particularly chronic deiciencies, may be evidence that the new charts are more appropriate since they relect the poor living conditions of this population.
The new WHO growth charts have been tested in another study(2), which investigated children from countries with various socioeconomic conditions. More nutritional deicien-cies were detected in Pakistan, while in Italy and Argentina the prevalence rates were lower. Furthermore, an adequate association was observed between clinical diagnosis and anthropometric assessment using the new charts.
1. Hamill PV, Drizd TA, Johnson CL, Reed RB, Roche AF. NCHS growth curves for children birth-18 years: United States. Vital Health Stat 1977;165:1-74. 2. Marcondes E, Berquó ES, Luongo J, Yunes J, Martins JS, Zacchi MA et al.
Estudo antropométrico de crianças brasileiras de zero a doze anos de idade. São Paulo: Anais Nestlé; 1969.
3. Kuczmarski RJ, Ogden CL, Guo SS, Grummer-Strawn LM, Flegal KM, Mei Z et al. 2000 CDC growth charts for the United States: methods and development. Vital Health Stat 2002;246:1-190.
4. Araújo CL, Albernaz E, Tomasi E, Victora CG. Implementation of the WHO Mul-ticentre Growth Reference Study in Brazil. Food Nutr Bul 2004;25:S53-8. 5. Onyango AW, Onis M, Caroli M, Shah U, Sguassero Y, Redondo N et al.
Field-testing the WHO child growth standards in four countries. J Nutr 2007;137: 149-52.
6. Dibley MJ, Staehling N, Nieburg P, Trowbridge FL. Interpretation of Z-score anthropometric indicators derived from the international growth reference. Am J Clin Nutr 1987;46:749-62.
7. No authors listed. An evaluation of infant growth: the use and interpretation of anthropometry in infants. WHO Working Group on Infant Growth. Bul World Health Organ 1995;73:165-74.
8. Roberts SB, Dallal GE. The new childhood growth charts. Nutr Rev 2001;59:31-6.
9. Soares NT. A new growth anthropometric reference: meanings and implications. Rev Nutr 2003;16:93-104.
10. Onis M, Habicht JP. Anthropometric reference data for international use: recommendations from a World Health Organization Expert Committee. Am J Clin Nutr 1996;64:650-8.
11. Onis M, Victora CG. Growth charts for breastfed babies. J Pediatr (Rio J) 2004;80:85-7.
12. Organização Mundial da Saúde. The WHO child growth standards. [cited 2009 Apr 16]. Disponível em: http://www.who.int/childgrowth/en.
13. Onis M, Onyango AW, Borghi E, Garza C, Yang H, WHO Multicentre Growth Reference Study Group. Comparison of the World Health Organization (WHO) child growth standards and the National Center for Health Statistics/WHO international growth reference: implications for child health programmes. Public Health Nutr 2006;9:942-7.
14. Silveira FJ, Lamounier JA. Breastfeeding prevalence and complementary feeding practices in children up to 24 months old in Alto Jequitinhonha region, Minas Gerais, Brazil. Rev Nutr 2004;17:437-47.
15. Silveira FJ, Lamounier JA. Factors associated with breastfeeding duration in three cities in the region of Alto Jequitinhonha, Minas Gerais, Brazil. Cad Saude Publica 2006;22:69-77.