Impact of large scale PV deployment in the sizing of urban distribution
transformers
Sara Freitas
a,*, Teresa Santos
b, Miguel C. Brito
a aInstituto Dom Luiz, Faculdade de Ci^encias, Universidade de Lisboa, 1749-016 Lisboa, PortugalbInterdisciplinary Centre of Social Sciences (CICS.NOVA), Faculty of Social Sciences and Humanities, (FCSH/NOVA), Universidade Nova de Lisboa, 1069-061 Lisboa, Portugal
a r t i c l e
i n f o
Article history:
Received 22 July 2017 Received in revised form 19 September 2017 Accepted 26 October 2017 Available online 1 November 2017
Keywords:
Demand aggregation Building façades Urban BIPV
Distribution transformers
a b s t r a c t
With the increasing deployment of solar systems in buildings in urban environments, a future scenario of high photovoltaic penetration is expected to produce impacts on the distribution grid. One of the challenges relates to the power balance at the power transformers, which might not have sufficient spare capacity to accommodate the solar electricity feed in. In this work, we estimate the power balance at the transformers in a small urban area of Lisbon, Portugal, considering full deployment of PV, installed on rooftops and building façades. The PV potential is estimated through two different approaches: the simplifiedPeak power method, which considers the typical peak power of a module and the available area, and the more labour-intensiveIrradiance methodthat accounts for hourly time step solar irradiance and demand data or simulations.
The mainfindings of this work point out that thePeak power methodhas limited success if PV facades are to be considered. Moreover, a high PV penetration scenario leads to a locally less resilient grid, hence a solar PV factor was proposed to account for future deployment of PV systems in urban environments. ©2017 The Authors. Published by Elsevier Ltd. This is an open access article under the CC BY-NC-ND license (http://creativecommons.org/licenses/by-nc-nd/4.0/).
1. Introduction
It is acknowledged that solar photovoltaics (PV) is one of the key players in future's energy matrix of most countries in the world, due to the abundant resource and the sustained drop in the prices of this technology. Also, the PV market has been offering more solutions for aesthetical integration of PV in the building envelope, which make PV more popular and appealing to residents in urban environments. Fortunately, PV installations in the urban landscape are becoming more common as citizens, architects and promoters realise the many advantages of this technology, as well as self-consumption regulations that contemplate more favourable con-ditions for the consumer-prosumer status.
The increase in popularity of building integrated photovoltaics (BIPV) raises concerns on the impacts on the electricity supply grid at different times of the day. Thus, it becomes relevant to assess the possible outcomes of high PV deployment, including voltage rise andfluctuations, powerfluctuations and reverseflow, power factor changes, frequency regulation and harmonics, unintentional islanding, fault currents and grounding issues, etc [1]. These
impacts are thoroughly described in Ref.[2], including a compre-hensive discussion on mitigation approaches and barriers. One of the challenges resides in the fact that the transformer power ca-pacity must be large enough to accommodate all the surplus elec-tricity from PV systems that is being fed into it, which might not be the case for all the transformers.
A power distribution transformer (PT) is expected to have an operational lifespan of 30 years[3] [4], thus the standard sizing practice contemplates the installation of oversized equipment to ensure a lower load level on the transformer until additional ca-pacity is required to allow for future demand growth. This trans-lates into (1).
PPT ¼Cdiversity XN
i
PcontractFsafetyþPover; (1)
where PPT stands for the transformer power capacity,Pcontract is customeri’s contracted power,Nis the expected number of cus-tomers,Fsafety is a safety margin of 1.5 to account for the power factor and for future load growth,Poveris the oversized power
ca-pacity defined by the standard size of the transformer that is available for commissioning and Cdiversity is a diversity (or
*Corresponding author.
Contents lists available atScienceDirect
Renewable Energy
j o u r n a l h o m e p a g e :w w w . e l s e v i e r . c o m / l o c a t e / r e n e n e
https://doi.org/10.1016/j.renene.2017.10.096
Cdiversity¼0:5þ ffiffiffiffi N
p for commercial customers; (3)
In a distribution grid the standard practice [5]is to size trans-formers without consideration for future PV electricity production
[2]. Given that the installation of PV systems in buildings in urban environments is growing, present and future local distribution grid ought to consider PV generated electricity input in a scenario of high penetration[6].
A literature review of PV impact studies on the power quality of distribution networks is presented in Ref. [7], along with the simulation of the potential impact of distributed rooftop PV gen-eration on a low-voltage network in New Zealand, using Geographical Information Systems (GIS). It was found that the hosting limit for PV on urban networks is around 45%, although in most cases the overvoltage would not be much higher than the statutory limit. In Ref.[8], network details from the city of Cor-rientes, Argentina, are used to simulate the optimum conditions for the connection of PV systems to the grid. The temporal distribution of voltages in each node of the power network, distribution of currents in power lines, the energy supplied to each user, etc., shown that both penetration levels of PV in the power network and interconnection points must be evaluated to avoid detriment in the quality of service of energy supply. A similar study was carried on in Ref.[9]for the low-voltage network in the region of Queensland, Australia, concluding that the range of maximum rooftop PV hosting capacity per customer is between 1.6 and 5 kV AA. Another research considered the urban distribution network of Maribor, Slovenia, to experimentally analyse the power quality of PV systems connected to it[10]. In this case, including distributed generation operating with low power output could compromise voltage quality, violating harmonic distortion requirements. Maximum PV penetration levels to avoid power quality control issues vary amongst literature, as reviewed in Ref.[11].
Nonetheless, the potential of distributed generation might represent a means of supplementing network capacity, therefore postponement of substantial investment on expansions or up-grades of the distribution systems, such as acquiring new power transformers [12]. However, as high PV penetration affects the operations of distribution networks that they are connected to, network reinforcements are still required and ought to be done in a cost-effective manner. In Ref. [13], an heuristic optimization method is proposed to maximize power supply reliability and quality whilst minimizing line losses and investment cost. The combination of control variables, such as line switch and feeder reconfiguration, line upgrading, construction of a feeder and/or a transformer substation, encompass the optimal long-term invest-ment strategy and network arrangeinvest-ments in the planning period
[4]. focused on how grid connected PV would affect utility trans-formers' lifespan. The authors confirm that the maximum PV penetration level depends on the load curve and the irradiation levels on site, with high irradiation sites showing a smaller hosting capability due to transformer overload, but a potential above 60% for losses reduction at the transformer. Load profiles of commercial buildings might prevent excessive aging of the transformers, whereas residential load profiles are innocuous. It is also high-lighted that deferring equipment replacement may occur, although proper tuning between generation and demand is crucial, other-wise large-scale PV penetration might be harmful to the system's
a significant impact on the total cost of the network by using load and generation flexibility will be realized when the network infrastructure is mainly dimensioned by the peak.
None of the previous studies, however, provides a method for the distribution network operators to straightforwardly account for the PV potential in the long-term transformer sizing of a new built area. Hence, in this study, the power gapPGAP was estimated to indicate if there is enough spare capacity for accommodating all the PV generation or if the transformer should be upgraded at some point in the future. Since part of the building's energy demand will be supplied by PV, the power gap may be defined by:
PGAPðtÞ ¼PPT ðPVðtÞ PdemandðtÞÞ; (4) where andPVis the generated PV electricity andPdemandis the local power demand. Consequently, a positive gap means that PV may be accommodated without any upgrades to the grid, whilst a negative gap indicates that the local grid would require upgrade if all this PV was to be installed and connected to the grid. Considering the factorsFsafetyandPover, the transformers' capacity is expected to be
highly oversized by default, hence no power losses were considered in the balance. Moreover, no special focus on the network details or voltage issues is given in this study.
The main goal of this work is to understand the power balance on urban distribution transformers and the changes in power ca-pacities that may be needed if the total PV potential of the buildings in a suburb is considered. Two different approaches for PV potential estimation are compared: one requires less data but might be less accurate, while the other is more computationally intensive as it performs hourly calculations and considers shading. Moreover, special emphasis is given to the consequences of including building façades in the deployable PV potential, instead of rooftop PV sys-tems only. AFpvfactor to account for PV generation in the sizing of
urban distribution transformers is proposed, which, to the authors' knowledge, has not yet been documented in the literature.
2. Methodology
This sectionfirstly describes the case-study urban area (2.1)
where the methodology was employed and the data that was used. Then, the two approaches for solar PV potential estimation are described in detail(2.2)- thePeak power method(2.2.1)and the Irradiance method (2.2.2) - and the local electricity demand is characterised(2.3).
2.1. Case-study
This study considers the area of Alvalade in the city of Lisbon (Portugal, 38.71N 9.14W). The data available includes the power
capacity of all transformers as well as georeferenced polygons representing the building footprints (Fig. 1A) including information on the heights and number offloors of the respective buildings.
points) using the points that correspond to the location of the transformers (red dots inFig. 1 B). Then, the building polygons whose centroids (i.e. the arithmetic mean position of all the points in each polygon) fall inside an influence zone are assigned to the respective transformer. Using the centroids of the building poly-gons assures that each one has only one connection and, therefore, belong to one single influence zone.
2.2. Solar PV potential
Two distinct methodologies were employed for the assessment of the solar potential. One is straightforward and considers the available area and the PV module peak power(2.2.1), while the second computes hourly solar radiation considering mutual shading and typical meteorological conditions(2.2.2). It is impor-tant to highlight that two scenarios for the PV potential will be evaluated: a rooftop only scenario and a rooftop plus façades sce-nario, to incorporate the value of off peak electricity generation from façades discussed in Ref.[15].
2.2.1. Peak power method
In this approach, it is assumed that at each hour the maximum PV generation equals the maximum installed peak power, i.e. it disregards thefluctuation of irradiance during the day, the tilt and orientation of building surfaces, and different contributions from the direct and diffuse components of solar radiation. Therefore, the hourly PV generation calculated through this method is constant throughout the hours and the year, depending solely on the avail-able area on rooftops and façades. It is expected to overestimate the PV potential since no mutual shading is taken into account.
Assuming typical 1 m2 c-Si panels withPp¼150 W/m2 peak power, the PV generation potential for each influence zonezat time tmay be determined by using Eq.(5):
PV1;zðtÞ ¼PpPRAbuild; (5)
wherePRis a performance ratio (0.85) to account for temperature effects andAbuildis the available area on all building surfaces [m2] contained in the respective transformer influence zone.
A
B
C
commodating all potential PV electricity generation in the case study, one needs to know when the PV production is expected to peak. As the peak of production depends on azimuth and slope of the building surfaces, different transformers will feature peak electricity injection at different times of the day. The existence of large façade areas ought to further peak production shifting.
A more detailed method had to be followed in this case. The Irradiance methodconsists on an hourly time step solar irradiance simulation, which allows for the detection of the moment of highest injection of PV generated electricity into the grid. The estimation of hourly solar irradiance in façades followed an approach that is more complex than the rooftops'.
2.2.2.1. Rooftops. The SolarAnalyst[16]extension for ArcGIS®, one of the most commonly used GIS software, was employed for the hourly solar irradiance simulations. As input, SolarAnalyst requires a digital surface model (DSM), site latitude, sky size and radiation parameters such as Transmissivity and Diffuse proportion. Based on these data, the model accounts for atmospheric effects, as well as site latitude and elevation, steepness (slope) and compass direction (aspect), daily and seasonal shifts of the sun angle, and effects of shadows cast by surrounding topography.
Using a 1 m2resolution LiDAR derived DSM of the area and the diffusion portion and transmissivity assessed for each month, the total amount of incoming solar radiation was calculated for each location of the DSM, following the approach reported in Ref.[17]. Then, using the building footprints, the total solar radiation in each rooftop was determined for each hour.
2.2.2.2. Façades. Since the SolarAnalyst extension is not yet capable of handling full-3D solar irradiance simulations, another tool had to be used to estimate the PV potential in façades. Following a parametric approach like in other studies on the solar irradiance in the built environment [18], the building footprints were imported into the CAD software Rhinoceros3D®
[19] and extruded to their respective heights (Fig.2) using the capabilities of the integrated graphical algorithm editor Grasshopper™. Then, employing the plug-in LadyBug[20](a widely known package of components used for energy simulation that rely on several Ener-gyPlus [21] validated models) the hourly solar irradiance in the vertical surfaces was computed[22]. explains the radiation model and simulation workflow behind the tool. This step had to be per-formed inside a loop that cycled through a total of 550 buildings and a nested loop for the hourly irradiance calculation, otherwise the software would crash due to the huge amount of building ge-ometries. The reader is referred to[23]for more about modelling the solar potential in the urban context.
For simplicity, four reference days were considered in the hourly simulations: the 21st of March, June, September and December. The irradiance results were input into Eq.(6)to estimate the PV po-tential, again assuming standard 1 m2panels with 15% efficiency.
PV2;zðtÞ ¼IhðtÞ
h
PR; (6)where PV2 means the PV generation potential [kW] for a trans-former influence zonez, at hourt,Ihis the total hourly solar irra-diance received by considered building surfaces in the influence area [kW],
h
is the efficiency of the panels (0.15) and PR is aclass C (contracted power below 13.8 kV A) for 2017 [24] and knowing that average yearly electricity consumption in the city of Lisbon is around 1300 kWh/year/person [25]. The profiles are estimated and published by the national transportation grid oper-ator every year for billing purposes, and are applied to customers who do not own a net metering device.
Pdemand;bðtÞ ¼Np;bPdemand;refðtÞ; (7)
wherePdemand;bðtÞis the electricity consumption [kW] in buildingb at hourt,Np
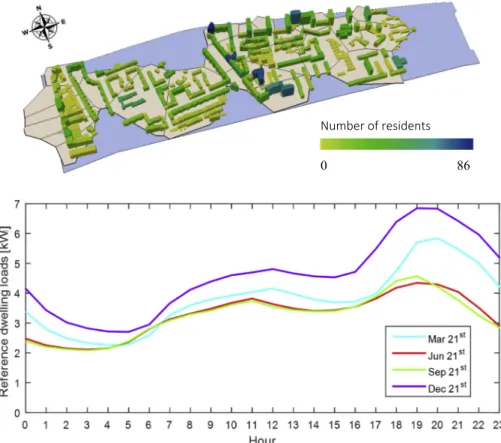
;bis the number of residents in buildingb(Fig.2, top) andPdemand;refðtÞis the value of the reference electricity demand at hourt[kW] (Fig.2, bottom).
The reference demand profiles are typical of residential build-ings: baseline consumption in the late-night time, rapid increase in the early morning, a slight peak around noon and a more pro-nounced ramp in the early evening. Although some of the buildings in the case-study area might be of mixed use, the overall aggre-gation of loads is expected to produce a profile that is closer to a residential profile. It can be observed that the loads are the highest in December (purple line), due to higher lighting and heating needs. The profiles for June and September are quite similar, probably due to the recent tendency for summer weather to extend into autumn months.
3. Results
In this section, the results from bothPeak power methodand Irradiance methodare compared for two distinct scenarios: one considers just the rooftop PV potential(3.1), whilst the other in-cludes façades(3.2).
According to theIrradiance method, the transformers will suffer the highest PV electricity injection at midday of June 21st in the rooftop only scenario and at 10am of September 21st in the rooftop plus façades scenario (Fig. 3, top). The addition of façades widens the period of electricity production and shifts the peak towards the morning period, except in December when this peak is shifted to-wards the afternoon. The PV potential is more than doubled when façades are included and greatly surpasses the electricity con-sumption during daytime, which is more difficult to achieve if PV is installed solely on the rooftops.
The overall transformers spare power is always positive for the four reference days in the rooftop only scenario, therefore the transformers are able to always accommodate the rooftop PV po-wer, although particular transformers might be faulty. However, the same is not true when façades are included, most significantly from 8am to 3pm in June and September, when, due to the vertical inclination and larger area, they produce more electricity.
3.1. Rooftops only
The maximum hourly PV potential determined by theIrradiance methodfor all rooftops reaches about 10 MW, which corresponds to 62% of the total transformer power capacity (16.1 MW).
Number of residents
0
86
Figs. 2.3D model of the buildings inside the transformer influence zones (after the extrusion of building footprints) and the number of residents per building (top) and the seasonal reference electricity load for single dwellings (bottom).
Roo
Ō
ops
Façades and roo
Ō
ops
of the neighbouring transformers suggests that the in-terconnections ought to be optimized so that the surrounding transformers could each one take part of the electricity feed in, which would represent a more affordable solution.
The relationship between results of the two methodologies is quite linear, with an overestimation of around 1% by theIrradiance methodand a bias of 96 kW. This means that for electricity balance purposes the computational effort required to perform an hourly solar irradiance analysis on rooftops can be avoided to a certain extent, as the PV potential on the variety of rooftop slopes and azimuths seems to dilute into the potential offlat and horizontal surfaces, as proposed in Ref.[26]. Thus, it can be argued that the Peak power methodconsidering the bias may be sufficiently accu-rate when only rooftop PV is considered.
The differences between the electricity balance obtained through both methodologies in terms of absolute difference can be easily grasped fromFig. 5A. Higher differences seem to be related to a larger number of sloped rooftops, which are considered by the Irradiance methodbut not by thePeak power method. The fact that no shading events can be reproduced by thePeak power method may also justify the lower differences. Moreover, larger influence zones tend to feature higher differences than smaller areas.
Fig. 5B shows how large these differences are when compared to the present nominal capacity of the transformer. It can be observed
3.2. Façades and rooftops
With the addition of building façade potential, the impact on the transformer grid changes dramatically. The maximum hourly PV potential determined by the Irradiance method now becomes 28 MW, which is twice the whole transformer power capacity. As for the Peak power method, the result became 73 MW, highly overwhelming the total grid capacity.
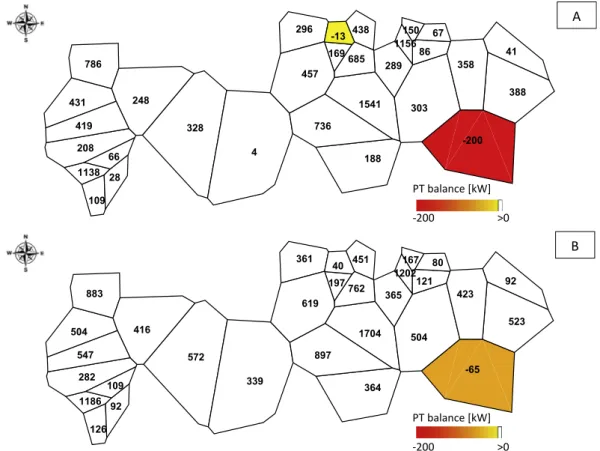
As expected, the transformers that feature the most significant failures when only the rooftops were considered (Section3.1) are the most affected by the addition of the electricity produced by PV façades (Fig. 6). There are however some zones that can still accommodate this production, where there are relatively fewer buildings with low energy consumption and/or smaller rooftops.
The dispersion of results between the two approaches is higher when the facades are taken into account. A linear regression with a lower correlation (R2
¼0.40) shows an average 70% overestimation of thePeak Power methodwith a more pronounced bias of 202 kWh, since the PV production by façades is highly overestimated by the simpler approach.
Fig. 7illustrates how superior the results from theIrradiance methodare in comparison to thePeak power methodand how this difference translates into the respective transformer power ca-pacity. When the PV production from façades is added into the
1541 1138 328 208 188 150 -200 109 296 431 438 303 41 4 86 67
786 685 289
28 248 169 -13 66 1156 736 388 419 457 358 1704 1186 572 282 364 167 -65 126 361 504 451 504 92 339 121 80
883 762 365
92 416 197 40 109 1202 897 523 547 619 423
A
PT balance [kW]
-200 >0
B
PT balance [kW]
-200 >0
transformer balance equation, an hourly calculation considering the surrounding building becomes relevant, since in the worst case such difference would represent 814% of the transformer capacity (zone coloured in red inFig. 7B).
Moreover, after the individual transformer balance analysis, the Irradiance methodpoints out that with the addition of façades the overall transformer grid has no spare capacity to accommodate such high electricity production, thus the upgrade of almost all the transformers would be essential, regardless of few changes in neighbor transformer interconnections.
4. Discussion
The analysis of the power balance of the electricity distribution grid considering a scenario of high PV penetration, both on rooftops and façades, shows that in most of the cases the grid is not resilient enough. The overall grid balance is mostly negative with the addition of façade PV potential, although a few the in-terconnections between buildings and transformers could be optimized instead of upgrading the power capacity of the existing transformers, which could represent up to 20 times the current capacity. Hence some of the PV generated electricity that would represent overproduction for one transformer could be fed into a neighbor transformer with spare power capacity. It must be high-lighted that the network of transformer connections is, in reality,
expected to follow the geometry of streets orientation and build-ings distribution, which is not grasped by the thiessen polygons assumed for the influence zones in this study. This simplification can be addressed in future studies if georeferenced data on the real grid network are available.
Although the influence zones that were assumed do not faith-fully portray the true network of transformer-buildings connec-tions, the observations regarding the contribution from the two methodologies explored are still valid. When the installation of PV system addresses only the rooftop surfaces it is legitimate to use thePeak power method (Subsection 2.2.1), thus saving time and computational resources. Nevertheless, the inclusion of building façade PV potential introduces dramatic changes that are not grasped by the simpler method, which requires an hourly analysis such as theIrradiance method(Subsection 2.2.2).
It is worth mentioning that the PV potential estimates from the Irradiance methodalso comprise some degree of uncertainty due to the lack of architectonic detail on the representation of the building surfaces. The spatial resolution of the DSM compromised a detailed analysis since it does not consider the presence of artefacts, such as roof overhangs, small chimneys, dormers, or antennas, and the number of buildings did not allow for the modelling of more ac-curate façade elements.
Results also highlight the importance of considering the po-tential deployment of photovoltaics in buildings when sizing local
A
B
Irradiance met. – Peak power met. [kW]
0
350
[%]
(Irradiance met. – Peak power met.)0
85
distribution grids. This could be achieved by introducing a new term to(1), the solar factorFpv, determined by the available surface
area on rooftops and façades:
PPT ¼abs Fpv Cdiversity XN
i
PcontractFsafety !
þPover (9)
The solar factor may be determined empirically as(10).
Fpv¼
0:38
PpPRAbuildþ140 G Gref
¼0:21Afootprintþ140
GG ref
(10)
wherePpis the typical square metre PV panel peak power (0.15 kW/ m2), PRis a performance ratio (0.85) to account for temperature effects,Afootprintis the total building footprints area at the location of interest,Gis the average annual global irradiance on the hori-zontal plane [kWh/m2/year] for the same location andGref repre-sents the same variable for Lisbon (1868 kWh/m2/year[27]).
This solar factor deals with variables of straightforward knowledge that characterize the urban solar access at a specific site, similarly to[28]. The term 0.38 and the constantþ140 represent the linear regression (R2¼0.75) and bias between the PV potential estimated by theIrradiance methodand thePeak Power method, and account respectively for the site's latitude, i.e. the variable solar height in the course of the year, and the subsequent shading phe-nomena due to the urban layout and diversity of building heights. Of course, the PV power per unit area, Pp, and the performance
ratio,PR, are independent of location. Moreover, the total building footprint area shows a strong correlation (regression coefficient of 4.3 with R2¼0.93) with the available surface on building surfaces, which is embedded in thefinal term 0.21, and the meteorological conditions of the site are introduced by the ratio between average irradiance and the reference irradiance for the specific location analyzed in this study.
This approach can, therefore, be employed anywhere in the world where the building footprints area and average global hori-zontal irradiance are known.
5. Conclusions
The solar PV potential of rooftops and building façades in a small area was estimated through two different approaches, in order to study the power balance of the distribution grid in a future scenario with high PV penetration. The first approach, the Peak power method, considers installed PV peak power and the annual average demand, and thus depends solely on the building rooftop and/or façade area whilst the second, theIrradiance method, performs an hourly time step solar irradiance and uses demand simulations or real data.
It is shown that the grid becomes locally less resilient with massive PV deployment hence the sizing of the urban power transformers ought to consider future deployment of solar photo-voltaics in buildings. If the available building surfaces are solely rooftops, the simple and straightforwardPeak Power method rep-resents a legitimate way of getting good estimates of future PV production while avoiding excessive computational effort. If building façades are available for the commissioning of PV systems,
708 -4034 -1403 -3409 -3297 -355 -6502 -743 -648 -2809 -1422 730 1040 -680 96 -468 67 -2928 17 -406 -17 191 -322 -602 -1375 -227 -81
4 -315 -879
-169 -524 -120 -226 1 796 -115 -680 -154 -597 -441
B
PT balance [kW]
-6500
>0
PT balance [kW]
-6500
>0
theIrradiance methodshould be used instead. This second scenario is expected to be relevant at a medium term, when PV costs reach low enough levels to enable PV deployment in less favourable conditions.
A solar PV factor was proposed to account for future deployment of PV systems in urban environments, which relies on variable of forthright knowledge such as the buildings footprint area and the site's average global solar irradiance.
Acknowledgments
The authors would like to thank Logica for the opportunity to use the LiDAR data set and EDP Distribuiç~ao for the distribution transformers data set.
This publication was partially supported by MIT Portugal Pro-gram for Sustainable Energy Systems, Instituto Dom Luiz - UID/ GEO/50019/2013, CICS.NOVA - UID/SOC/04647/2013, with the financial support of FCT/MCTES through National funds, and Pro-jects MITP-TB/CS/0026/2013 (SUSCITY) and PTDC/EMS-ENE/4525/ 2014 (PVCITY). Teresa Santos was funded by FCT post-doctoral grant SFRH/BPD/76893/2011 and Sara Freitas was funded by FCT doctoral grant SFRH/BD/52363/2013 and Calouste Gulbenkian Foundation award 2014.
References
[1] M. Karimi, H. Mokhlis, K. Naidu, S. Uddin, A.H.A. Bakar, Photovoltaic pene-tration issues and impacts in distribution networkea review, Renew. Sustain.
Energy Rev. 53 (Jan. 2016) 594e605.
[2] R. Passey, T. Spooner, I. MacGill, M. Watt, K. Syngellakis, The potential impacts of grid-connected distributed generation and how to address them: a review of technical and non-technical factors, Energy Policy 39 (10) (Oct. 2011) 6280e6290.
[3] K.D. Harden, Optimizing Energy Efficiency Standards for Low Voltage Distri-bution Transformers, Fort Wayne, Purdue University, Indiana, 2011. [4] A.R.A. Manito, A. Pinto, R. Zilles, Evaluation of utility transformers' lifespan
with different levels of grid-connected photovoltaic systems penetration, Renew. Energy 96 (Oct. 2016) 700e714.
[5] H. Joshi, Residential, Commercial and Industrial Electrical Systems: Equipment and Selection, vol. 1, Tata McGraw-Hill Publishing company Limited, 2008. [6] M. Braun, T. Stetz, R. Bründlinger, C. Mayr, K. Ogimoto, H. Hatta, H. Kobayashi,
B. Kroposki, B. Mather, M. Coddington, K. Lynn, G. Graditi, A. Woyte, I. MacGill, Is the distribution grid ready to accept large-scale photovoltaic deployment? State of the art, progress, and future prospects, Prog. Photovoltaics Res. Appl. 20 (6) (Sep. 2012) 681e697.
[7] D. Santos-Martin, S. Lemon, J.D. Watson, A.R. Wood, A.J.V. Miller, N.R. Watson, Impact of solar photovoltaics on the low-voltage distribution network in New Zealand, IET Generation, Transm. Distribution 10 (1) (Jan. 2016) 1e9.
[8] L.H. Vera, M. Caceres, A. Busso, Grid connected photovoltaic systems to the urban environment of Argentinian Northeast, Energy Procedia 57 (2014) 3171e3180.
[9] D. McPhail, B. Croker, B. Harvey, A study of solar PV saturation limits for representative low voltage networks, in: 2016 Australasian Universities Po-wer Engineering Conference (AUPEC), 2016, pp. 1e6.
B
A
Irradiance met. – Peak power met. [kW]
0 5200
(Irradiance met.– Peak power met.)[%]
0 820
[13] Chun-Lien Su, Hsiang-Ming Chuang, Distribution network reinforcement planning for high penetration level of distributed generation, in: 2014 IEEE International Energy Conference (ENERGYCON), 2014, pp. 1170e1175.
[14] P.C. Ramaswamy, S. Leyder, S. Rapoport, B. Picart, Z. De Greve, D. Vangulick,
“Impact of load and generationflexibility on the long term planning of YLPIC distribution network, in: CIRED Workshop 2016, 2016, p. 120 (4.)-120 (4.). [15] M.C. Brito, S. Freitas, S. Guimar~aes, C. Catita, P. Redweik, The importance of
facades for the solar PV potential of a Mediterranean city using LiDAR data, Renew. Energy 111 (Oct. 2017) 85e94.
[16] P. Fu, P. Rich, Design and implementation of the solar analyst: an arcview extension for modeling solar radiation at landscape scales, in: 19th Annual ESRI User Conference, 1999.
[17] N.M.P. Gomes, Integraçao de dados LIDAR com imagens de muito alta reso-~ luç~ao espacial para determinaç~ao deareas urbanas com potential solar, Fac-uldade de Ci^encias Sociais e Humanas, Universidade Nova de Lisboa, 2011. [18] M. Amado, F. Poggi, Solar urban planning: a parametric approach, Energy
Procedia 48 (2014) 1539e1548.
[19] McNeel, Rhinoceros 5.0, 2016 [Online]. Available:https://www.rhino3d.com/.
[23] S. Freitas, C. Catita, P. Redweik, M.C. Brito, Modelling solar potential in the urban environment: state-of-the-art review, Renew. Sustain. Energy Rev. 41 (Jan. 2015) 915e931.
[24] ERSE, Perfis de perdas, perfis de consumo e de autoconsumo, e perfis de produç~ao, 2016 [Online]. Available: http://www.erse.pt/pt/electricidade/ regulamentos/acessoasredesaasinterligacoes/Paginas/
PerfishorariosdeperdasedeconsumoemBTEBTNeIP.aspx?master¼ErsePrint. master.
[25] M.C. Brito, N. Gomes, T. Santos, J.A. Tenedorio, Photovoltaic potential in a Lisbon suburb using LiDAR data, Sol. Energy 86 (1) (Jan. 2012) 283e288.
[26] T. Santos, N. Gomes, S. Freire, M.C. Brito, L. Santos, J.A. Tenedorio, Applications of solar mapping in the urban environment, Appl. Geogr. 51 (Jul. 2014) 48e57.
[27] SolarGIS, Global Horizontal Irradiation - Portugal, 2017 [Online]. Available: http://solargis.com/assets/graphic/free-map/GHI/Solargis-Portugal-GHI-solar-resource-map-en.png.
![Fig. 1. Delimitation of Alvalade (blue area) and location of the transformers (red dots) (A), Thiessen polygons depicting the influence zones of all transformers (B) and transformer power capacities [kVA] (C)](https://thumb-eu.123doks.com/thumbv2/123dok_br/15828351.655222/3.892.192.709.134.744/delimitation-alvalade-transformers-thiessen-influence-transformers-transformer-capacities.webp)