Printed in Brazil - ©2006 Sociedade Brasileira de Química 0103 - 5053 $6.00+0.00
A
r
ti
c
le
*e-mail: [email protected]
Partial Molar Volume of Mefenamic Acid in Alcohol at Temperatures between T=293.15
and T=313.15 K
Muhammad J. Iqbal* and Mahrukh Siddiquah
Department of Chemistry, Quaid-i-Azam University, Islamabad 45320, Pakistan
Volume molar aparente (VΦ), volume molar parcial (V–), parâmetro de interação soluto-soluto (Sv), expansividade molar parcial (E0
2) e coeficiente de expansão térmica isobárica (α2) do ácido mefenâmico em seis diferentes solventes orgânicos : metanol, etanol, 1-propanol, 2-propanol, 1-butanol e 2-butanol, foram calculados a partir das densidades das soluções medidas no intervalo de temperatura entre 293,15 e 313,15±0,1K. As densidades das soluções foram medidas por um densímetro automatizado (Anton Paar DMA-48). O intervalo de concentração investigado foi de 6,00 × 10⁻³ a 3,25 × 10⁻² mol kg -1. O efeito da temperatura sobre o volume molar aparente e o volume molar parcial foi também determinado. Um decréscimo nas interações soluto-solvente foi observado com o aumento da temperatura. O volume molar parcial do ácido mefenâmico também varia com a variação da polaridade do solvente.
Apparent molar volume (VΦ), partial molar volume (V–), solute-solute interaction parameter (Sv), partial molar expansivity (E0
2) and isobaric thermal expansion coefficient (α2) of mefenamic acid in six different organic solvents namely, methanol, ethanol, 1-propanol, 2-propanol, 1-butanol, and 2-butanol, have been calculated from the measured solution densities over a temperature range of T=293.15 and T=313.15±0.1K. The solution densities were measured by an automated vibrating tube densitymeter (Anton Paar DMA-48). The molality range investigated was between 6×10⁻³ and 3.25 ×10⁻² mol kg -1. The effect of temperature on apparent molar volume and partial molar volume was also determined. Decrease in solute-solvent interactions with an increase in temperature has been noted. Partial molar volume of mefenamic acid changes with the change in solvent polarity.
Keywords: apparent molar volume, partial molar volume, mefenamic acid, partial molar expansivity, alcohol
Introduction
In biophysical chemistry drug-macromolecular interaction is an important phenomenon involving complex molecular mechanism. Perceptible thermodynamic changes are found to be associated with the processes of drug transport,1 drug-protein binding,2 anesthesia3 etc. In the case
of drug-protein binding, anomalous behaviour has been observed with respect to certain drugs.4 Because of the
complexities associated with the structure of biomacro-molecules or with their data interpretation, it is difficult to carry out these processes in physiological media. Consequently, it is imperative that each component of these systems may be studied individually before going to more complex systems. Thermodynamic methods are well recognized and convenient for studying the molecular
interactions in fluids. The partial molar volume, pressure derivative of Gibbs energy, is a useful parameter for interpreting solute-solvent interactions.5,6 Comparison of
the volume of the system with those of its components can assess gross changes in the volume of the system because it is an additive property. In addition, volumetric data can also be interpreted in terms of molecular interactions within the system. Various molecular processes in solutions such as electrostriction,7 hydrophobic hydration,8 micellization
and co-sphere overlap during solute-solute interactions have been interpreted, to a large extent, from the partial molar volume data of many compounds including amino acids, peptides and also some drug compounds.5
Mefenamic acid is known as an antipathologistic analgesic and provides relief of mild to moderate pain, especially pain after surgery and fever. Mefenamic acid is known to strongly bind to the plasma protein.9 As a part of
drug-macromolecule interactions, the results of the determinations of apparent molar volumes (VΦ), partial molar volume (V–), solute-solvent interaction parameter (Sv), partial molar expansivity (E0
2) and isobaric thermal expansion coefficient
(α2) of mefenamic acid in six different organic solvents i.e.
methanol, ethanol, 1-propanol, 2-propanol, 1-butanol, and 2-butanol between T=293.15 and T=313.15±0.1 K are reported in the present study.
Materials and Methods
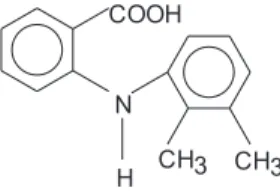
Mefenamic acid (N-(2,3-xylyl) anthranilic acid, molar mass = 241.3 g mol-1) used in this study was supplied by Sigma
(99.3%). The structural formula of mefenamic acid is:
The solvents used were methanol (99%, Merck), ethanol (99%, Acros Organics), 1-propanol (99%, Fluka), 2-propanol (99%, Fluka), 1-butanol (99%, Fluka), and 2-butanol (99%, Fluka). Since values for the density of the pure solvents measured at T=293.15 K were comparable with the literature value10 as shown in Table 1, therefore the solvents were used
without further purification. Molal solutions of mefenamic acid were prepared using m/m % method in calibrated flasks at T=293.15 K. The molality range studied was between
m=6.00×10⁻³ ±10-5 mol kg-1 and m=3.25×10⁻² ±10-5 mol kg-1.
Solutions were prepared immediately prior to measurements by addition of stiochiometric quantity of mefenamic acid to the solvents. The density of various solutions was measured using an automated vibrating tube density meter (Anton Paar DMA 48), with an uncertainty of ±0.0001 g cm-3, which was
calibrated with air and doubly distilled water in the
temperature range investigated. The density measurements were made at different temperatures i.e. T=293.15, 298.15, 303.15, 308.15, 310.65 and T=313.15 ± 0.1K. Apparent molar volume of mefenamic acid was calculated using the following equation: 11
(1)
Where ρ0 = density of pure component 1 (solvent), ρ = density of solution of molality m of mefenamic acid having molar mass M2.
Apparent molar volume (VΦ) of mefenamic acid was then plotted against the molality (m) in different organic solvents i.e. methanol, 1-butanol, 2-butanol and DMF in accordance with equation (2)
(2)
where Sv, Svv are the empirical parameters which depend on solvent, solute and the temperature12 and V– is the partial
molar volume of the solute molecule in the specific solvent. The values of V– and correlation coefficients have been estimated by the least-square fitting of the apparent molar volume data in the equation (2). Only two parameters of equation (2) i.e. partial molar volume (V–) and solute-solute interaction parameter (Sv), were considered to be sufficient to represent the data adequately. The values of partial molar expansivity were then calculated13 from the partial molar volume by the relation:
(3)
Since the changes in the solution structure are very sensitive to temperature changes, the partial molar expansion is a sensitive criterion for the detection of solute-solvent interactions.
Table 1. Density (ρ) of different solvents measured at 293.15±0.1 K and their literature values10
Solvents Reported Experimentally Determined Values Av.
Values ρ / (g cm-3) Value
1 2 3 4 5
Water 0.9982 0.9982 0.9982 0.9982 0.9981 0.9982 0.9981
Toluene 0.8669 0.8670 0.8669 0.8669 0.8669 0.8670 0.8669
Cyclohexane 0.7785 0.7785 0.7785 0.7785 0.7785 0.7785 0.8875
Methanol 0.7914 0.7917 0.7918 0.7917 0.7918 0.7916 0.7917
Ethanol 0.7893 0.7904 0.7906 0.7905 0.7905 0.7905 0.7905
1-Propanol 0.8035 0.8044 0.8044 0.8043 0.8043 0.8043 0.8043
2-Propanol 0.7855 0.7852 0.7851 0.7852 0.7853 0.7853 0.7852
1-Butanol 0.8098 0.8100 0.8100 0.8100 0.8100 0.8100 0.8100
From the partial molar volume (V–) data, the isobaric thermal expansion coefficient of solute at infinite dilution,
α2 was also calculated, by the following equation:14
(4)
Results and Discussion
The apparent molar volume data for mefenamic acid dissolved in methanol, ethanol, 1-propanol, 2-propanol, 1-butanol and 2-butanol (Figures 1-6) increases with concentration at a particular temperature. The apparent molar volume of mefenamic acid at a constant concentration decreases with an increase in temperature of the system in all the solvents (Tables 2-7). The slope of the lines, drawn in accordance with equation (2), resulted in positive values of Sv for all the solutions. In case of positive Sv values (Table 8), the solvent molecules are believed to be more structured in the bulk phase than in the solvation sphere and an increase in the con-centration of the drug compound results in the release of solvent molecules from the solvation shell into the bulk solvent that is more structured.13 The characteristic
of the co-sphere depends upon the drug structure, size, shape and solvophobicity.14 Table 8 shows that the partial
molar volume (V–), partial molar expansivity (E0 2) and
isobaric thermal expansion coefficient (α2) are
independent of concentration and that the values of V–
for mefenamic acid increase with rise in temperature in all the solvents employed here.
According to the scaled particle theory (SP),15 the
expression for the partial molar volume of a solute at infinite dilution is given as follows:
(5)
Where Vcav and Vint are the contributions for the formation of a cavity and from intermolecular interactions respectively, β0is the isothermal compressibility of the
solvent, R is the gas constant and T is the absolute temperature. The creation of a cavity is by definition a positive contribution to the partial molar volume of a solute, whereas the attractive intermolecular solute-solvent interactions cause a negative contribution by shrinking the cavity. The results are also viewed in terms of the geometrical fit of the drug molecules in an ordered solvent. It is difficult to accommodate a complex structured solute such as mefenamic acid in an ordered solvent environment like alcohols. As the temperature of the solution is
increased, cavities are produced in the ordered solvent environment, resulting in the better fit of the complex structured solutes in the solvent. With increasing temperature the contribution from the drug-solvent binding is weakened and the partial molar volume of the drug compounds increases significantly with temperature. It is apparent from Table 8 that Sv values showed somewhat irregular change with increasing temperature.
The isobaric thermal expansion coefficient (α2) for mefenamic acid obtained from equation (4) showed a decreasing behaviour with increasing temperature in all the solvents studied in the present work because when the temperature is increased the density of the solution decreased (Tables 2-7), resulting in a decrease in partial molar expansivity coefficient (α2). A similar trend was observed by Iqbal and Verrall5 for aqueous solutions of
compounds having more than one OH- group, whereas the opposite effect for mono-functional alcohols was observed by Neal and Goring.16 The largest value of the
partial molar volume was obtained in 2-butanol while its value was smallest in methanol as shown in Table 8. The value of V– is larger in 2-butanol as compared to that in 1-butanol (Table 8) with a transfer volume of 25.13 ± 3.98 cm3 mol-1 in the studied temperature range. The difference
in partial molar volume of mefenamic acid in 1- and 2-butanol is considered to be due to differences in the structure of the two solvents in their solvation pattern. For instance, 1-butanol displaying straight chain showed self-association17 to a much greater extent in comparison
to 2-butanol. The number of molecules in 1-butanol aggregates is greater as compared to the aggregates of 2-butanol. The extent to which 1-butanol molecules are bonded to one another in 1-butanol is higher than that in 2-butanol. This resulted in larger partial molar volume of mefenamic acid in 1-butanol than in 2-butanol. Same is the reason for the higher value of partial molar expansivity of the drug compound in two solvents.
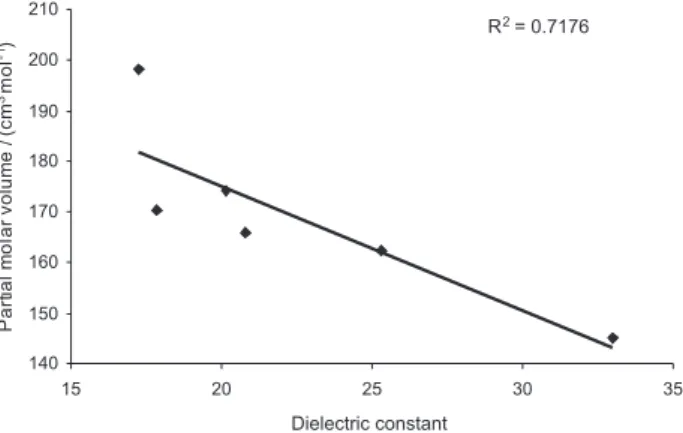
Partial molar volume of mefenamic acid was plotted as a function of solvent dielectric constant, which is a measure of solvent polarity as shown in Figure 8. It is evident that the partial molar volume of mefenamic acid decrease with increase in the solvent polarity. This indicates that by increasing solvent polarity, the solute-solvent interactions are decreased.
The partial molar volume of mefenamic acid was then plotted against the temperature in accordance with equation (3) (Figure 7) and the values of partial molar expansivity of mefenamic acid in different solvents were obtained (Table 9). Highest value of partial molar expansivity (E0
2) of mefenamic acid (0.2262±0.0001
Figure 1. Apparent molar volume (VΦ) as a function of molality (m) of
mefenamic acid in methanol at temperatures between T=293.15 and T=313.15 K.
Figure 2. Apparent molar volume (VΦ) as a function of molality (m) of mefenamic acid in ethanol at temperatures between T=293.15 and T=313.15 K.
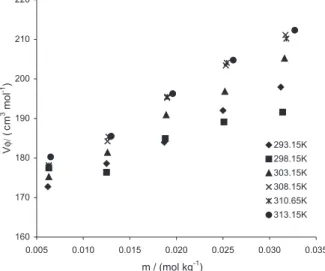
Figure 3. Apparent molar volume (VΦ) as a function of molality (m) of mefenamic acid in 1-propanol at temperatures between T=293.15 and T=313.15 K.
Figure 4. Apparent molar volume (VΦ) as a function of molality (m) of mefenamic acid in 2-propanol at temperatures between T=293.15 and T=313.15 K.
Figure 5. Apparent molar volume (VΦ) as a function of molality (m) of mefenamic acid in 1-butanol at temperatures between T=293.15 and T=313.15 K.
Table 4. Calculated values of the apparent molar volume (VΦ) (±0.01) of mefenamic acid in 1-propanol at 293.15-313.15±0.1K
T / (K) m / (mol kg-1) ρ / (g cm-3) V
Φ / (cm
3 mol-1) T / (K) m / (mol kg-1) ρ / (g cm-3) V
Φ / (cm
3 mol-1)
313.15 0.0000 0.7881 310.65 0.0000 0.7902
0.0064 0.7886 180.28 0.0063 0.7907 178.15
0.0127 0.7891 185.52 0.0127 0.7912 185.35
0.0191 0.7894 196.27 0.0190 0.7915 195.47
0.0255 0.7897 204.74 0.0254 0.7918 204.07
0.0319 0.7900 212.31 0.0318 0.7921 210.19
308.15 0.0000 0.7923 303.15 0.0000 0.7963
0.0063 0.7928 178.01 0.0063 0.7968 175.25
0.0126 0.7933 184.23 0.0126 0.7973 181.40
0.0190 0.7936 195.24 0.0189 0.7976 190.89
0.0253 0.7939 203.40 0.0252 0.7980 196.85
0.0317 0.7942 211.10 0.0316 0.7983 205.21
298.15 0.0000 0.8003 293.15 0.0000 0.8043
0.0063 0.8008 172.53 0.0062 0.8048 172.75
0.0125 0.8013 177.64 0.0125 0.8053 178.60
0.0188 0.8017 184.09 0.0187 0.8057 183.96
0.0251 0.8021 189.12 0.0250 0.8060 192.01
0.0314 0.8025 194.08 0.0312 0.8064 197.94
Table 3. Calculated values of the apparent molar volume (VΦ) (±0.01) of mefenamic acid in ethanol at 293.15-313.15±0.1K
T / (K) m / (mol kg-1) ρ / (g cm-3) V
Φ / (cm
3 mol-1) T / (K) m / (mol kg-1) ρ / (g cm-3) V
Φ / (cm
3 mol-1)
313.15 0.0000 0.7724 310.65 0.0000
0.0065 0.7730 170.45 0.0065 0.7752 170.37
0.0130 0.7735 176.78 0.0129 0.7757 175.62
0.0195 0.7739 183.11 0.0194 0.7761 182.30
0.0260 0.7743 189.45 0.0259 0.7765 188.79
0.0325 0.7747 193.21 0.0324 0.7769 192.63
308.15 0.0000 0.7768 303.15 0.0000 0.7812
0.0064 0.7774 168.10 0.0064 0.7818 167.95
0.0129 0.7779 175.51 0.0128 0.7823 174.23
0.0194 0.7783 182.15 0.0193 0.7827 181.18
0.0258 0.7787 188.13 0.0257 0.7831 187.29
0.0323 0.7791 192.57 0.0322 0.7835 191.28
298.15 0.0000 0.7856 293.15 0.0000 0.7898
0.0064 0.7862 167.79 0.0063 0.7903 167.99
0.0128 0.7867 174.01 0.0127 0.7909 172.75
0.0191 0.7871 179.56 0.0190 0.7913 178.62
0.0256 0.7875 186.45 0.0254 0.7917 185.16
0.0320 0.7879 190.14 0.0318 0.7921 189.02
Table 2. Calculated values of the apparent molar volume (VΦ) (±0.01) of mefenamic acid in methanol at 293.15-313.15±0.1K
T / (K) m / (mol kg-1) ρ / (g cm-3) V
Φ / (cm
3 mol-1) T / (K) m / (mol kg-1) ρ / (g cm-3) V
Φ / (cm
3 mol-1)
313.15 0.0000 0.7728 310.65 0.0000 0.7752
0.0065 0.7734 157.56 0.0065 0.7758 157.55
0.0130 0.7739 170.32 0.0129 0.7763 169.14
0.0195 0.7743 183.08 0.0194 0.7767 182.26
0.0260 0.7747 189.41 0.0259 0.7771 188.74
0.0325 0.7750 198.33 0.0324 0.7774 197.72
308.15 0.0000 0.7776 303.15 0.0000 0.7823
0.0064 0.7782 155.15 0.0064 0.7829 155.14
0.0129 0.7787 169.05 0.0128 0.7834 167.79
0.0193 0.7791 181.43 0.0192 0.7839 171.93
0.0258 0.7795 188.06 0.0257 0.7843 180.83
0.0323 0.7798 197.11 0.0321 0.7846 190.81
298.15 0.0000 0.7870 293.15 0.0000 0.7917
0.0064 0.7876 155.13 0.0063 0.7923 152.73
0.0127 0.7881 166.53 0.0127 0.7928 166.37
0.0191 0.7885 179.47 0.0190 0.7932 178.49
0.0255 0.7889 185.86 0.0254 0.7936 185.00
Table 7. Calculated values of the apparent molar volume (VΦ) (±0.01) of mefenamic acid in 2-butanol at 293.15-313.15±0.1K
T / (K) m / (mol kg-1) ρ / (g cm-3) V
Φ / (cm
3 mol-1) T / (K) m / (mol kg-1) ρ / (g cm-3) V
Φ / (cm
3 mol-1)
313.15 0.00 0.7901 310.65 0.0000 0.7923
0.0063 0.7905 202.07 0.0063 0.7927 201.79
0.0127 0.7909 203.15 0.0126 0.7931 202.07
0.0190 0.7913 203.92 0.0190 0.7935 203.64
0.0254 0.7917 204.08 0.0253 0.7939 203.40
0.0318 0.7921 204.14 0.0317 0.7943 203.54
308.15 0.0000 0.7925 303.15 0.0000 0.7988
0.0063 0.7949 201.52 0.0063 0.7992 200.73
0.0126 0.7953 201.79 0.0125 0.7996 200.82
0.0189 0.7957 202.82 0.0188 0.8000 201.74
0.0253 0.7961 203.12 0.0251 0.8004 201.77
0.0316 0.7965 202.94 0.0315 0.8008 202.07
298.15 0.0000 0.8030 293.15 0.0000 0.8071
0.0062 0.8034 198.84 0.0062 0.8075 198.35
0.0125 0.8038 199.93 0.0124 0.8079 198.62
0.0187 0.8042 200.68 0.0186 0.8083 199.63
0.0250 0.8046 200.84 0.0249 0.8087 199.93
0.0313 0.8050 200.90 0.0311 0.8091 199.75
Table 6. Calculated values of the apparent molar volume (VΦ) (±0.01) of mefenamic acid in 1-butanol at 293.15-313.15±0.1K
T / (K) m / (mol kg-1) ρ / (g cm-3) V
Φ / (cm
3 mol-1) T / (K) m / (mol kg-1) ρ / (g cm-3) V
Φ / (cm
3 mol-1)
313.15 0.0000 0.7946 310.65 0.0000 0.7967
0.0063 0.7951 177.86 0.0063 0.7972 177.73
0.0126 0.7955 190.33 0.0126 0.7977 183.87
0.0189 0.7959 194.42 0.0189 0.7980 194.19
0.0253 0.7962 203.10 0.0252 0.7984 196.17
0.0316 0.7965 207.95 0.0315 0.7987 202.34
308.15 0.0000 0.7986 303.15 0.0000 0.8025
0.0063 0.7991 177.60 0.0062 0.8030 175.35
0.0125 0.7996 182.77 0.0125 0.8035 182.46
0.0188 0.7999 193.41 0.0187 0.8039 184.11
0.0251 0.8003 195.54 0.0250 0.8043 191.57
0.0315 0.8006 202.09 0.0313 0.8046 195.99
298.15 0.0000 0.8063 293.15 0.0000 0.8100
0.0062 0.8068 175.11 0.0062 0.8105 174.88
0.0124 0.8073 181.21 0.0124 0.8110 180.92
0.0187 0.8077 183.79 0.0186 0.8114 182.86
0.0249 0.8081 190.75 0.0248 0.8118 189.94
0.0312 0.8084 195.23 0.0310 0.8121 194.15
Table 5. Calculated values of the apparent molar volume (VΦ) (±0.01) of mefenamic acid in 2-propanol at 293.15-313.15±0.1K
T / (K) m / (mol kg-1) ρ / (g cm-3) V
Φ / (cm3 mol-1) T / (K) m / (mol kg-1) ρ / (g cm-3) VΦ / (cm3 mol-1)
313.15 0.0000 0.7680 310.65 0.0000 0.7703
0.0065 0.7685 183.66 0.0065 0.7708 183.50
0.0130 0.7690 190.06 0.0130 0.7713 189.86
0.0196 0.7694 197.07 0.0195 0.7717 196.24
0.0261 0.7697 203.31 0.0261 0.7720 203.04
0.0327 0.7700 209.95 0.0326 0.7723 209.32
308.15 0.0000 0.7724 303.15 0.0000 0.7768
0.0065 0.7729 183.35 0.0064 0.7773 181.05
0.0130 0.7734 189.68 0.0129 0.7778 188.36
0.0195 0.7738 196.02 0.0194 0.7782 194.97
0.0260 0.7741 205.59 0.0259 0.7785 201.42
0.0325 0.7743 213.89 0.0324 0.7788 207.80
298.15 0.0000 0.7808 293.15 0.0000 0.7852
0.0064 0.7813 180.78 0.0064 0.7857 180.48
0.0128 0.7818 187.07 0.0128 0.7862 186.71
0.0193 0.7822 193.97 0.0192 0.7866 192.94
0.0257 0.7825 200.11 0.0256 0.7869 199.17
Figure 8. Partial molar volume (V–) at infinite dilution of mefenamic acid as a function of the dielectric constant of the solvent at T=293.15 K.
Figure 7. Partial molar volume (V–) as a function of temperature (T) of mefenamic acid in different solvents.
Table 9. Partial molar expansivity of mefenamic acid in different sol-vents
Sr. No. Solvents E0
2 / (cm 3 mol-1K-1)
1 Methanol 0.2035
2 Ethanol 0.1310
3 1-Propanol 0.2262
4 2-Propanol 0.1469
5 1-Butanol 0.0920
6 2-Butanol 0.2064
to those obtained for methanol, ethanol, 2-propanol, 1-butanol (Table ). The increasing order of partial molar expansivity (E0
2) of mefenamic acid in different solvents
represented as:
1-propanol > 2-butanol >methanol > 2-propanol > ethanol > 1-butanol.
Conclusions
Partial molar volume of mefenamic acid is a function of temperature and increases linearly with temperature. When the solvent polarity was increased, partial molar volume showed a decreasing trend.
References
1. Iqbal, M.; Verrall, R. E.; J. Phys. Chem.1987, 91, 967. 2. Katz, S.; Shinaberry, R. G.; Heck, E. L.; Squire, W.;
Biochemistry1980, 19, 3805.
3. Roth, S.H.; Annual Rev. Pharmacol. Toxicol. 1979, 19, 159. 4. Judis, J.; J. Pharm. Sci.1980, 69, 885.
5. Iqbal, M.; Verrall, R. E.; Canadian J. Chem.1989, 67, 727. 6. Iqbal, M. J.; Malik, Q. M.; J. Chem. Thermodynamics2005,
37, 1347.
7. Harned, H. S.; Owen, B. B.; The Physical Chemistry of
Electrolyte Solution, Reinhold: New York, 1958.
8. Tanford, C.; Hydrophobic Effect: Formation of Micelles and
Biological Membranes, 2nd ed., Wiley-Interscience: New York,
1980.
9. Katzung, G. B.; Basic and Clinical Pharmacology, 4th ed.,
Appleton & Lange: California, 1989.
Table 8. Values of the partial molar volume (V–), isobaric thermal expansion coefficient (α2) and solute-solute interaction parameter (SV) of mefenamic acid in various organic solvents at 293.15-313.15 K
T / (K) Methanol v/α2/sv/ Ethanol v/α2/sv/ 1-Propanol v/α2/sv/
V– α2 Sv V– α2 Sv V– α2 Sv
(cm3mol-1) (K-1 10-3) (cm3 mol-2 kg) (cm3mol-1) (K-1 10-3) (cm3 mol-2 kg) (cm3mol-1) (K-1 10-3) (cm3 mol-2 kg)
293.15 145.20 1.421 1578.50 162.43 0.807 854.84 165.94 1.363 1020.70
298.15 146.83 1.406 1543.60 162.47 0.806 892.69 167.13 1.353 869.34
303.15 147.80 1.396 1323.0 162.54 0.806 925.68 167.36 1.352 1192.50
308.15 148.42 1.391 1547.50 16286 0.804 951.77 168.89 1.339 1344.00
310.65 149.13 1.384 1542.10 164.65 0.796 890.29 169.50 1.335 1299.50
313.15 149.55 1.380 1548.40 165.15 0.793 895.03 170.86 1.324 1305.60
2-Propanol 1-Butanol 2-Butanol
293.15 174.24 0.843 974.00 170.28 0.540 767.14 198.02 1.028 66.31
298.15 174.36 0.843 1003.70 170.35 0.540 796.12 198.73 1.024 80.30
303.15 174.85 0.840 1024.10 170.83 0.539 804.04 200.34 1.016 57.54
308.15 174.95 0.840 1184.40 171.34 0.537 1000.70 201.19 1.011 65.76
310.65 176.99 0.830 992.61 171.63 0.536 1010.0 201.44 1.010 75.99
10. Handbook of Chemistry & Physics; Editor in Chief David R. Lide, 79th ed., CRC: New York, 1998-1999.
11. Klotz, I. M.; Rosenberg, R. M.; Chemical Thermodynamics, Basic Theory and Methods, 3rd ed., W. A. Benjamin: California,
1972, Ch.16.
12. Iqbal, M., Mateeullah, M.; Canadian J. Chem. 1990, 68, 725. 13. Rudan-Tasic, D.; Klofutar, C.; Monatsh. Chem.1998, 129,
1245.
14. Stolipin, V. F.; Mishustin, A. J.; J. Phys. Chem. (Russian)1987, 61, 3226.
15. Gurney, R. W.; Ionic Processes in Solutions, McGraw Hill: New York, 1954.
16. Neal, J. L.; Goring, D. A. I.; J. Phys. Chem. 1970, 74, 658. 17. Reichardt, C.; Solvents and Solvent Effects in Organic
Chemistry, 2nd ed., VCH: Weinheim, 1988, Ch. 2.
Received: January 17, 2006