Printed in Brazil - ©2006 Sociedade Brasileira de Química 0103 - 5053 $6.00+0.00
Article
*e-mail: [email protected]
Development of MSPD Method for the Determination of Pesticide Residues
in Tomato by GC-MS
Adalberto Menezes Filho,a Sandro Navickieneb and Haroldo S. Dórea*,b
a
Centro Federal de Educação Tecnológica de Sergipe, Av. Engenheiro Gentil Tavares Mota n° 1166, 49055-260 Aracaju - SE, Brazil
b
Departamento de Química, Universidade Federal de Sergipe, Av. Marechal Rondon s/nº, 49100-000 São Cristóvão - SE, Brazil
Um método simples e eficiente baseado na técnica de dispersão da matriz em fase sólida foi desenvolvido para determinar resíduos de dimetoato, parationa-metílica, malationa, tebuconazol, e cipermetrina em tomate, por cromatografia gasosa acoplada a espectrometria de massas no modo de monitoramento de íons selecionados. Diferentes parâmetros foram avaliados, tais como: tipo (C18, alumina, sílica-gel e Florisil) e quantidade de sorbente e solvente de eluição
(diclorometano, acetato de etila, n-hexano e n-hexano:acetato de etila (1:1 e 1:3, v/v)), sendo que o mais adequado foi alumina na proporção matriz:sorbente de 4:1 (m/m), Florisil como sorbente de purificação e diclorometano como solvente de eluição. Recuperações médias (n=7) de tomates fortificados (0,05-4,0 mg kg-1) variaram de 77 a 100%, com coeficiente de variação
entre 3,7% e 12,9%. Os limites de detecção variaram entre 0,01 e 0,02 mg kg-1, enquanto que os
limites de quantificação variaram entre 0,03 e 0,06 mg kg-1. O método foi aplicado em amostras
de tomates coletadas na cidade de Aracaju, SE, sendo que resíduos de parationa-metílica, malationa e dimetoato foram detectados, porém abaixo dos limites máximos de resíduos (LMRs) estabelecidos pela legislação brasileira e pelo Codex Alimentarius.
A simple and effective extraction method based on matrix solid-phase dispersion was developed to determine dimethoate, methyl-parathion, malathion, tebuconazole and cypermethrin in tomato using gas chromatography-mass spectrometry and selected ion monitoring (GC-MS, SIM). Different parameters of the method were evaluated, such as type of solid phase (C18,
alumina, sílica-gel and Florisil), the amount of solid phase and eluent [dichloromethane, ethyl acetate, n-hexane and n-hexane:ethyl acetate (1:1 and 1:3, v/v)]. The best results were obtained using 2.0 g of tomato, 0.5 g of alumina as dispersant sorbent, 0.5 g of Florisil as clean-up sorbent and dichloromethane as eluting solvent. The method was validated by fortified tomato samples at different concentration levels (0.05 to 4.0 mg kg-1). Average recoveries (7 replicates)
ranged from 77% to 100% with relative standard deviation between 3.7% and 12.9%. Detection and quantification limits ranged from 0.01 to 0.02 mg kg-1 and 0.03 to 0.06 mg kg-1 for the
whole fruit of tomato, respectively. The proposed method was applied to analyze of these compounds in commercial tomato samples and residues of methyl-parathion, dimethoate and malathion were detected on the tomato samples at concentrations below the maximum residue levels (MRLs) established by Brazilian legislation and Codex Alimentarius.
Keywords: MSPD, extraction methods, tomato, pesticides, GC-MS
Introduction
The tomato fruit (Lycopersicon esculentum) is one of the most important components of the human diet in different countries, where it is consumed in its raw form, home-cooked or processed as juice or paste. Besides, the
belong to the classes of organophosphorus, pyrethroids, triazoles and are mainly malathion, methyl-parathion, dimethoate, cypermethrin and tebuconazole.2 With regards to methyl-parathion it is important to notice that it was formerly used, but it has recently been discontinued in compliance to the Brazilian legislation. Consequently, after their application, pesticide residues may remain in this crop and constitute a health risk because of their toxicity. Therefore, monitoring of pesticide residues in tomatoes is of particular concern to consumer safety. Besides, studies have suggested that malathion and dimethoate have been identified as potential endocrine disruptors.3-5
Several multiresidue methods for the determination of pesticide residues in vegetables including tomato are mainly based on liquid-liquid extraction by organic solvents such as acetone, ethyl acetate and dichloromethane,6-11 solid-phase extraction (SPE) using sorbents such as Florisil, silica gel, C18 and alumina,12-15 supercritical fluid extraction (SFE) and stir-bar sorbent extraction (SBSE).16,17 The cleanup step is based on solid-phase extraction or gel permeation chromatography.7,9 Final determinations are carried out using liquid chromatography (LC) with diode array detection (DAD) or mass selective detection and gas chromatography (GC) with electron-capture, nitrogen-phosphorus or mass selective detection.6-8,14,16,18,22 Moreover, matrix solid-phase dispersion (MSPD) procedures have been reported to determine pesticide residues in grains, fruits and vegetable matrices. These MSPD procedures used C18 or graphitized carbon black (GCB) as sorbent to extract the compounds from the tomato matrix.18-23
The present work reports a simple methodology for simultaneous determination of dimethoate, methyl-parathion, malathion, tebuconazole and cypermethrin in tomato by means of matrix solid-phase dispersion and
gas chromatography using mass selective detection. The method developed was applied to determine of pesticide residues in fresh tomatoes from a local market. Figure 1 shows the chemical structures of the pesticides studied.24
Experimental
Standards, reagents and supplies
Dichloromethane, ethyl acetate and n-hexane were nanograde (Mallinckrodt Baker, Paris, KY, USA). Certified standards of dimethoate, methyl-parathion, malathion, tebuconazole and cypermethrin were purchased from Dr. Ehrenstorfer (Augsburg, Germany). All standards were at least 98.5% pure. The individual stock solutions of the analytes were prepared in ethyl acetate at 500 µg
mL-1 and stored at -18 °C. The working standard solutions were prepared by diluting the stock solutions as required in dichloromethane. Matrix-matched standards were prepared at the same concentration as that of calibration solutions by adding appropriate amounts of standards to the control matrix extract. Analytical grade anhydrous sodium sulfate was supplied from Mallinckrodt Baker (Paris, KY, USA). Research grade Florisil (80-100 mesh) was supplied from Sigma (Büchs, Switzerland). C18 -bonded silica (50 µm) was obtained from Phenomenex
(Torrance, CA, USA), silica-gel 60 (70-230 mesh) from Merck (Darmstadt, Germany), neutral alumina (70-290 mesh, activity I) from Macherey-Nagel (Düren, Germany).
Apparatus
A Shimadzu system consisting of a QP-5050A mass spectrometer equipped with a GC-17A gas chromatograph with a split/splitless injector was used for the quantification and confirmation of the pesticides studied. A fused-silica column DB-5 (5% phenyl-95% polydimethylsiloxane; 30 m × 0.25 mm ID, 0.25 µm), supplied by J&W Scientific
(Folsom, CA, USA), was employed with helium (purity 99.999%) as carrier gas at a flow-rate of 1.8 mL min-1. The column temperature was programmed as follows: 80 °C for 1 min, increasing to 240 °C at 10 °C min-1 and directly to 265 °C at 10 °C min-1 and holding for 10 min. The solvent delay was 5 min. The injector port was maintained at 250 °C and 1 µL volume was injected in
splitless mode (0.7 min). The data were acquired and processed by the Shimadzu class 5000 software. The total analysis time was 23 min.
The eluent from the GC column was transferred via a transfer line held at 280 °C and fed into a 70eV electron impact ionization source held at 280 °C. The analysis was
performed in the selected ion monitoring (SIM) mode with the followed ions for the first acquisition window (8.00 to 19.00 min) m/z 87, 125 and 229 for dimethoate, m/z 109, 125 and 246 for methyl-parathion, m/z 125, 158 and 263 for malathion and m/z 70, 125 and 250 for tebuconazole, and for the second acquisition window (19.00 to 23.00 min) m/z 163, 181 and 207 for cypermethrin.
Sample preparation and fortification
The tomato samples used for method development were obtained from organic farming in pesticide free crops located in the city of Aracaju, state of Sergipe, Brazil. A representative portion of the sample (400 g) was chopped with a stainless-steel knife and homogenized using a household blender and stored on jars at –18 °C until analysis. The tomato samples were analysed unwashed. Fortified samples were prepared by adding 500 µL of
different standard solutions to 2 g of sample resulting in the levels of 0.05 to 4.0 mg kg-1. The fortified tomatoes were left to stand for a 30 minutes before extraction to allow the spike solution to penetrate into the matrix. Each fortification level was analised through seven replicates. The extraction procedure described below was followed.
Extraction procedure
An aliquot of tomato (2.0 g) was placed into a glass mortar (ca. 50 mL) and 0.5 g of alumina was added. The tomato was then gently blended into the neutral alumina material with a glass pestle, until a homogeneous mixture was obtained (ca. 1 min). The homogenized mixture was introduced into a 100 × 20 mm ID polypropylene column
filled with 0.1 g of silanized glass-wool at the bottom, 0.5 g of Florisil and 3.0 g of Na2SO4 anhydrous, respectively. The column was lightly tapped to remove air pockets. A 20 mL portion of dichloromethane was added to the column and the sample was allowed to elute dropwise. The eluent was collected into a graduated conical tube and concentrated using a rotary vacuum evaporator (35 °C) and finally purged with nitrogen to a volume of 1 mL. A 1 µL portion of the extract was then
directly analised by GC-MS.
Results and Discussion
GC-MS conditions
For the purpose of finding the retention times and the best resolution between the pesticide peaks, experiments were carried out by varying the oven temperature and
carrier gas flow in full scan mode using a standard solution (5 µg mL-1). In these evaluations, three characteristic ions
were chosen for quantification of each pesticide. Since cypermethrin is a diastereomer, two peaks corresponding to its cis and trans configuration were detected. The former configuration was selected for quantification. On the other hand, matrix components can provide variation in the detector response to pesticides. So, the matrix effect was evaluated by comparing the detector response with regards to the pesticide standards prepared in dichloromethane to pesticide standards prepared in tomato extract. When standards were prepared by spiking blank tomato samples with known amounts of pesticides, higher peak areas were obtained from the same pesticide concentrations. Consequently, the quantification of pesticide residues was carried out through matrix-matched standards.
Optimization of the MSPD method
produced an extract that shows minimal interferences for most of the pesticides studied, while the use of C18 or silica-gel as support for MSPD method produces highest recoveries (>120%) similar to those obtained with Florisil, considering the same proportion between solid-phase and tomato matrix. In addition, different alumina:tomato matrix ratios (5:1, 1:4, 1:2, 1:1, 2:1, m/m) were attempted to optimize the MSPD method. The results obtained show that the best recoveries are obtained using 0.5 g of alumina + 2.0 g of tomato matrix (1:4, m/m). Moreover, an increase in the alumina amount did not improve the recovery of the pesticides studied (Table 2).
Finally, the elution of the pesticides in tomato from alumina:tomato matrix blend using 20 mL of dichloro-methane resulted in high recoveries ranging from 119% to 251% for these compounds. This occurrence can be attributed to the presence of interfering endogenous compounds. So, to ensure the removal of these interfering compounds, it was investigated the addition of another adsorvent, which was packed below the alumina-blended sample in the MSPD column. Florisil and silica-gel were separately tested to constitute the clean-up layer in the extraction column. The results demonstrated that Florisil was more effective in removing interfering compounds than silica-gel, with values ranging from 77% to 110% (Table 3). All analyses were carried out in duplicate. On
the basis of these overall results, the combined effect of alumina as solid-phase, Florisil as clean-up layer and dichloromethane as elution solvent makes this extraction column suitable for determining dimethoate, malathion, methyl-parathion, tebuconazole and cypermethrin in a complex matrix such as tomato. Once the factors that affect the MSPD procedure had been optimized, validation of the method was performed.
Validation of the MSPD method
Recovery study. Recovery data were calculated by
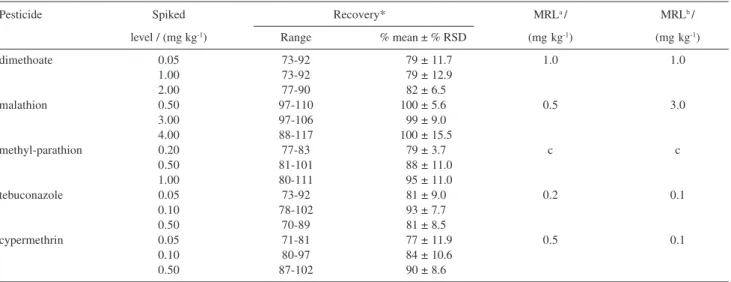
comparison to the appropriate working standard solutions. The untreated tomatoes were fortified at different concentrations (0.05 to 4.0 mg kg-1) and residues were quantified by using the external standard method. Standard solutions were injected after every ten samples to monitor changes in chromatographic conditions. Fortification levels were selected to reach the maximum residue levels (MRLs) established by the Brazilian legislation and the Codex Alimentarius values, which range from 0.1 mg kg-1 to 3.0 mg kg-1 for the pesticides selected in tomato, Table 4.2,25 The results of the average recoveries ranging from 77% to 100%, with relative standard deviation (RSD) values of 3.7% to 12.9%, as can be seen on Table 4. Each recovery analysis was repeated 7 times. The precision and accuracy were considered adequate for validating the method according to the validation criteria. Accuracy has been calculated as the percent ratio between the found and the know concentrations and precision has been determined as the percentage in coefficient of variation (%RSD), which is the ratio between standard deviation and average concentration found.26
Linearity, detection and quantification limits. The detector response was linear in the range of concentrations studied. The linearity of all the compounds was determined using blank tomato samples fortified at concentration levels ranging from 0.04 to 2.0 mg kg-1. The slope and intercept
Table 2. Influence of different sorbent:matrix proportions (m/m) on
pes-ticide recovery in the extraction procedure using neutral alumina as sor-bent and dichloromethane as elution solvent. Tomato sample fortified at 0.5 mg kg-1 (n=2)
Pesticide Recovery / (%)
alumina:tomato matrix (m/m) (5:1) (1:4) (2:l) (1:1) (1:2)
dimethoate 194 119 135 132 172
malathion 233 145 156 148 177
methyl-parathion 175 107 125 110 130
tebuconazole 426 251 276 284 363
cypermethrin 259 18 158 159 194
Table 1. Influence of different solid-phase sorbents on pesticide
recove-ry in the extraction procedure, using dichloromethane as elution solvent and 2.0 g of tomato + 0.5 g of sorbent. Tomato sample fortified at 0.5 mg kg-1 (n=2)
Pesticide Recovery / (%)
Sorbent tested
C18 Florisil silica alumina
dimethoate 206 101 139 120
malathion 276 191 219 150
methyl-parathion 232 110 135 107
tebuconazole 421 218 288 252
cypermethrin 402 241 140 120
Table 3. Influence of clean-up layer in combination with alumina on
pes-ticide recovery, in the extraction procedure using dichloromethane as elu-tion solvent. Tomato sample fortified at 0.5 mg kg-1 (n=2)
Pesticide Recovery / (%)
clean-up layer without clean-up Florisil silica
dimethoate 119 80 160
malathion 145 110 172
methyl-parathion 107 99 128
tebuconazole 251 95 93
values together with their standard deviations were determined by applying regression analyses. Good determination coefficients were obtained from the pesticides, ranging from 0.9967 to 0.9981.
The limits of detection (LOD) for the pesticides studied ranged from 0.01 to 0.02 mg kg-1, which were calculated considering the standard deviation of noise (a value of 7 times the standard deviation of the blank) and the slope of the regression line. The limits of quantification (LOQ) were determined as the lowest concentration of still responsive compounds that could be quantified with a RSD of less than 15% and a recovery at least 70%. So, the LOQ values for these compounds were between 0.03 and 0.06 mg kg-1.26 Table 5 summarizes these data of the pesticides studied.
Sample analysis
The developed method was applied to determine the pesticides selected in four tomato samples obtained from local market. The samples were analized in triplicate. Results show that all samples contained detectable
pesticide residues. Malathion was found in all samples ranging from 0.08 to 0.10 mg kg-1, methyl-parathion was found in two samples ranging from 0.09 to 0.12 mg kg-1 and dimethoate was found in all samples ranging from 0.08 to 0.12 mg kg-1. None of the samples contained detectable residues of either cypermethrin or tebuconazole. The concentrations found in tomato were always lower than the maximum residue levels established for tomato by the Brazilian legislation and Codex Alimentarius Commission, Table 4. On the other hand, the use of methyl-parathion in tomato crops is not authorized by Brazilian laws. Therefore, the data obtained demonstrated that this active ingredient has been irregularly applied to the treatment of tomato crops in the state of Sergipe, Brazil, despite of its prohibited use.
Conclusions
The proposed MSPD procedure followed by GC-MS (SIM) can be applied to determine dimethoate methyl-parathion, malathion, tebuconazole and cypermethrin in tomato. The method uses an alumina-based on the MSPD
Table 5. Retention times, calibration data, LOD and LOQ of the pesticides analysed by GC-MS
Pesticide retention time / calibration data LOD / (mg kg-1) LOQ / (mg kg-1)
(min) equation determination
coefficient
dimethoate 9.04 y= 509029x - 47483 0.9981 0.01 0.05
methyl-parathion 10.44 y= 199152x - 13880 0.9981 0.02 0.06
malathion 11.04 y= 253513x - 4934 0.9967 0.01 0.03
tebuconazole 14.74 y= 194172x + 3160 0.9980 0.02 0.06
cypermethrin 18.74 y= 103467x + 460 0.9969 0.02 0.06
Table 4. Percentage recoveries and relative standard deviations obtained by MSPD procedure of fortified tomatoes and maximum residue limits for the
pesticides studied (* n=7)
Pesticide Spiked Recovery* MRLa / MRLb /
level / (mg kg-1) Range % mean ± % RSD (mg kg-1) (mg kg-1)
dimethoate 0.05 73-92 0079 ± 11.7 1.0 1.0
1.00 73-92 0079 ± 12.9
2.00 77-90 082 ± 6.5
malathion 0.50 97-110 100 ± 5.6 0.5 3.0
3.00 97-106 099 ± 9.0
4.00 88-117 0100 ± 15.5
methyl-parathion 0.20 77-83 079 ± 3.7 c c
0.50 81-101 0088 ± 11.0
1.00 80-111 0095 ± 11.0
tebuconazole 0.05 73-92 081 ± 9.0 0.2 0.1
0.10 78-102 093 ± 7.7
0.50 70-89 081 ± 8.5
cypermethrin 0.05 71-81 0077 ± 11.9 0.5 0.1
0.10 80-97 0084 ± 10.6
0.50 87-102 090 ± 8.6
column and Florisil as co-column and dichloromethane as elution solvent. The results demonstrate that the accuracy, precision and selectivity of the proposed method are acceptables for multiresidue analysis of pesticides and that the LOQs achieved by the method were lower than the values set by Brazilian legislation and Codex Alimentarius. Besides, the method requires a small sample size and offers considerable savings in terms of solvent consumption, cost of materials, sample manipulation and analysis time. On the other hand, the presence of these pesticides in tomato could be accomplished in < 50 min upon sample receipt, after suitable adjustment of chromatographic conditions. With regards to the tomato samples from a local market, detectable residues of dimethoate (0.08-0.12 mg kg-1), malathion (0.08-0.10 mg kg-1) and methyl-parathion (0.09-0.12 mg kg-1) were found. However, in all cases, the pesticide levels were lower than the MRLs established by the Brazilian legislation and Codex Alimentarius.
Acknowledgments
The authors wish to thank Prof. Jailson Bittencourt de Andrade (Laboratório de Pesquisas e Desenvolvimento em Química-LPQ) at Universidade Federal da Bahia for the technical support and CNPq/MCT-FAPITEC-SE/ FUNTEC for the fellowship and financial support to this study.
References
1. Gambacorta, G.; Faccia, M.; Lamacchia, C.; Di Luccia, A.; La Notte, E.; Food Control2005, 16, 629.
2. http://www.anvisa.gov.br/toxicologia/monografias/index.htm, accessed in July 2005.
3. Bruhn, C. M.; Food Chem. 2005, 16, 487. 4. Abou-Arab, A. A. K.; Food Chem. 1999, 65, 509.
5. http://www.epa.gov/scipoly/oscpendo/, accessed in April 2006. 6. Vidal, J. L. M.; Arrebola, F. J.; Sánchez, M. M.; J. Chromatogr.,
A2002, 959, 203.
7. Gelsomino, A.; Petrovicová, B.; Tiburtini, S.; Magnani, E.; Felici, M.; J. Chromatogr., A1997, 782, 105.
8. Garrido, J.; Alba, M.; Jimenez, J.; Casado, E.; Folgueiras, M. L.; J. Chromatogr., A1997, 765, 91.
9. Balinova, A.; J. Chromatogr., A1998, 823, 11.
10. Caboni, P.; Sarais, G.; Melis, M.; Cabras, M.; Cabras, P.; J.
Agric. Food Chem. 2004, 52, 6700.
11. Muccio, A.; Camoni, I.; Ventriglia, M.; Barbini, D. A.; Mauro, M.; Pelosi, P.; Generali, T.; Ausili, A.; Girolimeti, S.; J. Chromatogr., A1995, 697, 145.
12. Melo, L. F. C.; Collins, C. H.; Jardim, I. C. F. S.; J. Chromatogr., A2005, 1073, 75.
13. Obana, H.; Okihashi, M.; Akutsu, K.; Kitagawa, Y.; Hori, S.; J. Agric. Food Chem. 2002, 50, 4464.
14. Gamón, M.; Saez, A.; Pelegrí, R.; Perís, I.; Cuadra, J. G.; Coscollá, R.; J. Assoc. Off. Anal. Chem. Int. 1998, 81, 1037. 15. Kaipper, B. I. A.; Madureira, L. A.; Corseuil, H. X.; J. Braz.
Chem. Soc. 2001, 12, 514.
16. Rissato, S. R.; Galhiane, M. S.; Souza, A. G.; Apon, B. M.; J. Braz. Chem. Soc. 2005, 16, 1038.
17. Garcia, A. J.; Picó, Y.; Font, G.; J. Chromatogr., A2005, 1073, 229.
18. Navarro, M.; Picó, Y.; Marin, R.; Mañes, J.; J. Chromatogr., A
2002, 968, 201.
19. Viana, E.; Moltó, J. C.; Font, G.; J. Chromatogr., A1996, 754, 437.
20. Torres, C. M.; Picó, Y.; Mañes, J.; J. Chromatogr., A1997, 778, 127.
21. Dórea, H. S.; Sobrinho, L. L.; J. Braz. Chem. Soc. 2004, 15, 690.
22. Dórea, H. S.; Lopes, W. G.; Quim. Nova, 2004, 27, 892. 23. Dórea, H. S.; Lanças, F. M.; J. Microcolumn Sep. 1999, 11,
367.
24. Tomlin, C.; The Pesticide Manual, 10th ed., Crop Protection
Publications: Cambridge, 1994.
25. http://www.codexalimentarius.net/, accessed in July 2005. 26. Hill, A.; Quality Control Procedures for Pesticide Residues
Analysis-Guidelines for Residues Monitoring in the European Union; European Community: Brussels, 2000.
Received: August 25, 2005