Printed in Brazil - ©2004 Sociedade Brasileira de Química 0103 - 5053 $6.00+0.00
Article
* e-mail: [email protected]
The Ion Exchange Properties and Equilibrium Constants of Li
+, Na
+and K
+on Zirconium
Phosphate Highly Dispersed on a Cellulose Acetate Fibers Surface
Claudemir Adriano Borgoa, Angélica M. Lazarina, Yuriy V. Kholinc, Richard Landersb and
Yoshitaka Gushikem*,a
a
Instituto de Química, CP 6154 and bInstituto de Física Gleb Wataghin, CP 6165, Universidade Estadual de Campinas,
13084-971 Campinas - SP, Brazil
c
Chemical Faculty, V.N. Karazin Kharkov National University, 4 Svoboda Square, Kharkov 61077, Ukraine
Fosfato de zircônio altamente disperso foi preparado reagindo acetato de celulose/ZrO2 (ZrO2 = 11 wt%, 1,0 mmol g-1 de átomo de zircônio por grama de material) com ácido fosfórico. Os dados de RMN 31P (HPDEC-MAS) com rotação de ângulo mágico desacoplado e Espectroscopia de Fotoelétron de raios-X indicam que a espécie HPO42- está presente na superfície da membrana. A concentração específica de centros ácidos, determinada pela adsorção de gás amônia, foi de 0,60 mmol g-1. As capacidades de troca-iônica dos íons Li+, Na+ eK+ foram determinadas das isotermas de troca-iônica à 298 K e mostraram os seguintes valores ( em mmol g-1): Li+ = 0,05, Na+ = 0,38 e K+ = 0,57. Devido ao forte efeito cooperativo a troca-iônica de H+/Na+ e H+/K+ apresentou natureza não ideal. Esse equilíbrio de troca-iônica foi tratado com o uso de modelos de centros bi ou tridentados que considera a superfície do sorvente como centros de sorção polifuncionais. Tanto as capacidades de troca-iônica observadas com os respectivos íons metálicos alcalinos quanto as constantes de equilíbrio foram discutidas considerando a seqüência dos raios de hidratação iônicos para Li+, Na+ e K+. As afinidades para os íons diminuem com o aumento do raio de hidratação dos cátions, por ex. Li+< Na+ < K+ . Os altos valores dos fatores de separação de S
Na+ /Li+ e S
K+
/Li+ permitem aplicar este material para a separação quantitativa de Na+ e K+ de Li+ de uma mistura contendo esses três íons.
Highly dispersed zirconium phosphate was prepared by reacting celullose acetate/ZrO2 (ZrO2 = 11 wt%, 1.0 mmol g-1 of zirconium atom per gram of the material) with phosphoric acid. High power decoupling magic angle spinning (HPDEC-MAS) 31P NMR and X-ray photoelectron spectroscopy data indicated that HPO42- is the species present on the membrane surface. The specific concentration of acidic centers, determined by ammonia gas adsorption, is 0.60 mmol g-1. The ion exchange capacities for Li+, Na+ and K+ ions were determined from ion exchange isotherms at 298 K and showed the following values (in mmol g-1): Li+= 0.05, Na+= 0.38 and K+= 0.57. Due to the strong cooperative effect, the H+/Na+ and H+/K+ ion exchange is of non ideal nature. These ion exchange equilibria were treated with the use of models of fixed tridentate centers, which consider the surface of the sorbent as polyfunctional sorption centers. Both the observed ion exchange capacities with respect to the alkaline metal ions and the equilibrium constants are discussed by taking into consideration the sequence of the ionic hydration radii for Li+, Na+ and K+. The matrix affinity for the ions decreases with increasing the cations hydration radii from K+ to Li+. The high values of the separation factors SNa+
/Li+ and S K+
/Li+ (up to several hundreds) support the application of this material for the quantitative separation of Na+ and K+ from Li+ from a mixture containing these three ions.
Keywords: cellulose acetate-zirconium phosphate, inorganic-organic hybrid material, stability constants, alkali metal ions separation
Introduction
Cellulose acetate is a polymer that can be easily molded into different forms such as membranes, fibers, and spheres.
To conjugate the mechanical properties of the polymer with the intrinsic properties of an inorganic compound, hybrid organic/inorganic materials have been prepared. 1-10 When inorganic metal oxides are used, the resulting
materials, Cel/MxOy, can be useful for specific applications,
preconcen-51 The Ion Exchange Properties and Equilibrium Constants of Li, Na and K
Vol. 15, No. 1, 2004
tration and determination of Cr(VI);11,12 Al 2O3 for
immobilization of an ion exchange polymer13 or
organo-functional groups for metal adsorption from ethanol solutions;14 Cel/ZrO
2 for phosphate adsorption 15 and
electrocatalytic oxidation of NADH;16 and Nb
2O5 for cobalt
(II) porphyrin immobilization for use in fabricating an oxygen sensor.17 These hybrid materials are normally made
by means of mixing the cellulose acetate and the metal oxide precursor solutions, followed by a phase inversion process.10, 18
Zirconium phosphate type cation exchangers have been extensively studied and are well-known for their excellence as ion exchangers.19,22 However, bulk phase
zirconium phosphate is normally obtained as fine amorphous powder and is very difficult in handling. In order to overcome this problem, an alternative procedure described in this work is to disperse ZrO2 particles on cellulose acetate fibers and, furthermore, react them with phosphoric acid to obtain highly dispersed zirconium phosphate. In a previous work the procedure to obtain aluminum phosphate homogeneously dispersed on a cellulose fiber surface was reported.23 The main feature of
this material was its high ion-exchange capacity with high affinity towards Na+ and K+ while Li+ did not show any
affinity and practically was not exchanged on this matrix surface. Following a similar procedure, zirconium phosphate immobilized on a cellulose acetate fiber surface was prepared and the ion exchange process towards Li+,
Na+ and K+ as well as the equilibrium constants were
studied.
Experimental
Preparation of the cellulose acetate/ZrO2 fibers
About 10 g of the cellulose acetate (Aldrich, 2.5% degree of acetylation) and 0.2 g of ZrOCl2.8H2O were added to a mixture containing 30 mL of glacial acetic acid and 70 mL of acetone. This mixture was vigorously stirred for 4 h until a viscous syrup was formed. The resulting syrup was slowly added to a flask containing about 1000 mL of a NH4OH solution at pH 12, under vigorous stirring. The fibers were collected by filtration, washed with water and dried under vacuum at room temperature. The modified fiber will hereafter be designated as Cel/ZrO2.
Adsorption of phosphoric acid on Cel/ZrO2 fibers
About 5 g of Cel/ZrO2 was immersed in 50 mL of a 0.1 mol L-1 H
3PO4 solution and the mixture was shaken for 4 h
at 298 K. After that, the mixture was filtered and the solid
washed with ethanol and water, and then dried under vacuum (10-3 mPa) at room temperature.
Adsorption of gaseous ammonia on Cel/ZrO2/phosphate
About 1 g of Cel/ZrO2/Phosphate was submitted to an ammonia gas saturated atmosphere in a closed vessel for approximately 1 h. After this treatment the solid was washed with bidistilled water until elimination of all excess ammonia and dried under vacuum (10-3 mPa) at a room
temperature.
Chemical analyses
The amount of zirconium in Cel/ZrO2 was determined by calcinating 0.3 g of the sample at 1173 K, for 2 h, with the residue weighed as ZrO2. The adsorption capacity of Cel/ZrO2 with respect to H3PO4 (solution) was determined from the adsorption isotherm, at 298 K. About 0.1 g of Cel/ ZrO2 was immersed into 25 mL of different H3PO4 solutions, whose initial concentrations were varied in the range 10-3
to 10-5 mol L-1, and shaken for 12 h. The contents of
phosphorus in the supernatant solution were determined by using an inductively coupled plasma (ICP) atomic emission spectroscopy with a Perkin Elmer 3000 DV equipment. The content of adsorbed phosphate was determined by applying the equation:
(Ni – Ns)
Nf = ———— (1)
m
where Ni and Ns are the initial and equilibrium amounts mol of phosphoric acid and m is the mass of the solid.
The amount of nitrogen in Cel/ZrO2/phosphate was determined by elemental analysis.
Infrared spectroscopy
The samples were prepared by pressing fibers of cellulose acetate, Cel/ZrO2 and Cel/ZrO2/phosphate mixed with KBr (the percentage of cellulose-based materials was 1%). The spectra of the solids were obtained in a Bomem MB-Series spectrophotometer with 5 cm-1 resolution and
32 cumulative scans.
Micrographs
a secondary electron detector and X-ray energy dispersive spectrometer (EDS) from Northern.
CPMAS 31P NMR
The CPMAS 31P NMR spectrum of the sample was
obtained at room temperature on a Bruker ACP300 spectrometer operating at 121 MHz. A sequencial pulse with contact time of 1 ms, 2s intervals between pulses and acquisition times of 11 ms was used. The chemical shift was referenced to the 85% phosphoric acid signal.
X-ray photoelectron spectroscopy (XPS)
The X-ray photoelectron spectra of the samples were obtained by using Kα radiation of an aluminum anode (Al Kα = 1486.6 eV) as the excitation source. The pressure in the analyzer chamber was 2x10⁻⁷ mPa. The experimental
lines were fitted to gaussians and the binding energies referenced to C1s hydrocarbon at 284.6 eV.24 The atomic
ratios were obtained by integrating the areas under the peaks, corrected for the analyzer transmission, the Scofield’s cross section and the electron mean free paths were taken as a function of the kinetic energy.25
Ion exchange isotherms
The ion exchange reaction isotherms of Cel/ZrO2/ phosphate with Li+, Na+ and K+ were obtained at 298 K by
using the batch technique. About 0.1 g of the samples were immersed into 25 mL of MCl (M = Li+, Na+ and K+)
solutions, whose concentrations were varied between 10-2
and 10-3 mol L-1, and the mixtures were shaken for 8 h.
The concentrations of the alkaline metal ions in the supernatant solution were determined by using a flame photometric technique (Na+ and K+) with a Micronal Flame
Photometer apparatus or ICP (Li+) with a Perkin Elmer
3000 DV inductively coupled plasma optical emission spectrometer apparatus. The quantities of the exchanged metals were determined by applying equation 1.
Alkaline metal retention experiments
Columns with 30 mm length and 5 mm internal diameter were filled with about 0.5 g of the material and connected on-line with a peristaltic pump. Aqueous solutions containing KCl (4.02 mg L-1), NaCl (2.41 mg L-1)
and LiCl (0.700 mg L-1), respectively, were passed through
the columns with a flow rate of 0.50 mL min-1. The columns
were initially washed with aqueous solution and alkaline metals were analyzed in the effluent. The retained metal
ions were eluted from the column with 1.0 x 10⁻² mol L-1
aqueous HCl solution. The Na+ and K+ ions were
determined by using a flame photometry technique and Li+ by the ICP technique.
Equilibrium constants
In order to have more information on the ion exchange process on the material surface, the constants of the ion exchange equilibria were determined. For the ideal ion exchange model, the equilibrium reaction can be represented by the following equation:
M
–
+ + H+D M+ + H–
+ K (2)where the bars mean the ions in the solid phase, and K is the equilibrium constant. It must be pointed out that this model failed to approximate the experimental data within the limits of their errors. Hence, it was replaced by a more complex one, namely, a model of polyfunctional ion exchange centers that takes into account strong cooperative interactions.26,27 Both the reasons to prefer this
model and the criteria of model adequacy are discussed in detail elsewhere.28 In this model, the surface of the sorbent
is considered as the assemblage of the polydentate exchange centers, for instance:
where the overall constants are defined as βn= Πn
i=1 Ki, and n
is the number of the stepwise constants. For each ion, the overall constants βk were calculated by the non-linear squares method by using the program CLINP 2.129 through
the minimization criterion
∑
= n k 2k
2
exp w ∆
χ (3)
where ∆ = [M+ sln]
calcd – [M+ sln]
exp, k is the number of the
experimental points and wk is the statistical weight assigned as 1/{[M+
sln] exp×σ
k }
2 with σ
k as the relative
random error of the kth measurement. O2PO2H
O2PO2M
O2PO2H
O2PO2H O2PO2H
O2PO2H
O2PO2H
O2PO2M
O2PO2M
O2PO2M
O2PO2M
O2PO2M + + + + + + M+ M+ M+
O2PO2H
O2PO2H
O2PO2H
O2PO2M
O2PO2M
O2PO2M
53 The Ion Exchange Properties and Equilibrium Constants of Li, Na and K
Vol. 15, No. 1, 2004
Results and Discussion
Characteristics of the material
The content of ZrO2, determined by firing the solid at high temperature, was 11 wt% (1.0 mmol g-1) of the oxide
dispersed on the cellulose acetate surface.
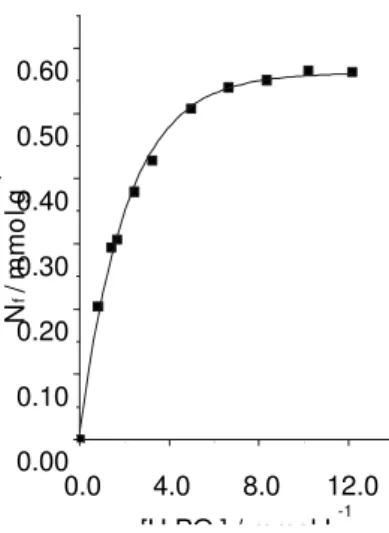
The content of phosphate incorporated on the Cel/ZrO2 surface was determined from the phosphoric acid adsorption isotherm at 298 K (Figure 1). At the limit of saturation of the surface, the maximum adsorption capacity is 0.60 mmol g-1. In such conditions, it was assumed that
all the ZrO2 particles dispersed on the cellulose acetate surface reacted with phosphoric acid according to the reaction equation:
2Cel/ZrOH + H3PO4→ (Cel/ZrO2)2PO2H + 2H2O (4)
where ZrOH stands for the hydroxyl groups of the oxide attached to the cellulose acetate surface.
To determine the quantity of ionized hydrogen, the amount of adsorbed ammonia gas was determined and the value 0.6 mmol g-1 was obtained. The mol ratio P/N = 1.0
indicates that NH3 gas interaction with the solid phase proceeds according to the reaction:
(Cel/ZrO2)PO2H + NH3→ (Cel/ZrO2)PO2-NH 4
+ (5)
31P NMR spectrum of Cel/ZrO
2/phosphate showed that
the species adsorbed is mainly hydrogen phosphate. The spectrum showed peaks at -12.6 and -19.9 ppm, corresponding to H2PO4- and HPO
4
-, respectively.30-33
Infrared spectroscopy
Figure 2 shows the FT-IR spectra of the samples. The strong band at 1750 cm-1 is assigned to the C=O stretching
mode of the acetate group. All spectra are very similar, except for a band of weak intensity observed at 1560 cm-1
in Figure 2b. This band has been assigned as due to the C=O⋅⋅⋅Zr interactions of the free cellulose acetate carbonyl group.6,34-38 This band is not observed in Figure 2c as a
result of zirconium hydrogen phosphate formation, i.e.,
formation of Zr-O-P bond.
Dispersion of the particles
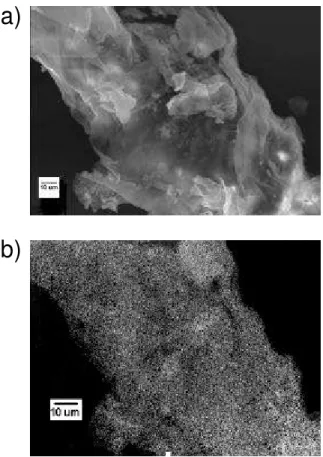
In order to check how the particles were dispersed in the matrix, micrographs for Cel/ZrO2/phosphate were obtained. Figure 3a shows the SEM and 3b the corresponding EDS image. The white points shown in Figure 3b have an emission line at 2.05 keV, corresponding to Zr and P atoms.39 It is very clear that the zirconium
phosphate particles are highly dispersed on the cellulose fibers with no detectable agglomeration into large particles (formation of islands) of a size detectable with the magnification used (1000x).
X-ray photoelectron spectroscopy (XPS)
Table 1 lists the corresponding binding energy (BE) values which are compared with corresponding ones observed for the free species. The O1s BE peak at 532.6 eV (designated as O(i)1s) is due to the cellulose oxygen atom.
4000 3200 2400 1600 800
5 %
(c)
(a)
(b)
wave number / cm-1
Figure 2. Infrared spectra of: (a) pure cellulose acetate, (b) Cel/ZrO2 and (c) Cel/ZrO2/Phosphate.
0.0 4.0 8.0 12.0
0.00 0.10 0.20 0.30 0.40 0.50 0.60
N
f
/m
m
o
lg
-1
[H PO ] / mmol L-1
For Cel/ZrO2 this peak is split because the oxygen bonded to the Zr atom is observed at 530.5 eV (designated as O(ii)1s). For Cel/ZrO2/phosphate the O1s BE peaks of oxygen bonded to Zr or P atoms are coincident and are observed at 530.6 eV. The Zr3d5/2 BE value for Cel/ZrO2 is observed at 182.5 eV, and for the ZrO2 phase at 182.2 eV.40 Upon reaction
with phosphoric acid, this is shifted to 183.0 eV. The increase of the Zr3d5/2 BE of Cel/ZrO2 upon reaction with
phosphoric acid is related with a stronger polarization of the Zr-O bond in Cel/ZrO2/phosphate, due to the coordination of the phosphate anion with the zirconium ion.41 Finally, comparing the P2s BE of Cel/ZrO
2/
phosphate, 191.3 eV, with those of Na3PO4, 190.5 eV, Na2HPO4, 191.2 eV and NaH2PO4, 192.3 eV,42 the XPS
technique also confirms that HPO42- is the species present
on the surface.
Ion exchange reactions and equilibrium constants
From the ion exchange isotherms for the Li+, Na+ and K+
ions (Figure 4), the exchange capacities were determined under limit of saturation conditions. Cel/ZrO2/phosphate appears to be a promising ion exchange material with a good ion exchange capacity and fast kinetic process. The values obtained were (in mmol g-1) as follows: Li+= 0.05,
Table 1. Binding energies (eV) for Cel/ZrO2 and Cel/ZrO2/phosphate
samples C 1s O 1s Zr 3d3/2 Zr 3d5/2 P 2s P 2p
1 2 3 1 2
Cellulose acetate 288.7a 286.3 284.6 532.6
(2.1)b (2.1) (2.1) (2.6)
[21]c [38] [41]
Cel/ZrO2 288.5 286.2 284.6 532.5 530.5
(2.1) (2.1) (2.1) (2.3) (2.1)
[20] [36] [44] [76] [24] 182.5
Cel/ZrO2/Phosphate 288.6 286.3 284.6 532.6 530.6 183.0 191.3 133.8
(2.1) (2.1) (2.1) (2.1) (2.1) (2.2) (2.1) (2.4)
[18] [33] [49] [62] [38]
ZrO2(1) 530.9 182.2
α-Zr(HPO4).H2O (2) 533.4 187.8 185.5 193.4 136.4
γ-Zr(HPO4)2.2H2O (2) 532.7 187.3 185.0 193.0 136.0
Zr(HPO4)2 Amorfo (2) 533.4 188.1 185.9 193.8 136.8
a Reference of binding energy (C-H, C-CH); bHalf-maximum of the peaks, ( ); cRelative area, [ ].
0.0 2.5 5.0 7.5 10.0
0.00 0.10 0.20 0.30 0.40 0.50 0.60
N f
/
m
m
o
lg
-1
C / mmol L-1
Figure 4. Ion exchange isotherms of: (¢) Li+, (˜) Na+ and (p) K+ on Cel/ZrO2/Phosphate from an aqueous solution at 298 K.
a)
b)
55 The Ion Exchange Properties and Equilibrium Constants of Li, Na and K
Vol. 15, No. 1, 2004
Na+= 0.38and K+= 0.57. The ion exchange capacity for the
Li+ ions is negligible compared to Na+ and K+ ions. For K+,
the exchange capacity is the same as the amount of ammonia gas adsorbed by the matrix, indicating that there is no restriction for this ion to diffuse at the solid-solution interface. The equilibrium constants for all ions were determined with the aid of the model of fixed tridentate system centers. The results of calculations are presented in Table 2.
The best fitting was achieved for the model of tridentate ion exchange centers (n=3). The calculations show that for both, Na+ and K+ ions and the ion exchange constants β
3 are
very close while they are much higher than that calculated for Li+. Using the calculated exchange capacities and
equilibrium constants it is possible to estimate the potential of this material to be employed for separating Li+ from Na+
and K+. The separation factors were estimated as
SB/A= B0 0A /Q Q
/Q
Q (6)
where Q0 B and Q
0
A are the initial quantities of species A and
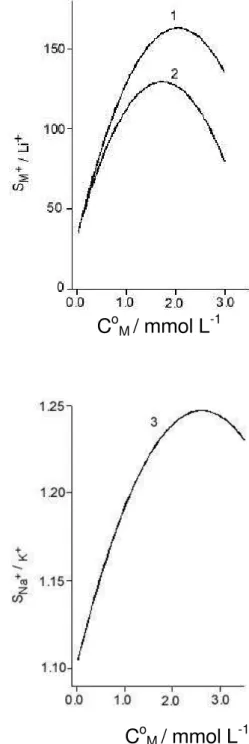
B in aqueous solution (mol) and QA and QB refer to the quantities retained by the material under the equilibrium conditions. Figure 5 presents a plot of separation factors calculated for different initial concentration of the metal ions against C0
M.
According to the calculations performed for the metals that are initially present in solution at equal concentrations (from 2x10⁻⁵ up to 3x10⁻³ mol L-1) and the mass of the
sorbent 0.1 g immersed in 50 mL, the separation factors SNa+
/Li+ and S K+
/Li+ maximized at 150 (Figure 5). This shows
the possibility of separating Li+ from Na+ and K+, while
the separation of Na+ from K+ seems to be impossible. In
fact, passing a solution containing a mixture of Li+, Na+
and K+, each with concentration of 1.00x10⁻⁴ mol L-1,
through a column filled with 0.5 g of (Cel/ZrO2)2PO2H has shown that Na+ and K+ were completely retained in the
column while Li+ was not kept at all. Table 3 summarizes
the results obtained.
Table 2. Equilibrium constants for Li+, Na+ and K+ ion exchange on the Cel/ZrO2/phosphate surface
Ions log β3 (standard deviation)
a χ2
exp f/χ 2 f (5%)b
Na+ -0.82 (0.05) 3.8 7/14.1
K+ -1.00 (0.11) 14.0 7/14.1
Li+ -2.49 (0.09) 3.5 8/15.5
aThe equilibrium constants β
1 and β2 are very small because the ion exchange on one tridentate center involves three ions concurrently and the intermediate products are not formed; b f/χ2f (5%) is the 5% point of the chi-square distribution with f degrees of freedom.
Table 3. Retention of the metal ions from a mixture by a column filled with Cel/ZrO2/phosphate
Ionsa Eluted (mmol) Retainedb (%)
Li+ 1.00±0.01 0.0
Na+ 1.00±0.01 100.0
K+ 1.00±0.01 100.0
aindividual concentration 1.00x10⁻⁴ mol L-1; btriplicate determina-tions.
C
oM/ mmol L
-1C
oM/ mmol L
-1Figure 5. Plots of separation factors SK+/Li+ (1), SNa+/Li+ (2) and SNa+/K+ (3) as a function of the initial concentration of metal ions in solu-tions (C0
The high values of the separation factors SNa+ /Li+ and
SK+
/Li+ support the quantitative separation of Na+ and K+
from Li+ from a mixture containing these three ions. It is
known that if a cation exchanger is placed in an aqueous solution of two cations, i.e. A+ and B+, the preference of
the exchanger for ion A+ or B+ depends on their electrostatic
energies of interaction with the fixed anionic exchange sites. In the present case, as the hydration enthalpies (in kJ mol-1) of the individual ions are Li+= -532, Na+= -423 and
K+= -33843 and the hydrated ions sizes are (in pm) Li+ = 47,
Na+= 36 and K+= 2444, the electrostatic interaction with
the fixed anion is expected to be considerably reduced for Li+ in comparison with Na+ and K+.
Conclusions
The isotherms for the H+/Na+ and H+/K+ ion exchange
show the non ideal nature of the exchange for these ions. The features of the systems studied were taken into account by applying a model of tridentate centers that considers the surface of the sorbent as an assemblage of polyfunctional sorption centers. For each such center the ion exchange process for Na+ and K+ is not of a stepwise
character, pointing to strong cooperative interactions between the attached phosphate groups. Both the observed ion exchange capacities, with respect to the alkaline metal ions, and the equilibrium constants may be interpreted by taking into consideration the sequence of the ionic hydration radii for Li+, Na+ and K+.
Acknowledgements
Y. G. is indebted to FAPESP and FINEP-PRONEX for financial support. C. A. B. and A. M. L. are also indebted to CNPq and FAPESP for fellowships. The authors wish to acknowledge Prof. Carol H. Collins for manuscript revision
References
1. Gushikem, Y.; Toledo, E. A. In Polymer Interfaces and Emul-sions; Esumi, K., ed.; M. Dekker: New York, 1999, ch. 13, p.
509.
2. Shojaie, S. S.; Rials, T. G.; Kelley, S. S.; J. Appl. Polym. Sci.
1995, 58, 1263.
3. Silva, L. R. D.; Rodrigues-Filho, U. P.; Peixoto, C. R. M.; Gushikem, Y.; Quim. Nova1995,18, 337.
4. Okamoto, Y.; Kawashima, M.; Yamamoto, K.; Hatada, K.;
Chem. Lett. 1984,739.
5. Kurokawa, Y.; Sano, T.; Ohta, H.; Nakagawa, Y.; Biotechnol. Bioeng.1993, 42, 394.
6. Kurokawa, Y.; Ohta, H.; Okubo, M.; Takahashi, M.; Carb. Polym. 1994,23,1.
7. Kurokawa, Y.; Polym. Gels Networks 1996, 4, 153. 8. Kurokawa, Y.; Membr. Sci. 1996,114, 1.
9. Kurokawa, Y.; Ueno, Y.; J. Appl. Polym. Sci. 1982,27, 621. 10. Wara, N. M.; Francis, L. F.; Velamakanni, B. V.; J. Membr. Sci.
1995, 104, 43.
11. Silva, L. R. D.; Peixoto, C. R. M.; Gushikem, Y.; Kubota, L. T.;
Colloids Surf. B. Biointerfaces1996, 6, 309.
12. Silva, L. R. D.; Peixoto, C. R. M.; Gushikem, Y.; Sep. Sci. Technol. 1996,31,1045.
13. Alfaya, R. V. S.; Gushikem, Y.; J. Colloid Interface Sci. 1999,
213, 438.
14. Lazarin, A. M.; Gushikem, Y.; Castro, S. C.; J. Mater. Chem.
2000,10, 2526.
15. Borgo, C. A.; Gushikem, Y.; J. Colloid Interface Sci. 2002,
243, 343.
16. Borgo, C. A.; Lazarin, A. M.; Gushikem, Y.; Sensor Actuat B-Chem. 2002, 87, 498.
17. Gushikem, Y.; Campos, E. A.; J. Braz. Chem. Soc.1998,9,
273.
18. Sourirajan, S.; Matsura, T.; Reverse Osmosis and Ultrafiltra-tion, American Chemical Society: Washington, DC, 1985.
19. Clearfield A.; Inorganic Ion Exchange Materials, CRC Press, Inc.: Boca Raton, FL, 1982.
20. Ferragina, C.; Massuci, M. A.; Tomilson, A. A. G.; J. Chem. Soc., Dalton Trans.1990, 1191.
21. Bortun A.I.; Garcia J.R.; Budovitskaya, T.A.; Strelko V.V.; Rodrigues, J.; Mater. Res. Bulletin1996, 31, 487
22. Clearfiel A.; Chem. Rev. 1988, 88, 125
23. Lazarin, A. M.; Landers, R.; Gushikem, Y.; Kholin, Y. V.; J. Colloid Interface Sci.2003, 477, 305.
24. Dilkis, A. In Developments in Polymer Characterization; Dawkins, J.V., ed., Applied Science: London, 1980, vol. 12, p. 145.
25. Scofield, J. H.; J. Electron Spectrosc. Relat. Phenom. 1976, 8, 129.
26. Belinskaya, F. A. In Physical Chemisty; Likalsky., B. P. , ed.; Khimiya: Leningrad, 1987, ch. 11, p. 666.
27. Kokotov, Yu. A.; Zolotarev, P. P; Elkin, G. E. In Theoretical Foundations of Ion Exchange: Complicated Ion Exchange
Systems; Likalsky, B. P., ed., Khimiya: Leningrad, 1986.
28. Lazarin, A. M.; Borgo, C. A.; Kholin, Yu. V.; Gushikem, Y.;
Anal. Chim. Acta 2003, 477, 305.
29. Bugaevsky, A. A.; Kholin, Yu. V.; Anal. Chim. Acta 1991, 241,
353.
30. Segawa. K.; Nakajima, Y.; Nakata, S.; Asaoka, S.; Takahashi, H.; J. Catal. 1986, 101, 81.
31. Hudson, M. J.; Workman, A. D.; J. Mater. Chem. 1991, 1, 375. 32. Hudson, M. J.; Workman, A. D.; Adams, R. J. W.; Solid State
Ionics 1991, 46, 159.
33. Rodrigues-Filho, U. P.; Gushikem, Y.; Gonçalves, M. C.; Cachichi, R. C.; Chem. Mater. 1996, 8, 1375.
57 The Ion Exchange Properties and Equilibrium Constants of Li, Na and K
Vol. 15, No. 1, 2004
35. Noonan, G. O.; Ledford, J. S.; Chem. Mater. 1995, 7, 1117. 36. Ilharco, L. M.; Barros, R. B.; Langmuir 2000, 16, 9331. 37. Brenier, R.; Gagnaire, A.; Thin Solid Films 2001, 392, 142. 38. Guilment, J.; Poncelet, O.; Rigola, J.; Truchet, S.; Vibr. Spectr.
1996, 11, 37.
39. Robinson, J. W.; Handbook of Spectroscopy, CRC Press: Cleve-land, 1974, vol.1.
40. Colon, J. L.; Thakur, D. S.; Yang, C.; Clearfield, A.; Martin, C. R.; J. Catal. 1990, 124, 148.
41. Alberti, G. G.; Constantino, U.; Marletta, G.; Puglisi, O.; Pignataro, S.; J. Inorg. Nucl. Chem. 1981, 43, 3329.
42. Chastain, J., ed.; Handbook of X-Ray Photoelectron Spectros-copy, Perkin Elmer: Minneapolis, 1992.
43. Conway, B. E.; Ionic Hydration in Chemistry and Biophysics, Elsevier: Amsterdam, 1981, p. 257.
44. Clearfield, A.; Blessing, R. H.; Stynes, J. S.; J. Inorg. Nucl. Chem. 1968, 30, 2249.
Received: February 24, 2003
Published on the web: November 28, 2003