0103 - 5053 $6.00+0.00
A
r
ti
c
le
* e-mail: [email protected] # Present address: Reichhold do Brasil Ltda.
Surfactant and Counter-Ion Distribution in Styrene-Butyl Acrylate-Acrylic Acid Dry Latex
Submonolayers
Amauri José Keslarek#, Carlos Alberto P. Leite and Fernando Galembeck*
Instituto de Química, Universidade Estadual de Campinas, CP 6154, 13083-970 Campinas - SP, Brazil
Submonocamadas de látex estireno-acrílico preparado usando um tensoativo sulfonato reativo e um tensoativo fosfato não-reativo foram examinadas em um microscópio de transmissão equipado com um espectrômetro de perda de energia de elétrons, para a aquisição de mapas de distribuição elementar. P está ausente do centro das partículas mas é encontrado em uma casca espessa, no fundo da imagem e em estruturas incomuns com um baixo teor de carbono, enquanto S está uniformemente distribuído nas partículas. Os mapas elementares de Na e N mostram que os respectivos cátions (Na+, NH
4
+) têm diferentes distribuições: o sinal de Na é mais intenso nas partículas do que no
fundo, enquanto N se acumula nas bordas das partículas. As distribuições de tensoativos e contra-íons são portanto diferentes de algumas suposições correntes, mas elas estão de acordo com resultados recentes sobre a distribuição de constituintes iônicos em látex, obtidas por microscopia de varredura de potencial elétrico.
Styrene-butyl acrylate-acrylic acid latex submonolayers prepared using a non-reactive phosphate surfactant together with a reactive sulfonate surfactant were examined in a transmission microscope using electron energy loss spectroscopy imaging (ESI-TEM). Phosphorus is nearly absent from the particles core but it is detected in a thick shell and in unusual, strongly scattering structures with a low carbon content, and largely made out of inorganic phosphate. P is also dispersed outside the particles, while S is uniformly distributed within then. The Na and N elemental maps show that the respective monovalent ions (Na+ and NH
4
+) have different distributions, in the latex: Na signal within the
particles is stronger than in the background, while N is accumulated at the particle borders. The distributions of surfactant and counter-ions are thus different from some current assumptions, but they support recent results on the distribution of ionic constituents in latex films, by scanning electric potential microscopy.
Keywords: ESI-TEM, latex film, surfactant migration, polymer surface, elemental maps
Introduction
The recent applications of electron energy loss spectroscopy imaging techniques to transmission electron microscopy (ESI-TEM)1 are providing new information
on the composition of polymer surfaces.2 Elemental
distribution maps from polystyrene latex particles collected during ab-initio batch and semi-continuous emulsion polymerization revealed that sulfur is uniformly distributed within the particles in both cases, contradicting the usual belief that sulfate polar groups are clustered at the particle surfaces.3 Du Chesne and co-workers4 mapped
sulfur distribution in thin cuts of latex films produced with a sulfate surfactant. They established that the surfactant
segregation to the polymer film surface occurs only if the film is dried at temperatures above the minimum temperature formation (MFFT), and below MFFT the surfactant is retained within the film.
Electric potential gradients within latex films have been demonstrated by using scanning electric potential microscopy (SEPM),5 and the first electric potential
distribution maps of polymer films and particles were published recently.6,7 Transparent films (visible light
transmittance>99%), formed by drying a low-Tg styrene-butyl acrylate-acrylic acid latex often used in paint making, still contain electrically positive boundaries between particles, producing large local electric potential gradients. Aging, annealing and exposure of these films to organic solvent vapors modify the electric domain patterns in the film, evidencing charge clustering and migration.8 Charge
particle interface double-layers, but it probably makes an important contribution to the overall latex film properties. To understand the nature of particle clusters we have to identify the charge-bearing groups. This is possible by using energy-loss spectra and elemental maps acquired by ESI-TEM, since these can detect the elements forming ions in latex, with great sensitivity: sulfur from sulfonate or sulfate, phosphorus from phosphate, sodium, potassium and ammonium counter-ions, and others.
This work presents elemental distribution maps for particle submonolayers of the above-mentioned styrene-butyl acrylate-acrylic acid latex, acquired by ESI-TEM. This latex was chosen for two reasons: its monomer composition is widely used in paints, and the electric potential maps of films made with it are known.8
Experimental
Latex synthesis
The method and reagents used for preparing the latex and for cleaning up the dispersion were described in a previous paper.8 Shortly, the latex was prepared by
semi-continuous emulsion polymerization. Initial aliquots of water and surfactants were added to the reactor and heated to 60 oC under agitation. A pre-emulsion (that is, emulsified
water, monomers and surfactants) was continuously added to the reactor for 5 h, simultaneously to the aqueous solutions of ascorbic acid and tert-butyl hydroperoxide (redox initiator). The final dispersion was cooled down, neutralized with ammonia to pH 8 and filtered through a 105 µm sieve. Two different surfactants were used during
the polymerization: a sulfonate reactive surfactant (Rhodia Sipomer COPS-I) and a non-reactive sodium poly(oxyethylene) phenyl ether phosphate (Rhodafac RE-610, abbreviated as POE in this paper). Prior to sample preparation for ESI-TEM experiments the latex underwent extensive dialysis, to remove low-molecular weight and ionic species. However, this removal is always limited by the requirements of electroneutrality and Donnan effect.
The effective diameters of the latex particles (original and dialyzed) were determined by using photon correlation spectroscopy (PCS), in a ZetaPlus (Brookhaven Inst. Corp.) at 25 oC. The dispersion was diluted to 10-4 volume fraction
prior to the analysis.
Dry film Tg was determined by DSC. Analyzes were made in a TA 2000 (TA Instruments), within the –80 to 120 oC
temperature range under a 10 oC min-1 heating rate. Sample
weight was approximately 10 mg and the transition temperature was determined from the second run, in order to decrease the influence of film drying and handling stresses.
Sample preparation
Particle submonolayers (this means, incomplete particle monolayers) used for ESI-TEM experiments were prepared by drying a droplet of a 10-4 volume fraction
dialyzed dispersion on top of the parlodion-carbon film used in the TEM sample holder. Sub-monolayers were chosen for experimental convenience, since single particle thickness is suitable for analytical electron spectroscopy imaging and the effects of particle superimposition are completely avoided, using sub-monolayers. On the other hand, they are easily prepared on top of the thin parlodion-carbon films, just by using well-defined volumes of dispersions of known particle concentration. The samples were dried for at least 24 h, at room temperature over 400 mesh copper grids (Ted Pella) coated with carbon-parlodion films.9
The elemental distribution of the latex particle submonolayer was observed using a 80 keV Carl Zeiss CEM 902 transmission electron microscope, equipped with a Castaing-Henry-Ottensmeyer energy filter spectrometer within the column. The images were acquired by a Slow Scan CCD camera (Proscan), and digitalized (1024x1024x8bits) by an image process software analysis (Soft Imaging System), running in a PC computer.
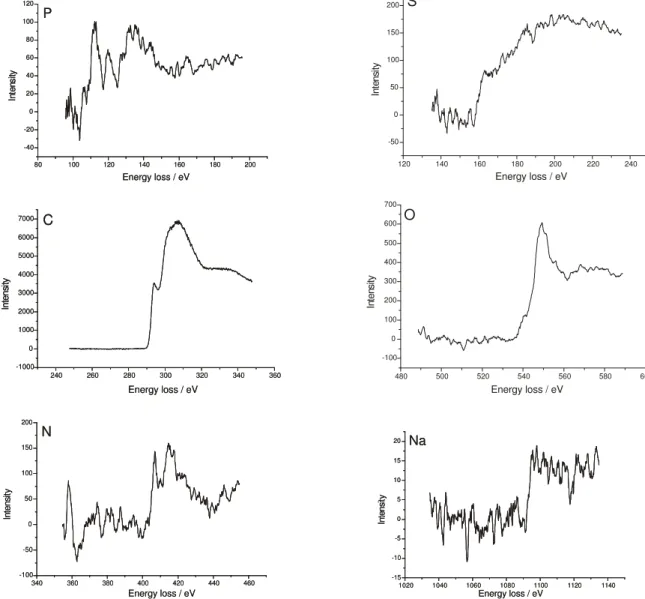
Relevant elemental images present in the latex were obtained using monochromatic electrons with energies corresponding to the K-edge of carbon, nitrogen, sodium and oxygen and the L-edge of the sulfur and phosphorus. The energy-selecting slit was set at 303 eV for C, 410 eV for N, 1090 eV for Na, 544 eV for O, 200 eV for S, and 153 eV for P, with a 15 eV slit width.10,11 The choice of the
allowing a good background fitting. In the case of phosphorus, there is a silicon peak near 103 eV and too close to the 153 eV P slit, which distorts the background fitting. The alternative is to use the three-window white line method, positioning two windows below and after the edge onset to record the background, and a third window at the edge. The elemental map is calculated by subtracting the interpolated background from the edge onset image.
Results
The latex dispersion has 48.2 % weight solids content, as determined by gravimetry following drying at 105 oC
to constant weight. The effective diameter of the as-prepared latex was 228±3 nm, changing to 240±4 nm in the dialyzed latex. Tg of the dry film cast from the as-prepared latex (stored for three months after sample preparation) was 15.9 oC, changing to 16.4 oC in the
dialyzed latex (determined by DSC).
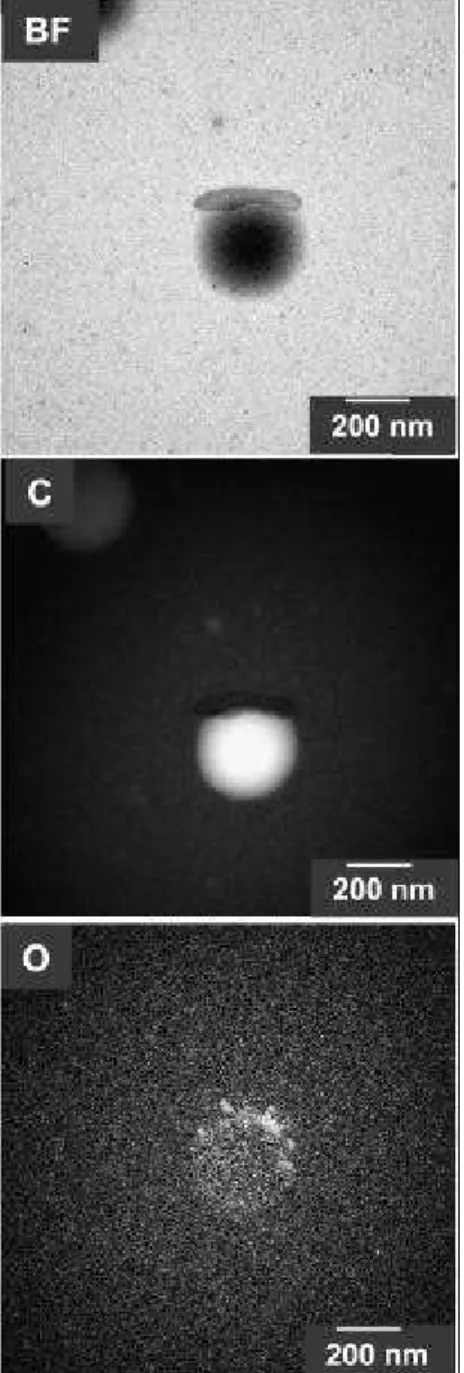
Many different images were acquired from sub-monolayers of latex particles, and representative figures are shown in Figures 1 and 3-8. Figure 1 shows a bright-field picture and an energy-loss (20 eV) dark-bright-field image from a few isolated latex particles. From the bright-field image, we conclude that the latex particles are flattened on top of the supporting film, since their apparent diameter is ca. 350 nm while the particle effective diameter (determined by PCS within an aqueous dispersion) is 240 nm only. Particle flattening is understood considering that these particles are from a low-Tg polymer and that the polymer wets the supporting carbon film. A simple geometric calculation based on volume identity between a sphere with 240 nm diameter and a cylinder with 350 nm diameter reveals that the particle average thickness is 68 nm. This is suitable for electron imaging since the 80 keV electron mean free paths for elastic and inelastic scattering within an hydrocarbon compound are respectively 160 nm12 and some hundreds of nanometers.13
Particle flattening has to be considered, during the examination of the micrographs given ahead. Elemental distribution maps should also be examined side by side with the corresponding bright-field pictures, because these convey information on the relative thicknesses of adjacent areas in the field under examination. The distribution of a particle constituent can be assessed by considering a few extreme cases, as follows. When the mapped element is uniformly distributed in the particle bulk, then the particle brightness profile should parallel the (inverted) bright-field image profile. On the other hand, if the mapped element is accumulated at the particle surface, the elemental map will display bright rings around the particles. Moreover, the
accumulation of an element in islands or phase-separated domains is evidenced by bright spots superimposed to the particles, in the elemental maps.
A few unusual and dense particles are also seen in Figure 1, either at the latex particle borders or scattered in the background. The nature of the various morphological features observed in Figure 1 was elucidated with the help of elemental distribution maps.
Energy-loss elemental mapping is a powerful technique but some imaging artifacts may affect the results. To prevent this, electron energy loss spectra were acquired and used as an evidence for the presence of each element under consideration. These spectra guided the positioning of the window slit, for elemental distribution map acquisition. Spectra in the energy regions corresponding to C, S, P, N, O and Na absorptions are shown in Figure 2. Their quality is highly variable, depending essentially on the amount of the given element in the sample: C spectrum has a large signal/noise ratio, as expected considering that this is the predominating element in the latex. O, N and Na spectra have lower signal/noise ratios, but the energy threshold for the spectral transition is sufficiently definite for the use of the three-window exponential imaging technique, in all these cases. P spectrum is more complex,
requiring the use of the three-window white-line technique, as already mentioned in the Experimental section.
Figure 3 shows P and S elemental distribution maps for the same field shown in Figure 1. From these pictures, we observe that S is dispersed throughout the latex particles. On the other hand, P is predominantly found outside the particles, either spread in the background or accumulated around some of the denser particles seen in the bright-field image in Figure 1. Particle brightness in the S map increases from the particles surface to the bulk, as expected considering that the sulfonate groups are evenly incorporated to the polymer chains. However, the S-bearing groups are not smoothly distributed, but rather they are accumulated in definite spots, thus evidencing a micro-phase separation within the particles bulk or at the particle surfaces, with sulfonate-rich domains dispersed in a polymer matrix. Beyond the background and the denser
particles, phosphate is perceived closer to the rim of the (particle) discs in the P map. These are thus sites for P accumulation together with N and O (see ahead). In these flattened particles, phosphate accumulation at the particle surfaces would produce a rather even brightness across the particle discs, but increasing at their borders; this is not seen, thus excluding extensive accumulation at the surfaces. Phosphate exclusion from the particles bulk may seem trivial, since the phosphate surfactant is not reactively incorporated to the polymer chains. However, the following points should be considered, to understand these results. First, P maps do not allow a distinction between unhydrolyzed phosphate surfactant, orthophosphate ions or other P species formed by hydrolysis. On the other hand, S maps are only dependent on the sulfonate surfactant distribution, since this is resistant to hydrolysis. Second, previous work using latex prepared with non-reactive
120 140 160 180 200 220 240 -50 0 50 100 150 200
Energy loss / eV S In te n si ty
480 500 520 540 560 580 600 -100 0 100 200 300 400 500 600 700 O In te ns ity
Energy loss / eV
80 100 120 140 160 180 200 -40 -20 0 20 40 60 80 100 120 P In te ns ity
Energy loss / eV
80 100 120 140 160 180 200 -40 -20 0 20 40 60 80 100 120 P In te ns ity
Energy loss / eV
240 260 280 300 320 340 360 -1000 0 1000 2000 3000 4000 5000 6000 7000 C
Energy loss / eV
In
te
n
si
ty
240 260 280 300 320 340 360 -1000 0 1000 2000 3000 4000 5000 6000 7000 C
Energy loss / eV
In
te
n
si
ty
340 360 380 400 420 440 460 -100 -50 0 50 100 150 200
Energy loss / eV
N In te n si ty
340 360 380 400 420 440 460 -100 -50 0 50 100 150 200
Energy loss / eV
N In te n si ty
1020 1040 1060 1080 1100 1120 1140 -15 -10 -5 0 5 10 15 20
Energy loss / eV
Na In te n si ty
1020 1040 1060 1080 1100 1120 1140 -15 -10 -5 0 5 10 15 20
Energy loss / eV
Na In te n si ty
sulfate surfactants showed sulfate dispersed within the particles, without any evidence for sulfate segregation to the surface, in the dry particles.3,6 Third, the phosphate
groups at the particle surfaces are strongly accumulated at some points, instead of being distributed over the surface, as it would be expected following an usual surfactant adsorption model. Finally, the sulfonate groups are also found in the P-rich domains but only at their rims, in a clear evidence of the mutual exclusion of sulfonate and phosphate groups.
Many attempts were made to obtain bright-field images and multi-element (C, N, Na, O) maps from the same sets of particles, as we presented in previous publications.3,5,7,9
However, the present particles did not resist beam damage, during the long required beam exposures. For this reason, Figures 4-6 show bright-field images together with only one or two elemental maps each.
The following observations are made therefrom: i) as expected, C (shown in Figure 4) predominates within the latex particles, and it is mostly absent from the denser smaller particles as well as from the interior of the unusual particles seen at the latex particle borders. However, a thin brighter line surrounds these particles in the C map,
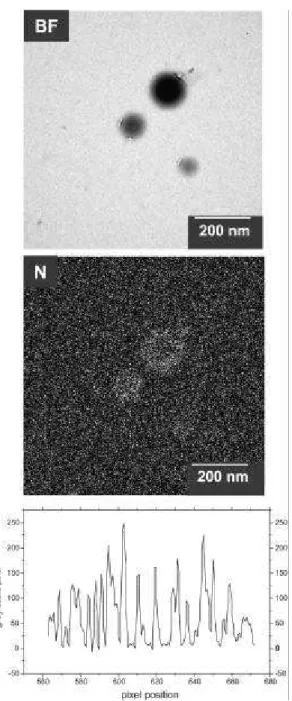
showing that they are coated by surfactant. Considering the S and P maps, both types of surfactants surround these particles; ii) O is found around the latex particles but also within them, and in the background. Opposite to the C signal, the O signal is more intense in the particle disc rims, probably due to the expected accumulation of acrylic monomers closer to the particle surface. It is also found in the unusual structures in the latex particle borders, but strongly concentrated in a few spots; iii) N and Na are detected in the particles as well as in the background. However, the N map shows brighter spots at the particle borders evidencing an accumulation of this element on
Figure 3. Phosphorus (P) and sulfur (S) elemental distribution maps
the particle shell (and thus together with P and O). Since the N image is very spotty (or else, pixel brightness varies sharply), N accumulation is better seen by comparing the line-scan in Figure 5 with the line-scan for sodium distribution in Figure 6, in which the moving average of the line has a maximum in the particle center.
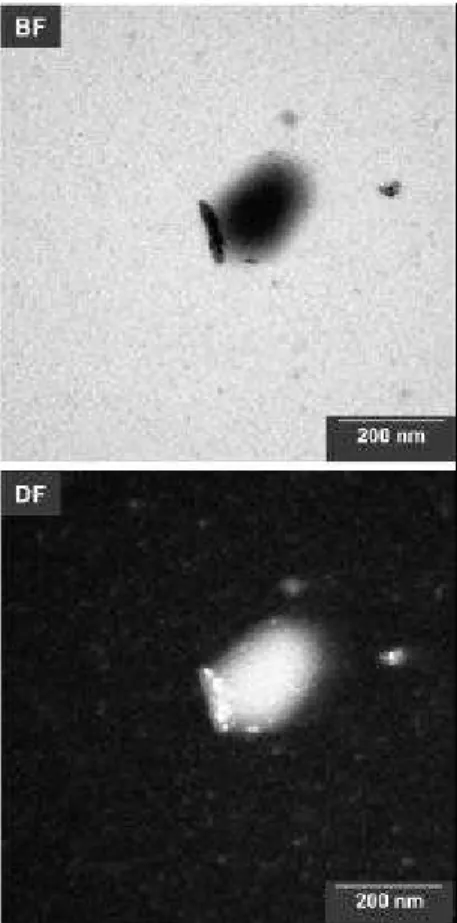
A different information comes from Figure 7, comparing the bright-field and diffractive dark-field images for the same field: the darker areas in the bright-field are not uniformly bright in the dark-bright-field, showing that these denser regions are made out of more ordered, polycrystalline material.
EELS spectra can be acquired from very small areas, and this was used to identify carbon composition changes within the latex particles, as shown in Figure 8. The two spectra from the particle centers (points 4 and 5) are indistinguishable, within the experimental error, but the spectra from particle borders (points 2 and 3) and the background (point 1) are quite different. The C absorption from the structure seen at the border (point 2) has a slightly higher intensity than the background. The spectrum on the other point (point 3) at the film border has pronounced differences with the spectra from the particle centers (points 4 and 5). Peak intensity is lower in 3 and also the
line-Figure 6. Bright-field (BF) image and sodium (Na) elemental distri-bution map. The lower plot is a line-scan made in the Na map, from top to bottom of the white line drawn across the particle.
Figure 7. Bright-field (BF) and dark-field (DF) images of a particle in a submonolayer. The dark-field image is acquired using elasti-cally scattered or diffracted electrons.
shape above 310 eV is different from all others, evidencing that the polymer in this region is different from the polymer at the particle core. This is in agreement with the expectation that the particle outer and inner layers should not have identical monomer distribution, in copolymer latex formed by two monomers of different polarity.14 On
the other hand, this supports the observation of O accumulation at the flattened particle outer layers, due to increased acrylic monomer content.
Discussion
The small Tg difference between the films formed with original and dialyzed latexes shows that the free surfactant present in the serum of the original latex does not have a significant role in polymer plastification.
Following dialysis, the particle effective diameters are 12 nm larger than in the original dispersion. This may be understood, considering that particles undergo stronger swelling at low ionic strength, and protruding chain ends (“hairs”) at the particle surface should extend longer than at higher ionic strength.15
The C, O, S and P maps help us to understand some
characteristics of the latex particles and the formed film. The high-density material often found at the particle borders is highly heterogeneous and certainly immiscible with the polymer. As compared to the particles, this material has a higher phosphorus and oxygen content, but lower carbon and sulfur content. Sulfur-rich domains are the loci for incorporation of the reactive surfactant, and they are well distributed throughout the polymer, thus confirming that the covalently bound surfactant is uniformly distributed in the polymer particles, as found by using contact angle measurements16 and atomic force microscopy
(AFM).17
On the other hand, the P atoms introduced with the non-reactive phosphate surfactant cannot be covalently bound to the polymeric chains. The P maps show that the phosphate groups are excluded from the particles center and also they are often dissociated from C groups. P accumulates in a thick particle shell and specially at the particle borders as well as in the serum, as shown by the gray background in the P elemental map. Consequently, P is partly present as inorganic phosphate with a low compatibility to the polymer surface, forming dense separated domains but still adherent to the particle borders.
220 240 260 280 300 320 340 0
In
te
n
si
ty
220 240 260 280 300 320 340 0
220 240 260 280 300 320 340 0
5 4
3
2 1
220 240 260 280 300 320 340 0
220 240 260 280 300 320 340 0
200 400 600 800 1000 1200 1400
Energy loss / eV
C
4 5
3 2
1
200 nm C
4 5
3 2
1
200 nm 200 nm
This also shows that the phosphate surfactant underwent extensive hydrolysis, during latex preparation and storage. In a previous paper,8 SEPM images revealed that particle
interfaces were observed up to 2 months after a transparent film of this styrene-butyl acrylate-acrylic acid latex was formed at room temperature. The interior of particles in the film was electrically more negative than the inter-particle borders. We can now state that these negative domains were predominantly due to sulfonate, rather than phosphate groups. In a superficial evaluation, sulfonate distribution throughout the particles could be assigned to the use of reactive surfactant. However, the same pattern has already been observed by using non-reactive surfactants.3,6 Further aging of the same sample for 3 months
produced both a new film surface topography pattern and a new distribution of electric domains, evidencing the mobility of ionic species in the film.
Due to the strict thickness requirements of energy-loss imaging, the films examined in the present work are indeed sub-monolayers, while the previous AFM and SEPM measurements were made on thicker films. Surfactant may be trapped within a drying thick film, due to the longer times required to migrate to the film surface. As Urban and Zhao have demonstrated, as part of the drying process the particles come into contact during water evaporation. The particles are deformed and the surfactant and water-soluble ionic species (including orthophosphate) present in their surfaces form aggregates within the continuous film, wherefrom they can migrate.18
Fitch and McCarvill19 has demonstrated that sulfate
compounds, present on the particle surfaces, are easily hydrolyzed. This causes a reduction in the latex stability and a pH reduction, due to the sulfuric acid formation. In the present case, we have not observed a significant pH decrease after 6 months storage, thus suggesting the absence of surfactant phosphate hydrolysis. However, the present microanalytical data shows the presence of species loaded with P but devoid of C, this means, inorganic phosphates. Consequently, the pH stability is to be assigned to the buffering capacity of phosphate ions, rather than to phosphate surfactant stability towards hydrolysis. Regarding the counter-ions maps, N is more concentrated in the film border than in its interior, and it is also found in the background and thus in the latex serum. N is introduced in the latex as the ammonia used for neutralization made at room temperature when the particles are already formed and the monomer is used up. The present results show that the ammonium counter-ions did not strongly diffuse into the particles, as opposed to Na, which is significantly accumulated within them. This difference in the behavior of the two monovalent ions suggests that
latex properties may be tuned by changing the counter-ions used. Moreover, N accumulation at the particle border is superimposed to O accumulation, suggesting that ammonium ions accumulate at the more hydrophilic particle sites, more markedly than sodium ions.
Counter-ion partitioning may have an important role in latex films properties, because charge accumulation at some spots will probably affect film cohesion, swelling, interfacial and phase separation phenomena. However, since the acknowledgement of this new factor is very recent, we still do not have sufficient data to evaluate its relevance.20
Conclusions
The distribution of sulfur and phosphorus (originated from the non-reactive POE-phosphate and the reactive sulfonate surfactants used in the latex polymerization, or their decomposition products) is completely different, in the latex particle submonolayers. Phosphate residues are nearly absent from the interior of the latex particles, they are observed in a thick particle outer ring but they are also detected as inorganic phosphate in unusual, strongly scattering structures adhering to the latex particle borders, and in the background. On the other hand, the reactive sulfonate surfactant is uniformly distributed within the polymer particles.
The Na and N elemental maps are also different, showing that the corresponding monovalent ions (Na+ and
NH4+) are partitioned independently, between the latex
and the serum, and NH4+ accumulates in the more
hydrophilic particle outer rings.
The existence of many charged species with indepen-dent distribution patterns in the latex monolayers is consistent with the rich and complex patterns of electric charge cluster formation and mobility, recently revealed by SEPM.
Acknowledgements
FG thanks Fapesp, Pronex/Finep and CNPq for continuing support. AJK held a Fapesp pre-doctoral fellow. This is a contribution from the Millenium Institute of Complex Materials/MCT.
References
1. Egerton, R. F.; Electron Energy-Loss Spectroscopy in the Elec-tron Microscope, Plenum Press: New York, 1986.
2. Du Chesne, A.; Macromol Chem. Phys. 1999, 200, 1813. 3. Amalvy, J. I.; Asua, J. M.; Leite, C. A. P.; Galembeck, F.;
4. Du Chesne, A.; Gerharz, B.; Lieser, G.; Polym. Int. 1997, 43, 187.
5. Cardoso, A. H.; Leite, C. A. P.; Galembeck, F.; Colloids Surf., A 2001, 181, 49.
6. Braga, M.; Costa, C. A. R.; Leite, C. A. P.; Galembeck, F.; J. Phys. Chem. B 2001, 105, 3005.
7. Galembeck,A.; Costa, C. A. R.; Silva, M. C. V. M.; Souza, E. F.; Galembeck, F.; Polymer 2001, 42, 4845.
8. Keslarek, A. J.; Costa, C. A. R.; Galembeck, F.; Langmuir
2001, 17, 7886.
9. Cardoso, A. H.; Leite, C. A. P.; Galembeck, F.; Langmuir 1998, 14, 3187.
10. Reimer, L.; Zepke, U.; Moesch, J.; Schulze-Hillert, St.; Ross-Messemer, M.; Probst, W.; Weimer, E.; EELS Spectroscopy: A Reference Handbook of Standard Data for Identification and
Interpretation of Electron Energy Loss Spectra and for
Gen-eration of Electron Spectroscopic Images, Carl Zeiss:
Oberkochen, 1992.
11. Reimer, L.; Mater. Trans. JIM 1998, 39, 873.
12. Newbury, D. E. In Principles of Analytical Electron Micros-copy; Joy, D. C.; Romig, A. D. Jr.; Goldstein, J. I., eds; Plenum
Press: New York, 1986, p. 8.
13. Klotz, S.; von Seggern, J.; Kunz, M.; Cantow, H-J.; Polym. Commun. 1990, 31, 332.
14. El-Aasser, M.S.; Hu R; Dimonie, V. L.; Sperling, L. H.; Colloids Surf., A 1999, 153, 241.
15. Butt, H-J.; Gerharz, B.; Langmuir 1995, 11, 4735.
16. Wang, X.; Sudol, E.D.; El-Aasser, M. S.; J. Polym. Sci. Pol. Chem. 2001, 39, 3093.
17. Lam, S.; Hellgren, A. C.; Sjoberg, M.; Holmberg, K.; Schoonbrood, H. A. S.; Unzue, M. J.; Asua, J. M.; Tauer, K.; Sherrington, D. C.; Goni, A. M.; J. Appl. Polym. Sci. 1997, 66, 187.
18. Zhao, Y.; Urban, M. W.; Macromolecules 2000, 33, 2184. 19. Fitch, R. M.; McCarvill, W. T.; J. Coll. Interf. Sci. 1978, 66,
20.
20. Galembeck, F.; Costa , C. A. R.; Galembeck, A.; Silva, M. C. V. M.; An. Acad. Bras. Cienc. 2001, 73, 495.
Received: February 12, 2003
Published on the web: January 19, 2004