Artigo
*e-mail: [email protected]
PHOTOMETRIC PROCEDURE FOR QUANTITATIVE ANALYSIS OF AFLATOXIN B1 IN PEANUTS BY THIN-LAYER CHROMATOGRAPHY USING CHARGE COUPLED DEVICE DETECTOR
Michele Hoeltz*, Juliane Elisa Welke e Isa Beatriz Noll
Instituto de Ciência e Tecnologia de Alimentos, Universidade Federal do Rio Grande do Sul, Av. Bento Gonçalves, 9500, 91570-901 Porto Alegre - RS, Brasil
Horacio Alberto Dottori
Instituto de Física, Universidade Federal do Rio Grande do Sul, Av. Bento Gonçalves, 9500, 91570-901 Porto Alegre - RS, Brasil
Recebido em 12/11/08; aceito em 1/7/09; publicado na web em 25/11/09
A photometric procedure was developed for determination of alatoxin B1 in peanuts by TLC-CCD technique. The quantiication and detection limit were 1.2 μg kg-1 and 0.4 ng per spot, respectively, with mean recovery of 98%. The CCD camera is suficiently sensitive to detect small changes in spots luorescence intensity and the results for performance conirmed the eficiency of the method. Another important property of CCD detector is its linearity for a wide range of luminous stimulus determined by analysis of ive-point calibration curves using the intensity of AFB1 luorescence versus AFB1 concentration (0.8 to 4.8 ng per spot). The method was applied to the analysis of thirty nine peanut samples and alatoxin B1 levels ranged from 16 to 115 μg kg
-1. The TLC-CCD and the photometric procedure developed in this study demonstrated to be a simple and eficient tool for quantitative analyses of AFB1 in peanut samples. Keywords: alatoxin B1; photometric procedure; TLC-CCD.
INTRODUCTION
Alatoxins B1, B2, G1 and G2 are difuranocoumarin derivatives produced by a polyketide pathway by many strains of Aspergillus lavus Link. ex Fries, A. parasiticus Speare and A. nomius Kurtzman, B.W.1 These mycotoxins have been found in different food such as corn, peanut, rice and walnut.2,3
Crops in tropical and subtropical areas are more susceptible to contamination than those in temperate regions, since the high humidity and temperature in these areas provide optimal conditions for toxin formation. Poor harvesting practices, improper storage and less than optimal conditions during transportation, marketing and processing can also contribute to fungal growth and increase the risk of mycotoxin production.4 Peanuts are known to be a major substrate for alatoxigenic fungal species.5
It is most unlikely that commodities will contain alatoxins B2, G1 and G2 and not alatoxin B1,6 and the concentration of the sum of the alatoxins B2, G1 and G2 is generally less than the concentration of alatoxin B1 alone. For that reason, analysis of one target component (AFB1) seems to be eficient, suficient and more practical.6
Alatoxin B1 (AFB1) (Figure 1) is the most toxic form of mycoto-xin for mammals and presents hepatotoxic, teratogenic and mutagenic properties, causing damage such as toxic hepatitis, hemorrhage, edema, immunosuppression and hepatic carcinoma.7 The sum of ala-toxins B1, B2, G1 and G2 has been classiied as class 1 carcinogenicity for humans by the International Agency for Research on Cancer.8
Contamination levels vary worldwide. Craufurd et al.9 in a study about alatoxin on peanut in Niger, found values ranged from 34 to 208 μg kg-1. Wang and Liu10 analyzing the contamination of alatoxins in different kinds of foods in China, found highest level of 28.39 μg kg-1 in peanuts. Sulaiman et al.2 studying the occurrence of alatoxins in raw shelled peanut samples from three districts of Perak, Malaysia, found the range of incidence of the AFB1 from 0.85 to 547.5 μg kg-1. In a review about mycotoxin research in Brazil from years 1991 to 2000, Rodriguez-Amaya and Sabino11
reported alatoxins contamination in peanuts and peanut products from 1 to 13000 μg kg-1.
In general the alatoxins regulation varies between different coun-tries with limits from 0 to 35 μg kg-1. In European Union the maximum level allowed for AFB1 in food is 2 μg kg-1 and for the sum of alatoxins is 4 μg kg-1.12 Brazilian regulatory limit in peanuts is 20 μg kg-1 for the sum of the concentrations of alatoxins B1, G1, B2 and G2.13
Several methods for the alatoxins determination in various samples have been already developed and reported in the literature. The more com-mon methods used for alatoxins determination step include thin-layer chromatography (TLC) and high performance liquid chromatography (HPLC) with various detection systems.5,7,14 HPLC is used worldwide because it offers good sensitivity and precision, coupled with ease of automation.15, 16 However, HPLC is expensive in initial capital invest-ment and requires skilled and experienced staff to operate and maintain equipment.17, 18 By contrast, TLC is a simple and robust technique,19 which is relatively inexpensive to establish in a testing laboratory, and most laboratories in developing countries have considerable expertise and experience with it.20 The major problem in TLC method is the quantiication that usually is done by visual comparison, however other techniques can be employed to improve the analytical performance, such as densitometry.21
the sensor and the exposure time. These series of voltages are digiti-zed and transferred to a computer for storage and data processing.22 By coupling CCD detection with TLC, the entire chromatographic plate can be imaged in a single exposure yielding rapid quantiication in shorter analysis time than of slit scanning densitometers.23 CCD detectors have demonstrated extremely low dark current and read noise characteristics, high sensitivity and excellent linearity. These features have made the CCD an excellent detector for many imaging applications in chemical analysis, such as luorescence detection.19,20
ImageJ is one of the many image processing tools available and is required for the analysis of images generated by the CCD camera and to carry out the necessary operations. It is a versatile software, which offers a wide array of functionalities that can be customized to meet speciic requirements.22 The package is freely available (http:// rsbweb.nih.gov/ij/) and very appropriate for the current application.23 The aim of this study was to develop a photometric procedure for determination of alatoxin B1 in peanuts by TLC through the luorescence images from UV lamp recorded by a CCD camera.
EXPERIMENTAL
Samples
A total of 39 samples of peanuts ready for consumption were analyzed for determination of AFB1. Several brands were collected at random at supermarkets and rural fairs in different regions of the States of Rio Grande do Sul, Brazil.
Alatoxin B1 standard solution
The concentration and purity of alatoxin standard were deter-mined by the technique of the Association of Oficial Analytical Chemists.24 A stock standard solution of AFB1 was prepared by dissolving 1 mg of pure crystalline AFB1 (Sigma-Aldrich, Steinheim, Germany) in toluene:acetonitrile (9:1, v/v) at concentration of 80 μg mL-1. The concentration of the AFB1 stock solution was determined by measuring the UV absorbance at 348 nm and calculated by using the molar extinction coeficient ε of 19300. The concentration of working standard solution in toluene: acetronitrile (9:1, v/v) was 0.8 μg mL-1.25 The standard and working solutions were kept frozen (-18 °C). The purity of alatoxin B1 was 92%.
Alatoxin B1 extraction
The samples weighing approximately 1 kg were ground and homogenized and a subsample of 50 g was removed for analysis in duplicate.
AFB1 was determined according to the method described by Soares and Rodriguez-Amaya.26 Firstly, 50 g of each sample was extracted with 270 mL methanol and 30 mL 4% (w/v) potassium chloride. Samples were blended at high speed (Blender, Walita, 550 W) for 5 min and iltered, 150 mL of the iltrate was collected. After that, 150 mL 10% (w/v) cooper sulfate and 5 g diatomaceous earth were added, followed by moderate stirring and iltration. 150 mL of the iltrate was transferred to a separation funnel with 150 mL of distilled water, and AFB1 was extracted twice with 10 mL chloroform. The chloroform extracts were colleted and submitted to solvent evaporation in water bath at 60 °C.
Chromatography
The extracts were resuspended in 100 μL chloroform and submitted to thin-layer chromatography (TLC). Three, six and nine microliter
ali-quots of sample extract and two, four and six microliter aliali-quots of AFB1 standard solution (0.8 μg mL-1) were spotted 1 cm apart on precoated silica gel plates (10 x 10 cm2) (Merck, Germany). The spots were dried, and the plates developed in a saturated chamber with chloroform:acetone (99:1, v/v). Alatoxins spots were observed under long-wave ultraviolet light (λ= 366 nm) and identiied by comparison with AFB1 standard. Conirmatory tests for AFB1 were carried out using triluoroacetic acid.27
CCD imaging system
Mycotoxins naturally luorescent, separated on a chromatographic plate can be quantitatively analyzed through a photometric procedure that compares the sample spots and the standard solution spots in different concentrations.
The way to carried out this evaluation can be deined as a pho-tometric procedure. In this case, AFB1 luorescence intensities from UV lamp were recorded by a CCD camera (Sony, Tokyo, Japan).
The TLC plate was positioned in system and CCD camera was aligned for optimal pixel resolution of CCD images. Five images were taken in each experiment and were analyzed using package ImageJ (Image Processing and Analysis in Java, http://rsbweb.nih.gov/ij/).28
Photometric procedure
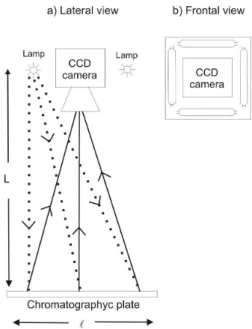
A photometer was design to ensure that every area element on the plate will get the same number of photons, within desired errors. One important concept is that the light source, the detector and the plate be on the same axis, as shown in Figure 2. The illumination uniformity on a square area of size l can be achieved by an optical device or by the geometric distribution of the components previously described, by controlling the distance L between the source and the chromatographic plate. We choose the geometric design. Furthermore, the light sources and the CCD sensor were set on the same plane, perpendicular to the set axis of symmetry, and consequently parallel to plate plane. As an example, a uniformity of 1-2% can be reached in the illumination of an area of 10 x 10 cm2 by distributing 4 UV lamps of 17 cm around the entrance of the CCD camera, putting them at 100 cm from the putative area of the chromatographic plate. Appropriate distribution of deckers help to avoid spurious light resulting from rays relected on the instrument walls.
Processing the CCD images
Two different software can be used to analyze the CCD images: ImageJ (http://rsbweb.nih.gov/ij/)28 and IRAF (http://iraf.noao.edu/).29 ImageJ is widely used in medicine30,31 and IRAF (Image Reduction Astronomical Facility) is practically the universal package for photo-metric reduction in Astronomy.32 The simplest way to measure the spots brightness is with the so called diaphragm photometry. In that mode one choose the diaphragm size and form (we adopted circular diaphragms due to the spots symmetry). Embracing a spot with this diaphragm one get the total number of pixel elements, the pixel mean brightness, the total brightness and its mean deviation. To discount the background, several backgrounds around every spot were measures with the same diaphragm.
Performance of the analytical method
The performance of the proposed quantitative method was evalua-ted based on the following parameters: linearity, recovery percentage, precision, limit of detection (LOD) and limit of quantiication (LOQ).
The sensitivity of the TLC-CCD technique was evaluated by determining LOD for AFB1. Decreasing concentrations of AFB1 standard solution (1.0, 0.8, 0.6, 0.4 and 0.2 ng per spot) were analyzed and the LOD was derived from the AFB1 standard luorescence with the lowest detectable signals. Linearity was determined by analysis of ive-point calibration curves using the intensity of AFB1 luorescence versus AFB1 concentration. The precision was evaluated by taking ive successive chromatographic plate images by CCD camera of ten plates containing 0.8, 1.6, 2.4, 3.2 and 4.8 ng per spot of standard solution. The luorescence of each spot was measured three times. The repeatability of AFB1 extraction method and accuracy of TLC-CCD technique were assessed by measuring the percent recovery of uncontaminated samples spiked with 16, 20 and 32 μg kg-1 of AFB1 in triplicate. The samples were spiked with the desired amount of standard solution at different points on the center top of the mass (50 g) and kept to dry naturally overnight. Within-day precision was determined by analyzing 4 replicates of spiked peanuts sample, and between-day precision was determined by analyzing 5 repli-cates during 5 days consecutives. The precision of the method was calculated from the relative standard deviation (RSD). The LOQ was obtained by spiking samples with decreasing concentrations of AFB1 standard solution (2.4, 2.0, 1.6, 1.2 and 0.8 μg kg-1) being considered the least amount of AFB1 in samples that can be quantitatively determined with accuracy and precision.
RESULTS AND DISCUSSION
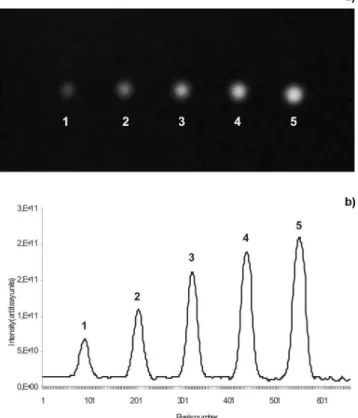
A chromatogram can be generated from luorescent spots which correspond to different AFB1 levels by ImageJ software, showing the ability of the CCD camera to take analytical information (Figure 3). Each peak corresponds to a concentration of standard solution (2.4, 4.8, 7.2, 9.6 and 12 ng) spotted on chromatographic plate. The CCD camera is suficiently sensitive to detect changes in spots luorescence intensity caused by small differences in mycotoxin concentration under a homogeneous illumination from a UV light source. The change in luorescence signal intensity corresponds to the different concentrations of AFB1 standard.
The photometric procedure developed in this study is based in a CCD camera. The light beam is composed by ionizing and non-ionizing photons. Ionizing photons incident on the spots will produce luorescence, that is, the photons living the spots will have lower energy/frequency than the incident ones. The lower frequency photons will be registered by the CCD camera. The ionizing photons that strike outside the spots
will be relected with the same frequency of incidence. Since they are UV photons outside the CCD sensibility range, they will be not registered by the sensor. The non-ionizing photons will be similarly relected by the whole chromatographic plate, that is, by the spots and by the adja-cent areas. Within this spectrum, the photons within the CCD range of sensibility will be detected by the device inside and outside the spots. That will constitute the background light, undesirably contributing to the spots brightness. This subsidiary brightness has to be discounted from the spot by measuring nearby areas to them. One caveat of this procedure step would be the lack of uniformity of the light beam focusing on the chromatographic plate. That seems to be the case of the photometer used by Zhang and Lin19 where the light focus on the chromatographic plate clearly is not uniformly distributed. In the study of these authors, the number of ionizing photons falling on one spot at the plate center is 60% larger than those incidents at the border. In cases like that part of the spots brightness difference may be due to the non homogeneity of the light beam, provided that the number of in falling ionizing photons on the less illuminated spot is not enough to excite the whole mycotoxin sample. In that case, a mathematical procedure must be done to correct the background differences between the center and the border.
A uniform illumination of the spots was achieved, in this study, by an adequate design of the photometer (Figure 2), the device mounted to carry out the photometric procedure.
The LOD was 0.4 ng per spot and the LOQ was 1.2 μg kg-1. Linearity was determined by analyzing ive-point calibration curves within the concentration of 0.8, 1.6, 2.4, 3.2 and 4.8 ng per spot. The linear regression coeficient of standard solution curve (y = 40255x – 1894.8) was 0.998.
Recovery rates of AFB1 obtained by spiking peanut samples with 16, 20 and 32 μg kg-1 in triplicate were 94, 97 and 102%, respectively, and the relative standard deviation (RSD) for repeatability was 4.2, 4.0 and 5.6, respectively. The results of the within and between-day precision of the assay (Table 1) show that the method has good pre-cision, with RSDs ≤ 5.2.
The applicability of this method was tested analyzing 39 peanut samples and the Table 2 shows the levels of AFB1 found. Of the 39 samples analyzed, AFB1 was not detected in 84.6% of them and 15.4% showed levels from 16 to 115 μg kg-1.
The high levels of AFB1 contamination in peanuts marketed in southern Brazil are in disagreement with the current Brazilian regulation exceeding the tolerance level of 20 μg kg-1 and become important because the toxic effects of alatoxins represent a severe health risk for consumers and also a risk factor for the economy since the product does not satisfy the requirements for export.
Nakai et al.7 used TLC to determine the occurrence of alatoxins in stored peanut samples from State of São Paulo, Brazil, found mean levels of AFB1 from 7.0 to 116 μg kg-1 and the detection limit was 2 μg kg-1.
Sabino et al.33 researching about the occurrence of alatoxins in peanuts and peanut products consumed in the State of São Paulo, Brazil, found the maximum level of contamination of 536 μg kg-1, using TLC technique by visual comparison with the quantiication limit of 5 μg kg-1. Usually, the detection limits achieved for the determination of AFB1 in different samples by TLC technique are higher than that found in this study (0.4 ng per spot).7,33 This probably occurs because the TLC techniques for quantiication usually use the visual comparison of luorescent spots of the samples with luorescent spots of the standard solution in different concentrations and it is known that the sensitivity of the human eye can not be compared to a photographic image as pro-posed in this study. Furthermore, the ability to view differs from person to person and results may differ when analyzed by different analysts. Using TLC and densitometry for determination of AFB1, Prado et al.21 obtained mean recoveries of 93.2% for pepper and 82.5% for oregano. LOQ were 5 μg kg-1 for pepper and 10 μg kg-1 for oregano. Comparing TLC - densitometry and the TLC-CCD with the photometric procedure applied in our study, it can be seen that TLC-CCD showed a better performance of the analytical method with LOQ of 1.2 μg kg-1.
Considering that TLC is the method of choice in many parts of the world, especially in developing countries, the photometric procedure developed in this study demonstrated to be a simple, eficient and low cost tool for quantitative analyses of AFB1 in peanut samples by TLC-CCD technique.
ACKNOWLEDGEMENTS
The authors thank Toxicology Laboratory at the Institute of Food Science and Technology of the Federal University of Rio Grande do Sul - UFRGS, Graduate Course of Environmental and Agriculture Microbiology - UFRGS and Coordenadoria para Aperfeiçoamento de Pessoal de Nível Superior for the graduate scholarships.
REFERENCES
1. Sherif, O. S.; Emad, E. S.; Mosaad, A. A.; Int. J. Hyg. Environ. Health 2009, 212, 347.
2. Sulaiman, M. R.; Chye, F. Y.; Hamid, A.; Yatim, A. M.; EJEAF Che.
2007, 6, 2045.
3. Conzane, R. S.; Stenzel, W. R.; Kroh, L. W.; Dtsch. Lebensmitt. Rundsch. 2002, 98, 289.
4. Thompson, C.; Henke, S. E.; J. Wildl. Dis. 2000, 36, 172.
5. Juan, C.; Zinedine, A.; Moltó, J. C.; Idrissi, L.; Mañes, J.; Food Control 2008, 19, 849.
6. Food and Agriculture Organization of the United Nations (FAO); Food and Nutrition Papers 2004, 81, 180.
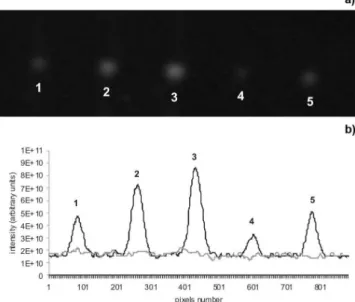
Figure 4. (a) Image of chromatographic plate obtained by the CCD camera with (1) three, (2) six, (3) nine microliters aliquots of sample extract, (4) two
and (5) four microliter aliquots of alatoxin B1 standard solution (0.8 µg mL
-1); (b) chromatogram obtained from chromatographic plate image by CCD
camera with the same concentrations of sample extracts and alatoxin B1 standard solution showing the interferents from the sample in the baseline of the chromatogram (gray line)
Table 1. Precision of the extraction method and TLC-CCD technique
for determination of AFB1 in peanut samples
Within-day Between-day
AFB1 spiked (μg kg-1)
Recovery (μg kg-1)
Recovery %
RSDa (%)
Recovery (μg kg-1)
Recovery %
RSDa (%)
16 15.2 95.0 4.1 15.6 97.5 4.9
20 19.2 96.0 3.8 19 95.0 3.9
32 30.6 95.6 5.2 30.1 94.1 4.5
aRSD = Relative standard deviation
Table 2. AFB1 levels in peanut samples marketed in south of Brazil
determined by TLC-CCD technique in duplicate
Sample no. AFB1 (μg kg-1) RSDa (%)
1 38 7.4
2 45 12.5
3 29 3.6
4 115 1.3
5 65 4.3
6 16 8.8
7. Nakai, V. K.; Rocha, L. O.; Gonçalez, E.; Fonseca, H.; Ortega, E. M. M.; Corrêa, B.; Food Chem.2008,106, 285.
8. International Agency for Research on Cancer (IARC). In IARC
mono-graphs on the evaluation of carcinogenic risks to humans, Lyon, 2002,
82.
9. Craufurd, P. Q.; Prasad, P. V. V.; Waliyar, F.; Taheri, A.; Field Crops Res. 2006, 98, 20.
10. Wang, J.; Liu, X. M.; Biomed. Environ. Sci.2007, 20, 483.
11. Rodriguez-Amaya, D. B.; Sabino, M.; Braz. J. Microbiol. 2002,33, 1. 12. Koe, W. J.; Arh. Hig. Rada. Toksikol. 1999, 50, 37.
13. Brasil; Diário Oicial da União, 2002, RDC nº 274. 14. Sheibani, A.; Ghaziaskar, H. S.; Food Control 2009, 20, 124. 15. Leming, L.; Zhang, L. J.; Wang, P.; Wang, Y.; Chen, J.; J. Chromatogr.,
A1998, 3, 815.
16. Gilbert, J.; Anklam, E.; Trends Anal. Chem. 2002, 21, 468.
17. Lancaster, M.; Goodall, D. M.; Bergstrom, E. T.; Mccrossen, S.; Myers, P.; Anal. Chem. 2006, 78, 905.
18. Hayakawa, T.; Hirai, M.; Anal. Chem. 2003, 75, 6728. 19. Zhang, L.; Lin, X.; J. Chromatogr., A2006, 1109, 273.
20. Liang, Y.; Baker, M. E.; Yeager, T.; Denton, M. B.; Anal. Chem. 1996,
68, 3885.
21. Prado, G.; Oliveira, M. S.; Moreira, A. P. A.; Lima, A. S.; Souza, R. A.; Alves, M. C.; Quim. Nova2008, 31, 514.
22. Omar, S. N.; Manoj, K. M.; DheevatsaMudigere, B. E.; J. Bodywork Mov. Ther.2007, 11, 231.
23. Moodley, K.; Murrell, H.; Comput. Geosci. 2004, 30, 609.
24. Scott, P. M.; Oficial Methods of Analysis of the Association of Oficial Analytical Chemists, Virginia, 1995, 3.
25. Alatoxins, Oficial Methods of Analysis of the Association of Oficial Analytical Chemists, Virginia, 1995, 3.
26. Soares, L. M. V.; Rodriguez-Amaya, D. B.; J. AOAC Int.1989, 72, 22. 27. Przybylski, W.; J. AOAC Int. 1975, 58, 163.
28. Rasband, W.; ImageJ; Image Processing and Analysis in Java; National Institute of Mental Health, USA, 1997.
29. Barnes, J.; IRAF Version 2.10; A Beginner’s Guide to Using IRAF; National Optical Astronomy Observatories (NOAO), USA, 1993. 30. Shefield, L. B.; Microsc. Microanal. 2008, 14, 898.
31. Vejchapipat, P.; Poomsawat, S.; Imvised, T.; Chongsrisawat, V.; Chit-31. Vejchapipat, P.; Poomsawat, S.; Imvised, T.; Chongsrisawat, V.; Chit-tmittrapap, S.; Poovorawan, Y.; Hepatology Researc 2008, 38, 1018. 32. Smriglio, F.; Dasgupta, A. K.; Boyle, R. P.; Astronomy and Astrophysics
2006, 458, 767.
33. Sabino, M.; Milanez, T. V.; Lamardo, L. C. A.; Inomata, E. I.; Zorzetto, M. A. P.; Navas, S. A.; Stofer, M.; Rev. Microbiol. 1999, 30, 85. 34. Gnonlonin, G. J. B.; Hell, K.; Fandohan, P.; Siame, A. B.; Int. J. Food