Quim. Nova, Vol. 33, No. 1, 208-211, 2010
Nota Técnica
*e-mail: [email protected]
DEVELOPMENT AND VALIDATION OF RP-LC AND UV SPECTROPHOTOMETRIC METHODS TO ASSAY BROMOPRIDE IN ORAL AND INJECTABLE SOLUTIONS
Márcia Camponogara Fontana, Felipe Kellermann Hurtado, Micheli Wrasse, Aline Augusti Boligon, Tarcieli Pozzebon Venturini, Clarice Madalena Bueno Rolim e Ruy Carlos Ruver Beck*
Departamento de Farmácia Industrial, Centro de Ciências da Saúde, Universidade Federal de Santa Maria, Av. Roraima 1000, 97105-900 Santa Maria - RS, Brasil
Recebido em 26/2/09; aceito em 15/6/09; publicado na web em 25/11/09
A reversed-phase liquid chromatographic (LC) and ultraviolet (UV) spectrophotometric methods were developed and validated for the assay of bromopride in oral and injectable solutions. The methods were validated according to ICH guideline. Both methods were linear in the range between 5-25 µg mL-1 (y = 41837x – 5103.4, r = 0.9996 and y = 0.0284x – 0.0351, r = 1, respectively). The statistical analysis showed no signiicant difference between the results obtained by the two methods. The proposed methods were found to be simple, rapid, precise, accurate, and sensitive. The LC and UV methods can be used in the routine quantitative analysis of bromopride in oral and injectable solutions.
Keywords:bromopride; reversed-phase liquid chromatography; ultraviolet spectrophotometry.
INTRODUCTION
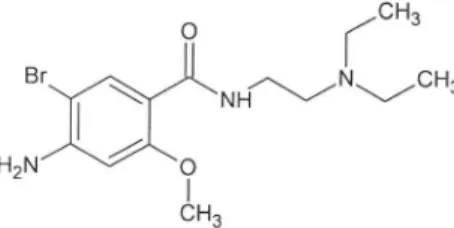
Bromopride (4-amino-5-bromo-N -(2-diethylaminoethyl)-2-methoxybenzamide) (Figure 1), a white crystalline powder, is the bromo-analogue of metoclopramide, being both benzamide derivatives. Bromopride stimulates the motility of the gastrointestinal tract, enhances gastric emptying rate, and presents antiemetic properties. Bromopride is used to treat a variety of gastrointestinal disorders. The main action of bromopride is related to blockade of dopamine 2-receptors in the central nervous system and gastrointestinal tract. Similar to other benzamide derivatives, the gastrointestinal tract stimulation by bromopride appears to be mediated at least in part by its indirect cholinergic activity.1
Some techniques have been used to determine bromopride in different biological matrices. Such methods include liquid chroma-tography-electrospray tandem mass spectrometry,2 high-performance
liquid chromatography with UV detection,3-5 thin-layer
chromatogra-phy and gas chromatograchromatogra-phy.6 The pharmacopoeia does not present
methods for the assay of bromopride in oral and injectable solutions. To date, there are no previous reports focused on the development and validation of analytical methods for the quantitative analysis of bromopride as active substance in pharmaceutical dosage form.
Considering the lack of methods available to assay bromopride in pharmaceutical formulations, this work describes the development and validation of reversed-phase liquid chromatographic (RP-LC) and UV spectrophotometric methods for the determination of bromopride in pharmaceutical dosage forms, establishing procedures for their
quality control. Both methods have been applied for the quantitative analysis of bromopride in oral and injectable solutions.
EXPERIMENTAL
Chemicals
Bromopride reference substance (assigned purity 99.11%) was purchased from DEG Importadora de Produtos Químicos Ltda (São Paulo, Brazil). Digesan® (Sanoi-Synthelabo), oral and injectable
solutions containing 4 and 5 mg mL-1 of bromopride, respectively,
was obtained from the market (Batches 6V2619 and 6Y002, respec-tively). Gradient-grade LiChrosolv acetonitrile and methanol were purchased from Merck (Darmstadt, Germany). Monobasic sodium phosphate (KH2PO4) and triethylamine (TEA) were also obtained from Merck. Hydrochloric acid was obtained from Tedia (Fairield, USA). Water was puriied with WaterProTM PS, Labconco system
(MO, USA). Bromopride oral solution was labeled to contain the following excipients: sodium metabisulite, methylparaben, propyl-paraben, sodium saccharin, disodium edetate, hydrochloric acid and water. Bromopride injectable solution was labeled to contain the following excipients: hydrochloric acid, sodium chloride and water.
Instrumentation and analytical conditions
The LC method was performed on a Shimadzu LC system (Kyo-to, Japan) equipped with a CBM-20A system controller, LC-20AT pump, DGU-20A5 degasser, SIL-20A auto-sampler and SPD-M20A photodiode array detector (PAD). Analytical separation was perfor-med on a Phenomenex (Torrance, USA) Gemini C18 column (150 × 4.6 mm i.d., 5 µm particle size) coupled to a C18 guard column (40 × 3.0 mm i.d., 4 µm). The isocratic mobile phase was a mixture of 10 mM KH2PO4 + 0.1% TEA (pH 3.0 adjusted with phosphoric acid): acetonitrile (80:20, v/v), performed at room temperature (25 ± 1 °C), which was pumped at a low-rate of 1.0 mL min-1. This was iltered
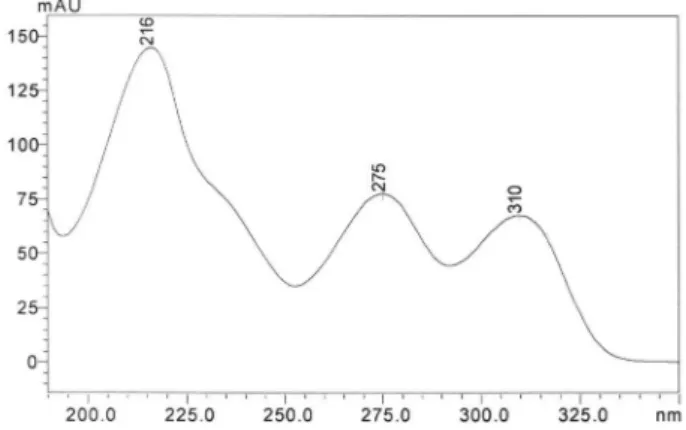
through a 0.45 µm nylon membrane ilter (Sartorius, Germany) and degassed before used. The injection volume was 20 µL (variable injection volume valve – 0.1 to 100 µL). The detection was achieved with a PAD at 310 nm (Figure 2).
Development and validation of RP-LC and UV spectrophotometric methods 209
Vol. 33, No. 1
The UV spectrophotometric method for quantitative assay of bromopride in oral and injectable solutions was performed on a Shi-madzu UV 1601 PC spectrophotometer (Kyoto, Japan) equipped with 1 cm quartz cells with detection at 310 nm and 0.1 M hydrochloric acid was used as diluent.
Preparation of reference solution
LC method
An accurately weighed 10 mg portion of bromopride reference standard was transferred to a 100 mL volumetric lask and dissol-ved in methanol (inal concentration = 100 µg mL-1). This solution
was diluted with ultra-pure water to give ive standard solutions with different concentrations of bromopride (5.0, 10.0, 15.0, 20.0, and 25.0 µg mL-1), which were used in the analytical curve for the
linearity evaluation. UV method
Stock standard solution (100 µg mL-1) was prepared by
dissol-ving 10.0 mg bromopride reference standard in 100.0 mL of 0.1 M hydrochloric acid. The stock standard solution was diluted with 0.1 M hydrochloric acid to give ive standard solutions with different concentrations of bromopride (5.0, 10.0, 15.0, 20.0, and 25.0 µg mL-1),
which were used in the analytical curve for the linearity evaluation.
Preparation of sample solution
LC method
An amount equivalent to 10 mg of bromopride, present in oral and injectable solutions, was transferred to a 100 mL volumetric lask and diluted with methanol to obtain a concentration of 100 µg mL-1.
These solutions were diluted with ultra-pure water to obtain inal concentrations of 15 µg mL-1 and iltered through a 0.45 µm nylon
membrane ilter (Sartorius, Germany) before LC analysis. UV method
An amount equivalent to 10 mg of bromopride, present in oral and injectable solutions, was transferred to a 100 mL volumetric lask and diluted with 0.1 M HCl to obtain concentrations of 100 µg mL-1. These samples were diluted with 0.1 M HCl to obtain a inal
concentration of 15 µg mL-1 before analysis on the spectrophotometer.
Method validation
Validation was carried out assessing the following parameters: line-arity, range, speciicity, precision, accuracy, detection and quantiication
limits, according to the International Conference on Harmonization (ICH) guidelines for validation of analytical procedures.7,8The system
suitability test was also carried out to evaluate the reproducibility of the analytical system, using ive replicate injections of a reference solution. The parameters measured were injection repeatability, retention time, theoretical plates, peak symmetry, and capacity factor.
Linearity
The analytical curves were obtained with ive concentrations of reference solution in the range of 5-25 µg mL-1 for the
spectropho-tometric and LC methods. Each solution was prepared in triplicate. The linearity was evaluated by linear regression analysis by the least-square regression method, which was used to calculate the correlation coeficient, y-intercept and slope of the regression line.
Precision
The precision of the procedures was determined by repeatability (intra-day) and intermediate precision (inter-day). Repeatability was evaluated assaying six determinations at the same concentration (15 µg mL-1), during the same day, under the same experimental
condi-tions. Intermediate precision was analyzed comparing the assays in six determinations at the same concentration (15 µg mL-1) during three
different days. Precision (repeatability and intermediate precision) was expressed as relative standard deviation (RSD%).
Accuracy
Accuracy was evaluated assaying samples of a known concen-tration (7.5 µg mL-1) spiked with three different concentrations of
standard solution (3.75, 7.50 and 11.25 µg mL-1), at three different
levels (lower, medium and upper concentration), giving sample so-lutions with concentrations of 11.25, 15.00 and 18.75 µg mL-1. The
accuracy was calculated as the percentage of the drug recovered from the formulation and also expressed as the relative standard deviation (RSD) between the measurements.
Speciicity
The speciicity of the LC method was evaluated through the analysis of a placebo solution. The placebo consisted of all the excipients without the active ingredient. For both methods, the in-terference from the formulation matrix was evaluated. The system response was examined for the presence of interference or overlaps with bromopride responses.
Limit of detection and limit of quantiication
The limit of detection (LOD) and limit of quantiication (LOQ) were calculated based on the standard deviation of the response and the slope using three independent analytical curves, as deined by ICH.7 LOD and LOQ were calculated as 3.3 and 10
σ/S, respectively, where σ is the standard deviation of the response and S is the slope of the calibration curve.
Method comparison
The chromatographic and spectrophotometric methods to assay bromopride in pharmaceutical formulations proposed in our study were compared using statistical analysis by Student’s t-test. Six samples of each pharmaceutical dosage forms were analyzed by both methods (LC and UV).
Figure 2. UV spectra of bromopride reference standard by HPLC-DAD at
Fontana et al.
210 Quim. Nova
RESULTS AND DISCUSSION
LC method
A simple RP-LC method was developed to assay bromopride in pharmaceutical formulations. The method was optimized to provide a good separation of the components (acceptable theoretical plates and resolution between peaks) with a suficient sensitivity and suitable peak symmetry (peak tailing factor < 2)9 in a short run. For this
pur-pose, analytical column, solvent selection, mobile phase composition, low-rate, and detector wavelength were studied. The chromatographic separation was achieved using a reversed-phase C18 column because it is suitable to analyze bromopride with adequate resolution and symmetrical peak shapes. The chromatograms of bromopride reference standard, sam-ples, and placebo solutions are demonstrated in Figure 3. Analyzing this igure, it can be observed that the proposed LC method is speciic since no interfering peaks were observed in the placebo samples. In order to conirm this absence of interference, a peak-purity evaluation using the photodiode-array (PDA) was carried out. These analyses showed that no impurities and/or excipients were co-eluting with the bromopride peak. In addition, the retention time (5.1 min) allows rapid determination of the drug, which is important for routine analysis. Besides the presence of methyl and propyl parabens in the oral solutions, as preservative, the corresponding peaks were not observed in the chromatograms due to their lack of UV absorption at 310 nm. Methyl and propyl parabens presented peak maxima around 254 nm in acid solution.10
The analytical curves for bromopride were constructed by plotting concentration versus peak area. A good linearity was observed in the range between 5 and 25 µg mL-1. The linear equation obtained by the
least-square method was y = 41837x – 5103 (n = 3) showing an adequate correlation coeficient (r = 0.9996). LOD and LOQ were 0.15 and 0.50 µg mL-1, respectively. These low values indicate a good sensitivity of
the proposed method. These data were validated by means of ANOVA, showing a linear regression with no deviation from linearity.
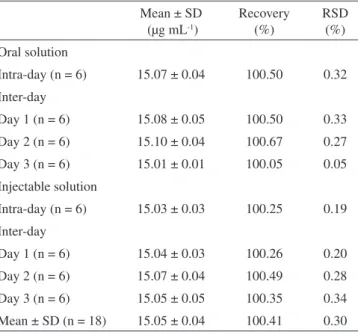
The results obtained for precision are presented in Table 1. All RSD values were lower than 1.0%, indicated good intra-day and inter-day precision.11,12 Regarding the accuracy evaluation, good recoveries
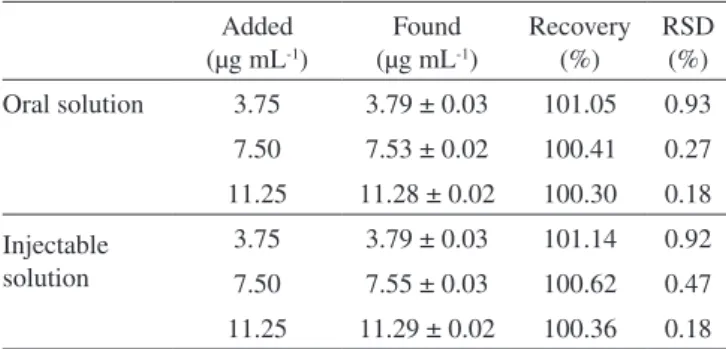
(100-102 %) were obtained (Table 2). The percent recovery indicated good accuracy13 and, consequentially, an agreement between the
theoretical value and the real value of concentration.11 These results
demonstrated the adequate precision and accuracy of the developed LC method to assay bromopride in such formulations.
UV method
TheUV method for the assay of bromopride was developed as an alternative technique, considering its rapid and low-cost as well as its simple instrumentation compared with other techniques. Since bromopride is freely soluble in 0.1 M HCl this solution was chosen as diluent for the UV assay. The UV spectra of bromopride reference standard, bromopride oral and injectable solutions are represented in Figure 4. As can be seen in Figure 4, the UV spectra from injectable solution overrides the UV spectra obtained for the reference standard solution. As explained previously, the presence of methyl and propyl parabens in the oral solution did not show any interference on the UV spectra because their lack of absorption at 310 nm.10
Good linearity was observed in the 5.0-25.0 µg mL-1 range, as
previously observed for the LC method. The linear equation obtained by the least-square method was y = 0.0284x – 0.0351 showing an adequate correlation coeficient (r = 1). Data were validated by means of ANOVA, which demonstrated linear regression with no linearity deviation. The LOD and LOQ of the UV method were 0.48 and 1.60 µg mL-1, respectively. Although LOD and LOQ of the UV method were
higher than those obtained for the LC method (0.15 and 0.50 µg mL-1,
respectively), the results from both methods show their good sensitivity to assay bromopride in the concentration range proposed in our method. Regarding the evaluation of the precision and accuracy of the UV method (Tables 3 and 4, respectively), the results are similar to those obtained for the LC method. All RSD values were lower than
Figure 3. Chromatograms of bromopride in oral and injectable solution at 15
µg mL-1 (A and C), their respective placebos (B and D) and reference standard
solution (E) at 15 µg mL-1
Table 1. Repeatability (intra-day precision) and intermediate preci-sion (inter-day) of oral and injectable solutions determined by the LC method
Mean ± SD (µg mL-1)
Recovery (%)
RSD (%) Oral solution
Intra-day (n = 6) 15.07 ± 0.04 100.50 0.32
Inter-day
Day 1 (n = 6) 15.08 ± 0.05 100.50 0.33
Day 2 (n = 6) 15.10 ± 0.04 100.67 0.27
Day 3 (n = 6) 15.01 ± 0.01 100.05 0.05
Injectable solution
Intra-day (n = 6) 15.03 ± 0.03 100.25 0.19
Inter-day
Day 1 (n = 6) 15.04 ± 0.03 100.26 0.20
Day 2 (n = 6) 15.07 ± 0.04 100.49 0.28
Day 3 (n = 6) 15.05 ± 0.05 100.35 0.34
Mean ± SD (n = 18) 15.05 ± 0.04 100.41 0.30
Table 2. Accuracy of oral and injectable solutions by the LC method Added
(µg mL-1)
Found (µg mL-1)
Recovery (%)
RSD (%)
Oral solution 3.75 3.78 ± 0.01 100.70 0.30
7.50 7.51 ± 0.01 100.17 0.11
11.25 11.27 ± 0.01 100.17 0.08
Injectable solution
3.75 3.76 ± 0.01 100.41 0.24
7.50 7.51 ± 0.01 100.19 0.16
Development and validation of RP-LC and UV spectrophotometric methods 211
Vol. 33, No. 1
and linear in the concentration range of 5-25 µg mL-1, allowing
com-plete interchange, encouraging its application for quality control of bromopride in oral or injectable solutions. In addition, the proposed UV method uses no organic solvent avoiding the formation of dangerous residues promoting beneits to the public health and the environment.
ACKNOWLEDGEMENTS
The authors thank the inancial support of CAPES (Coordenação de Aperfeiçoamento de Pessoal de Nível Superior)/Brazil.
REFERENCES
1. Tanaka, R.; Hirayama, N.; Anal. Sci. 2004, 20, x79.
2. Nazare, P.; Massaroti, P.; Duarte, L. F.; Campos, D. R.; Marchioretto, M. A. M.; Bernasconi, G.; Calafatti, S.; Barros, F. A. P.; Meurer, E. C.; Pedrazzoli, J.; Moraes, L. A. B.; J. Mass Spectrom. 2005, 40, 1197. 3. Brodie, R. R.; Chasseaud, L. F.; Rooney, L.; J. Chromatogr., B1984,
310, 353.
4. Brodie, R. R.; Chasseaud, L. F.; Darragh, A.; Lambe, R. F.; Rooney, L.; Taylor, T.; Biopharm. Drug Dispos.1986, 7, 215.
5. Lucker, P. W.; Tinhof, W.; Wetzellsberger, N.; Weyers, W.; Brodbeck, R.; Arzneim. Forsch. 1983, 33, 453.
6. Imbs, J.; Leibenguth, A.; Koffel, J. C.; Jung, L.; Arzneim Forsch.1982,
32, 503.
7. ICH – Harmonised Tripartity Guideline; Validation of Analytical
Proce-dures: Text and Methodology Q2(R1). IFPMA:Geneva, 2005.
8. Ribeiro, F. A. L.; Ferreira, M. M. C.; Morano, S. C.; Silva, L. R.; Schneider, R. P.; Quim. Nova2008, 31, 164.
9. The United States Pharmacopeia/The National Formulary; 30th ed., Pharmacopoeial Convention: Rockville, 2006.
10. Chen, Y. Q.; Ni, Y. N.; Chinese Chem. Lett. 2009, 20, 615.
11. Silva, B. C.; Campos, L. M. M.; Nunan, E. A.; Soares, C. D. V.; Silva, G. R.; Ribeiro, J. A. A.; Pianetti, G. A.; Quim. Nova2005, 28, 50. 12. Agência Nacional de Vigilância Sanitária (ANVISA); Resolução RE 899
de 29 de maio de 2003 - Guia para validação de métodos analíticos e
bioanalíticos,Diário Oicial da União: Brasília, 2003.
13. Ribani M.; Bottoli, C. B. G.; Collins, C. H.; Jardim, I. C. S. F.; Melo, L. F. C.; Quim. Nova2004, 27, 771.
14. Menegola, J.; Steppe, M.; Schapoval, E. E. S.; J. AOAC Int. 2008, 91,52. 15. Hurtado, F. K.; Nogueira, D. R.; Bortolini, F.; Da Silva, L. M.;
Zimmermann, E.; Souza, M. J. E.; De Melo, J.; Rolim, C. M. B.; J. Liq.
Chromatogr. R. T. 2007,30, 1981.
16. De Melo, J.; Hurtado, F. K.; Prado, A. W.; Souza, M. J. E.; Rolim, C. M.
B.; J. Liq. Chromatogr. R. T. 2008,31, 269.
17. Fregonezi-Nery, M. M.; Baracat, M. M.; Casagrande, R.; Machado, H. T.; Miglioranza, B.; Gianotto, E. A. D. S.; Dalmas, J. C.; Quim. Nova
2008, 31, 1665. 1.0 % and recoveries were in the range of 100-102%. These results
demonstrated adequate precision and accuracy of the UV method.
Comparison between the LC and UV methods
LC and UV methods were compared using Student’s t-test. There was no signiicant difference between the experimental values obtained through the analysis of six samples using the two methods, regardless of the dosage form (p > 0.05). This result shows that the 2 methods are equivalent for the quantitative determination of bromopride in oral or injectable solutions, as showed by some authors for other drugs. 14-17
CONCLUSIONS
Rapid, speciic and reliable LC and UV methods were developed and validated for the assay of bromopride in oral and injectable solu-tions. Both analytical methods are simple, precise, accurate, sensitive,
Table 3. Repeatability (intra-day precision) and intermediate preci-sion (inter-day) of oral and injectable solutions determined by the UV method
Mean ± SD (µg mL-1)
Recovery (%)
RSD (%) Oral solution
Intra-day (n = 6) 15.03 ± 0.04 100.25 0.29
Inter-day
Day 1 (n = 6) 15.04 ± 0.04 100.26 0.30
Day 2 (n = 6) 15.03 ± 0.02 100.18 0.12
Day 3 (n = 6) 15.07 ± 0.03 100.49 0.21
Injectable solution
Intra-day (n = 6) 15.02 ± 0.02 100.18 0.19
Inter-day
Day 1 (n = 6) 15.03 ± 0.03 100.18 0.19
Day 2 (n = 6) 15.09 ± 0.02 100.57 0.12
Day 3 (n = 6) 15.05 ± 0.05 100.34 0.32
Mean ± SD
(n = 18) 15.05 ± 0.04 100.36 0.26
Table 4. Accuracy of oral and injectable solutions by the UV method Added
(µg mL-1)
Found (µg mL-1)
Recovery (%)
RSD (%)
Oral solution 3.75 3.79 ± 0.03 101.05 0.93
7.50 7.53 ± 0.02 100.41 0.27
11.25 11.28 ± 0.02 100.30 0.18
Injectable solution
3.75 3.79 ± 0.03 101.14 0.92
7.50 7.55 ± 0.03 100.62 0.47
11.25 11.29 ± 0.02 100.36 0.18
Figure 4. UV spectra of bromopride reference standard (A), bromopride oral