Gas-Surface Interaction Effect on Round Leading Edge Aerothermodynamics
Wilson F. N. Santos
National Institute for Space Research, Cachoeira Paulista, SP 12630–000, Brazil
Received on 17 November, 2006
Effects of incomplete surface accommodation in rarefied gas flow have been studied by using the Direct Sim-ulation Monte Carlo (DSMC) method in conjunction with the Cercignani-Lampis-Lord gas surface interaction model. The DSMC calculations examine differences in predictions of aerodynamic forces and heat transfer between full and partial surface accommodation for hypersonic flow past round leading edges at zero incidence. The aerodynamic performance of round leading edges is assessed by using the heat transfer rate, the total drag and the shock wave standoff distance. Twenty-five combinations of nose radius, normal and tangential accom-modation coefficients were used in the simulation. For the flow conditions considered, the analysis showed that stagnation point heating, total drag and shock standoff distance are sensitive to changes on either the normal or tangential accommodation coefficient. The results substantiate that it becomes imperative to take surface ac-commodation into account in order to make accurate predictions of the aerodynamic forces on, and heat transfer rates to, bodies in rarefied hypersonic flow.
Keywords: Aerothermodynamics; Gas flow; Surfaces
I. INTRODUCTION
Supersonic and hypersonic flight vehicles are commonly designed and manufactured with blunt noses. A large nose ra-dius helps to withstand, distribute, and dissipate the heat and pressure loadings that are often most extreme at the vehicle bow. At one hand, for the particular case of atmospheric entry and re-entry vehicles, high bluntness contributes to the drag production that is necessary to decelerate from suborbital to subsonic speed. On the other hand, supersonic and hypersonic cruise vehicles need low drag to efficiently maintain velocity, a requirement satisfied with a small but finite nose bluntness. In this scenario, the leading edge of the vehicle is one of the key issues concerning hypersonic configurations.
Certain configurations, such as hypersonic waveriders [1], are designed analytically with infinitely sharp leading edges for shock wave attachment in order to contain the high-pressure air that produces useful lifting force. Nevertheless, these leading edges must then be blunted for heat transfer and manufacturing, with associated departure from ideal perfor-mance. An ongoing in the application of hypersonic waverider shapes to the design of realistic flight systems is therefore the concern that the predicted performance of analytically derived shapes, with infinitely sharp leading edges, will not be achieve when actual leading edges are blunted for heat transfer and manufacturing requirements. In this way, it has been gener-ally assumed that a round leading edge, with constant radius of curvature near the stagnation point, is the appropriate blunt-ing geometry.
Recently, considerable attention [2-6] has been given to the problem of calculating aerodynamic performance of hyper-sonic waverider vehicles for high-altitude/low-density appli-cations. Nonetheless, in hypersonic flight at high altitudes, gas-surface interaction is the dominant physical process gov-erning aerodynamic forces and heat transfer. The influence of the gas-surface interaction model on the flow parameters increases substantially as the gas rarefaction increases, and a correct choice of the model for calculating hypersonic rarefied
flows plays an important role.
It has been known from experimental data that one can approximate gas-surface interactions on engineering surface with contamination from air and surface roughness by using the fully diffusion reflection model. Diffuse reflection oc-curs in such a manner that all previous directional history is erased, and the molecules are reflected equally in all direc-tions. Nevertheless, according to molecular beam studies and direct measurements of accommodation, the diffuse reflection model is unrealistic, except for highly contaminated surface. The vehicle surface at high altitude will become gradually de-contaminated, and it is likely that the reduction in accommo-dation will have significant effects on aerodynamic forces and heat transfer rates. As a result, molecules reflected from clean surface show lobular distribution in direction, which tends to approach the specular angle for very high energy and/or low angle of attack. Among the several phenomenological models that have been proposed to describe gas-surface interactions, that of Cercignani-Lampis-Lord (CLL) model [7] appears to be the most successful to handle such behavior. The CLL model incorporates independent accommodation coefficients for the normal and tangential velocity components. It pro-duces physically realistic distributions of direction and energy of scattered molecules and provides a continuous spectrum of behavior from specular to diffuse reflection.
The study at hand investigates the differences in the aerothemodynamic quantities predicted with the CLL model, which is implemented into a DSMC code. For the idealized situation of two-dimensional rarefied hypersonic flow, calcu-lations have been performed on round leading edges. Of par-ticular interest are the behaviors of stagnation point heating, total drag and shock wave displacement.
II. GAS-SURFACE INTERACTION MODEL
influ-ence of the gas-surface interaction model on the flow proper-ties increases substantially with increasing the gas rarefaction. Therefore, a correct choice of the model for calculating hyper-sonic rarefied flows is important.
Diffusion reflection with complete momentum and energy accommodation is most frequently used in DSMC method. In a diffuse reflection, the molecules are reflected equally in all directions usually with a complete thermal accommodation. The final velocity of the molecules is randomly assigned ac-cording to a half-range Maxwellian distribution determined by the wall temperature.
Specular reflection with zero accommodation or comple-mentary fractions of diffuse and specular reflection are also often used in DSMC method. The combination of diffuse reflection with specular reflection is called Maxwell model. Generally, the Maxwell model is constructed on the assump-tion that a fracassump-tion (1-f) of the molecules is reflected from the surface in a specular fashion, while the fraction fis re-emitted diffusely. The parameter f in the Maxwell model is identified by the tangential accommodation coefficientσt.
The popularity of the Maxwell model is explained appar-ently by its simplicity and by the fact that it satisfies reci-procity, i.e., the principle of detailed balance. A phenomeno-logical model that also satisfies the reciprocity conditions and has demonstrated improvement over the Maxwell model has been proposed by Cercignani and Lampis [8], known as CL model. This model is based on the definition of two parame-tersαn andσt that represent the accommodation coefficient for the kinetic energy associated with the normal component of velocity, and the parallel momentum accommodation, re-spectively. They are given by the following equations,
αn = ei−er
ei−ew (1)
σt = τi−τr
τi
(2)
whereeandτrefer to the average kinetic energy for the nor-mal component of velocity, and momentum flux acting tan-gential to the surface, respectively; subscripts iandr stand for the incident and reflected components, andwrefers to the component that would be produced by a diffuse reflection at the temperature of the surface.
The CL model provides a continuous spectrum of behavior from specular reflection at one end to diffuse reflection with complete energy accommodation at the other, and produces physically realistic distributions of direction and energy re-emitted molecules.
The probability distribution function for the component of velocity normal to the surface is given by,
Pn(v′n|vn) = 2v′n
αn I0(2
p 1−αn
vnv′n αn
)×
exp[−v
′2
n + (1−αn)v2n αn
] (3)
whereI0 is the modified Bessel function, v′n and vn are the incident and reflect velocity components normalized by the most probable molecular speed at the surface temperature, and defined byp2kTw/m.
The probability distribution function for the component of velocity parallel to the surface is given by,
Pt(vt′|vt) = 1 p
πσt(2−σt) ×
exp{−v
′
t−(1−σt)vt]2 πσt(2−σt)
} (4)
wherev′tandvtare the incident and reflect tangential velocity vector also normalized by the most probable molecular speed at the surface temperature.
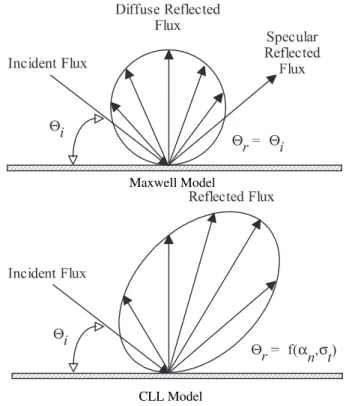
Recently, Lord [7] has presented the implementation of the CL model into the DSMC method, and presented a simple method for generating random sample velocities from Eqs. (3) and (4). The DSMC method with Lord’s implementation is re-ferred as the Cercignani-Lampis-Lord (CLL) model. Fig. 1 displays a schematic comparison of the Maxwell reflection model and the CLL reflection model.
Θ Θ
Θ
Maxwell Model
Θ α σ
Θ
CLL Model
FIG. 1: Drawing illustrating the Maxwell reflection model and the CLL reflection model.
translational energies. The vibrational components of the in-ternal energy require much more time to adjust to new values than do the rotational and translational components. In this connection, Lord [9-11] has also been extended the CL model for simulating the accommodation of vibrational energy of a diatomic molecule.
In order to simulate the partial surface accommodation, the Cercignani-Lampis-Lord (CLL) model [7] was implemented into this DSMC calculation. The CLL model is derived as-suming that there is no coupling between the normal and tan-gential momentum components. The two adjustable parame-ters appearing in the CLL model are the normal component of translational energy αn and the tangential component of momentumσt. However, in the implementation of the CLL model in the DSMC method, Bird [12] has shown that it is equivalent to specify the normalαnand tangentialαt compo-nents of translational energy, sinceαt=σt(2−σt), and thus thatσt<αt, assuming thatσtlies between 0 and 1.
In the present account,αnandσt are used as being the two adjustable parameters. It is important to mention that in the CLL model the accommodation of internal energy is allowed to be independent of the translational accommodation.
Before proceeding with the analysis, it is important to men-tion that many studies have been made using both the CL and the CLL models to analyze the behavior of the reflected molecules. Of particular interest are the application of the CL model described in Ref.[13,14] and those on CLL model dis-cussed in Ref.[15,16].
III. LEADING EDGE GEOMETRY DEFINITION
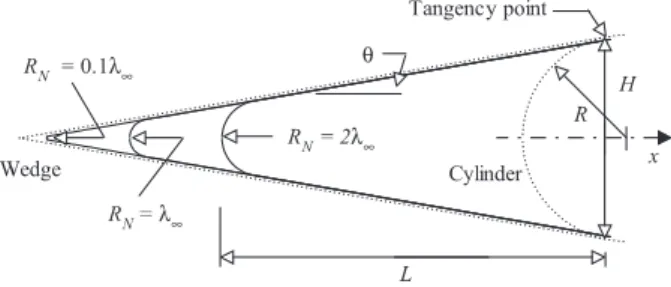
The round leading edges are modeled by assuming a sharp leading edge of half angleθwith a reference circular cylinder of radiusRinscribed tangent to the wedge. The round leading edges are inscribed between the wedge and the cylinder. The circular cylinder diameter provides a reference for the amount of blunting desired on the leading edges. It was assumed a leading edge half angle of 10 degrees and a reference circular cylinder diameter of 10−2m. In addition to the reference cir-cular cylinder, four more circir-cular cylinders with different nose radii were chosen for round leading edges. The dimensionless nose radiusRN/λ∞for the four bodies are 0.02, 0.1, 1 and 2, whereλ∞is the freestream mean free path. Figure 2 illustrates the construction for the round leading edges investigated.
λ∞ θ
λ∞ λ∞
FIG. 2: Drawing illustrating the leading edge geometries.
IV. COMPUTATIONAL METHOD AND PROCEDURE
It is well known that the Direct Simulation Monte Carlo (DSMC) method, introduced by Bird [12] in the 1960’s, has become a reliable and efficient kinetic approach for modeling rarefied gas flows. Typical applications include high altitude rockets plumes, microelectromechanical systems (MEMS) devices, spacecraft propulsion and contamination, low-pressure plasma material-processing reactors, and reen-try vehicles. Although these applications encompass a wide range of spatial and temporal scales, they are united by the same underlying physics of moderate or high Knudsen num-ber flows.
The Knudsen numberKnis de ratio of the gas mean free pathλ to the characteristic length scalel of the problem. It is generally accepted that the rarefied transition flow regime lies in the range of 0.01<Kn<10. The transition regime is the category of flow that falls between the continuum regime, where the Navier-Stokes equations are valid, and the free molecular regime, which is the limit of infinite Knudsen num-ber. Currently, mathematical modeling of flows in the transi-tion flow regime is supposed to be based on the solutransi-tion of the Boltzmann equation [17] or on the DSMC method [12].
The DSMC method employs thousands or millions of rep-resentative molecules in order to reproduce the behavior of a far larger number of real molecules within the flow. The strategy of the method is to directly track the molecular tra-jectory and status based on the collision mechanics to model molecules in a computer and then obtain physical quantities of interest through statistical sampling.
The fundamental assumption employed in the DSMC method is that the movement of the molecules in a dilute gas can be decoupled from the collisions between the molecules if a sufficient small time step is employed. The time step has to be selected in such a way that the distance traveled by a molecule during each time step is smaller than the mean free time [18,19] between collision of the real gas.
Collisions in the present DSMC code are modeled by us-ing the variable hard sphere (VHS) molecular model [20] and the no time counter (NTC) collision sampling technique [21]. Repartition energy among internal and translational modes is controlled by the Borgnakke-Larsen statistical model [22]. Simulations are performed using a non-reacting gas model for a constant freestream gas composition consisting of 76.3% of N2and 23.7% of O2. Energy exchanges between the transla-tional and internal modes, rotatransla-tional and vibratransla-tional, are con-sidered. Relaxation collision numbers of 5 and 50 were used for the calculations of rotation and vibration, respectively.
y
Side 1 Side
3
S
ide
4
Side 2 Flow
x
H/2 R
L
FIG. 3: Schematic view of the computational domain.
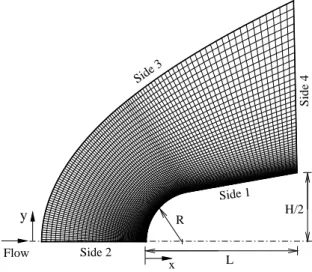
The computational domain used for the calculation is made large enough so that body disturbances do not reach the up-stream and side boundaries, where freeup-stream conditions are specified. A schematic view of the computational domain is depicted in Fig. 3. Based on this figure, side 1 is defined by the body surface. Reflection with incomplete surface accom-modation is the condition applied to this side. Advantage of the flow symmetry is taken into account, and molecular simu-lation is applied to one-half of a full configuration. Thus, side 2 is a plane of symmetry. In such a boundary, all flow gradi-ents normal to the plane are zero. At the molecular level, this plane is equivalent to a specular reflecting boundary. Side 3 is the freestream side through which simulated molecules enter and exit. Finally, the flow at the downstream outflow bound-ary, side 4, is predominantly supersonic and vacuum condition is specified [25]. At this boundary, simulated molecules can only exit.
The numerical accuracy in DSMC method depends on the cell size chosen, on the time step as well as on the number of particles per computational cell. These effects were in-vestigated in order to determine the number of cells and the number of particles required to achieve grid independence so-lutions. Grid independence was tested by running the calcula-tions with half and double the number of cells, along the body surface and off-body surface, and then compared to a standard grid. Solutions were near identical for all grids used and were considered fully grid independent. Details are given in the appendix.
No attempt has been made to compare the results of the present calculations with such experimental results as exist. Most of these have been obtained in wind-tunnel environ-ments where no control of surface condition is possible and surface would be expected to be highly contaminated and to exhibit virtually complete accommodation. Moreover, the rel-ative few experiments in which effects of partial accommoda-tion appear have all used helium rather that air.
V. FREESTREAM AND FLOW CONDITIONS
The flow conditions represent those experienced by a space-craft at an altitude of 70 km. This altitude is associated with the transition flow regime, which is characterized by the over-all Knudsen number of the order of or larger than 10−2. The freestream conditions are summarized in Table I, and the gas properties [12] are shown in Table II.
TABLE I: Freestream and flow conditions
Parameter Value Unit
Altitude 70 km
Temperature (T∞) 220.0 K Pressure (p∞) 5.582 N/m2 Density (ρ∞) 8.753×10⁻⁵ kg/m3 Viscosity (µ∞) 1.455×10⁻⁵ Ns/m2 Number density (n∞) 1.8209×10²¹ m−3 Mean free path (λ∞) 9.03×10⁻⁴ m
TABLE II: Gas properties
Parameter O2 N2 Unit
Molecular mass 5.312×10⁻²⁶ 4.65×10⁻²⁶ kg Molecular diameter 4.010×10⁻¹⁰ 4.11×10⁻¹⁰ m Mole fraction 0.237 0.763
Viscosity index 0.77 0.74
The freestream velocityV∞ is assumed to be constant at 3.56 km/s, which correspond to a freestream Mach number M∞ of 12. The translational and vibrational temperatures in the freestream are in equilibrium at 220 K, and the leading-edge surface has a temperatureTwof 880 K for all cases con-sidered. This temperature is chosen to be representative of the surface temperature near the stagnation point and is assumed to be uniform over the bodies. It is important to mention that the surface temperature is low compared to the stagna-tion temperature of the air. This assumpstagna-tion seems reasonable since practical surface material will probably be destroyed if surface temperature is allowed to approach stagnation temper-ature.
By assuming the nose diameter as the characteristic length, the overall Knudsen numberKnD corresponds to 25, 5, 0.5, 0.25 and 0.09 for nose radiusRN/λ∞ of 0.02, 0.1, 1, 2 and 5.5, respectively. The Reynolds number per unit of meter is Re∞ = 21416.3, also based on conditions in the undisturbed stream.
αnandσt are used as being the two adjustable parameters. The DSMC calculations were performed independently for three distinct numerical values for αnandσt: 0.5, 0.75 and 1. Therefore, whenαnis equal to 0.5 or 0.75,σt is set equal to 1, and vice-versa. It is important to mention thatαnandσt equal to 1 represent the diffusion reflection case.
VI. COMPUTATIONAL RESULTS AND DISCUSSION
The aerodynamic performance of the round leading edges is assessed by using the heat transfer rate, the total drag and the shock wave standoff distance. In this way, the purpose of this section is to discuss differences in these properties due to variations on the surface accommodation coefficients of these bodies with different nose radius.
A. Heat Transfer Coefficient
Energy may be added to or subtracted from the body surface by three distinct processes: (1) molecular energy transport to and from the body surface, (2) radiant energy transport to and from the body surface, and (3) energy added to or removed from the surface by processes occurring within the body. By considering process (1), the heat fluxqwto the body surface is calculated by the net energy flux of the molecules impinging on the surface. A flux is regarded as positive if it is directed toward the surface. The net heat fluxqwis related to the sum of the translational, rotational and vibrational energies of both incident and reflected molecules as defined by,
qw=qi+qr= N
∑
j=1 [1
2mjc 2
j+eR j+eV j]i +
N
∑
j=1 [1
2mjc 2
j+eR j+eV j]r (5) whereNis the number of molecules colliding with the surface by unit time and unit area,mis the mass of the molecules,c is the velocity of the molecules,eRandeV stand for the rota-tional and vibrarota-tional energies, respectively, and subscriptsi andrrefer to incident and reflect molecules.
In the following, the heat transfer coefficientChis defined by,
Ch= qw ρ∞V∞3/2
(6)
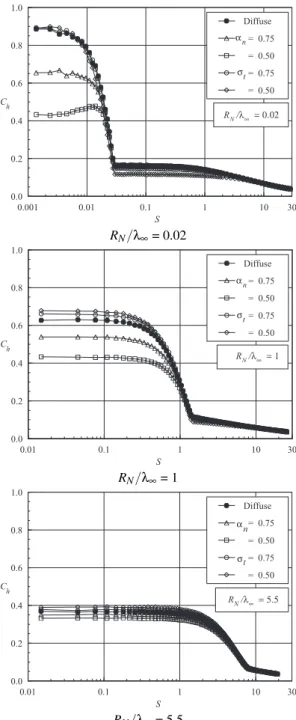
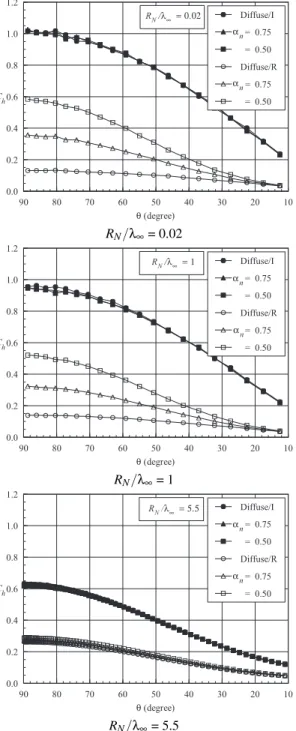
Distributions of the heat transfer coefficientCh along the round leading edge surface are illustrated as a function of the accommodation coefficients in Figs. 4(a-c) for nose radius RN/λ∞of 0.02, 1 and 5.5, respectively. In this set of figures, Sis the arc lengthsnormalized by the freestream mean free pathλ∞measured from the stagnation point. The heat transfer coefficientChforRN/λ∞ of 0.1 and 2 is intermediate to the cases shown in this set of figures, therefore they will not be
presented. Once again, it is important to emphasize that the accommodation coefficient effects are investigated in an inde-pendent way. For instance, the curve corresponding toαn= 0.5 or 0.75 in Figs. 4(a-c) represents the situation ofαn= 0.5 or 0.75 withσt = 1. Similarly, the curve corresponding toσt = 0.5 or 0.75 represents the caseσt= 0.5 or 0.75 withαn= 1.
λ∞ = 0.02 α
σ
RN/λ∞= 0.02
λ∞ = 1 α
σ
RN/λ∞= 1
λ∞ = 5.5 α
σ
RN/λ∞= 5.5
FIG. 4: Distributions of the heat transfer coefficientCh along the
body surface as a function of the accommodation coefficient for round leading edges withRN/λ∞of (a) 0.02, (b) 1 and (c) 5.5.
the stagnation point and drops off sharply along the cylindri-cally blunt portion up to the cylinder/wedge junction. It is noted from this set of figures that the heat transfer coefficient decreases by a reduction in the normal accommodation coef-ficient and it increases with reducing the tangential accommo-dation coefficient. Moreover, either the normal or tangential accommodation coefficient affects the leading edges in a dif-ferent way as the nose radiusRN/λ∞is reduced from 5.5 to 0.02. In addition to that, the heat transfer coefficient at the stagnation region decreases with increasing the nose radius. This behavior seems to be in agreement with the continuum predictions for blunt body in that the heat flux scales inversely with the square root of the nose radius. As expected, by re-ducing the nose radius the leading edge becomes sharper and approaches the wedge leading edge as shown in Fig. 2.
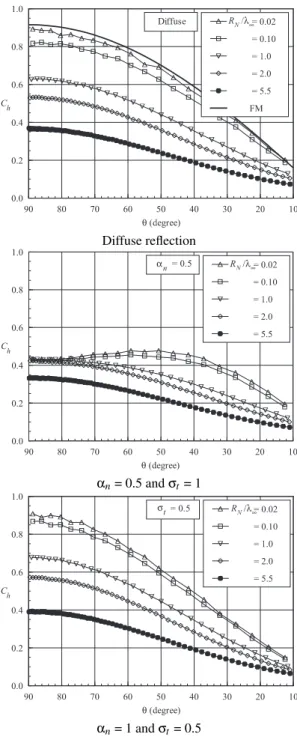
Effects of both the incomplete surface accommodation and the nose radius on the heat transfer coefficientChcan also be seen in a different way by displaying the results as a function of the body slope angleθ. Figures 5(a-c) depict the heat trans-fer coefficient on the cylindrically portion of the leading edges as a function of the body slope angle for diffuse case,αnof 0.5 (withσt = 1) and σt of 0.5 (withαn= 1), respectively. For comparison purpose, Fig. 5(a) presents the heat transfer coefficientChby assuming free-molecule (FM) flow [12].
Referring to Fig. 5(a), it is noted that the heat transfer coef-ficient approaches the free molecular limit (Cho= 0.915) in the cylindrically portion of the round leading edge with reducing the nose radius. It is clearly seen in Figs. 5(a-c) that the heat transfer coefficient profiles are preserved for the majority of the cases investigated. In general the heat transfer coefficient presents the maximum value at the stagnation region and de-creases along the cylindrically portion of the leading edges. However, for cases withRN/λ∞of 0.02 and 0.1, andαnof 0.5 (see Fig. 5(b)), the maximum point moves from the stagnation point, which corresponds to stationθ= 90 degrees, to station aroundθ= 50 degrees. In an effort to emphasize this behavior, the incident and reflect heat flux contributions to the net heat transfer coefficient are shown separately.
The incidentChiand reflectedChrheat transfer coefficient distributions along the cylindrically portion of the round lead-ing edges for RN/λ∞ of 0.02, 0.1 and 5.5 are illustrated in Figs. 6(a-c), respectively. In this set of diagrams, full and empty symbols stand for the incident and reflected heat trans-fer coefficients, respectively. It is observed from these figures that the incident heat transfer coefficients are not affected by changes in the normal accommodation coefficient. In contrast, the reflected heat flux increases with reducing the normal ac-commodation coefficient. In addition, the reflected heat flux is sensitive to the leading edge shape in that it presents a larger value at the stagnation region for sharp leading edge than that for blunt leading edge.
At this point, it seems important to quantify the heat trans-fer at the stagnation point. The heat transtrans-fer coefficient at the stagnation pointCho is displayed in Table III for the range of nose radius investigated. These values were obtained by a curve fitting process performed over the curves shown in Figs. 5(a-c).
θ
λ∞
Diffuse reflection
θ
λ∞ α
αn= 0.5 andσt= 1
θ
λ∞ σ
αn= 1 andσt= 0.5
FIG. 5: Distribution of the heat transfer coefficientCh along the
cylindrically portion of the round leading edges by considering (a) diffuse reflection, (b)αn = 0.5 andσt= 1, and (c)αn= 1 andσt =
0.5.
B. Total Drag Coefficient
The total drag coefficient is defined as being, Cd=
D ρ∞V∞2H/2
(7)
θ
λ∞ = 0.02 α
α
RN/λ∞= 0.02
θ
λ∞ = 1 α
α
RN/λ∞= 1
θ
λ∞ = 5.5 α
α
RN/λ∞= 5.5
FIG. 6: Distribution of the incident and reflected contributions of the heat transfer coefficientChalong the cylindrically portion of the
round leading edges withRN/λ∞of (a) 0.02, (b) 1 and (c) 5.5.
The dragDon a surface in a gas flow results from the inter-change of momentum between the surface and the molecules colliding with the surface. The resultant force acting on the body surface is obtained by the integration of the pressurepw and shear stressτwdistributions along the body surface. In this connection,pwandτwdistributions were considered from the nose of the leading edge to the stationL(see Fig. 2), which corresponds to the tangent point common to all of the body shapes. The total drag presented in this section was obtained by assuming the shapes acting as leading edges. As a result,
TABLE III: Heat transfer coefficient at the stagnation pointCho for
round leading edges.
RN/λ∞ 0.02 0.1 1 2 5.5
Diffuse 0.883 0.824 0.630 0.532 0.366 αn= 0.75,σt= 1 0.660 0.662 0.537 0.484 0.352
αn= 0.50,σt= 1 0.436 0.433 0.429 0.424 0.333
αn= 1,σt= 0.75 0.894 0.859 0.660 0.553 0.377
αn= 1,σt= 0.50 0.904 0.868 0.676 0.571 0.391
no base pressure effects were taken into account on the calcu-lations.
Before presenting the results for the total drag coefficient acting on the round leading edges, it proves helpful to visual-ize the manner in which the two accommodation coefficients as well as the nose radius affect pressurepwand shear stress τwdistributions along the body surfaces.
The pressure pw on the body surface is calculated by the sum of the normal momentum fluxes of both incident and re-flected molecules at each time step as follows,
pw=pi+pr= N
∑
j=1
{[mjcηj]i+ [mjcηj]r} (8)
wherecηis the normal velocity component of the molecules colliding with the body surface.
The influence on wall pressure due to variations on the nose radius and on the surface accommodation coefficient is demonstrated in Fig. 7 in terms of the pressure coefficientCp defined by the following equation,
Cp=
pw−p∞ ρ∞V∞2/2
(9)
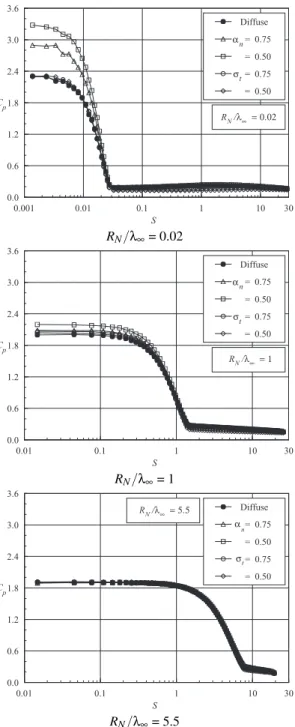
The variation of the pressure coefficient Cp caused by changes on the surface accommodation coefficient is demon-strated in Figs. 7(a-c) forRN/λ∞of 0.02, 0.1 and 5.5, respec-tively. According to Figs. 7(a-c), it is seen that the pressure coefficientCpfollows the same trend as that presented by the heat transfer coefficientCh in that it presents the maximum value at the stagnation point and decreases fast in the cylindri-cally blunt portion of the leading edges.
might be that the molecules that are reflected upstream have a high kinetic energy with the partial accommodation model and, thus, when they re-collide with the surface, they will im-part a greater normal moment transfer. Moreover, it may also be recognized from Figs. 7(a-c) that the pressure coefficient is insensitive to changes on the tangential accommodation coef-ficientσt.
λ∞ = 0.02 α
σ
RN/λ∞= 0.02
λ∞ = 1 α
σ
RN/λ∞= 1
α
σ λ∞ = 5.5
RN/λ∞= 5.5
FIG. 7: Distributions of pressure coefficientCpalong the body
sur-face as a function of the accommodation coefficient for round leading edges withRN/λ∞of (a) 0.02, (b) 1 and (c) 5.5.
The shear stressτwon the body surface is calculated by the sum of the tangential momentum fluxes of both incident and reflected molecules impinging on the surface at each time step
by the following expression,
τw=τi+τr= N
∑
j=1
{[mjcξj]i+ [mjcξj]r} (10)
wherecξ is the tangential velocity component of the mole-cules colliding with the body surface.
The impact on wall shear stress due to variations on the nose radius and on the surface accommodation coefficient is displayed in Fig. 8 in terms of the skin friction coefficientCf defined as follows,
Cf = τw ρ∞V∞2/2
(11)
It is worthwhile to note that for the special case of diffuse reflection,αnandσt equal to 1, the reflected molecules have a tangential moment equal to zero, since the molecules es-sentially lose, on average, their tangential velocity compo-nents. In this fashion, the contribution of the reflected tan-gential momentum fluxτr that appears in Eq. (10) is equal to zero. Nevertheless, for incomplete surface accommodation, the reflected tangential momentum fluxτr contributes to the skin friction coefficient.
The dependence of the skin friction coefficientCfattributed to variations on the surface accommodation coefficient is de-picted in Figs. 8(a-c) forRN/λ∞of 0.02, 0.1 and 5.5, respec-tively. Based on this set of figures, the skin friction coefficient Cf increases from zero at the stagnation point to a maximum value that is still located in the cylindrically blunt portion of the leading edges, and decreases downstream along the body surface. It is also seen that the skin friction coefficient presents an opposite behavior from that of pressure coefficient in the sense that it decreases with reducing the tangential accommo-dation coefficientσt. Furthermore, no changes are observed in the skin friction coefficient for a reduction on the normal accommodation coefficientαn from 1 to 0.5. Also of great significance is the skin friction changes on the afterbody sur-face with diminishing the tangential accommodation coeffi-cientσt, in contrast to the pressure coefficient behavior.
The differences in the pressureCpand in the skin friction Cf coefficients observed for variations on the normalαnand tangential σt accommodation coefficients as well as on the nose radiusRN have been presented in Figs. 7 and 8. In what follows, it becomes instructive to present the results for the total drag coefficientCd, obtained by the integration of the pressurepw and shear stressτw distributions along the body surface.
λ∞ = 0.02 α
σ
RN/λ∞= 0.02
λ∞ = 1 α
σ
RN/λ∞= 1
α
σ
λ∞ =5.5
RN/λ∞= 5.5
FIG. 8: Distributions of skin friction coefficientCf along the body
surface as a function of the accommodation coefficient for round leading edges withRN/λ∞of (a) 0.02, (b) 1 and (c) 5.5.
of 5.5, the major contribution to the total drag coefficient is attributed to the pressure, a blunt leading edge characteristic.
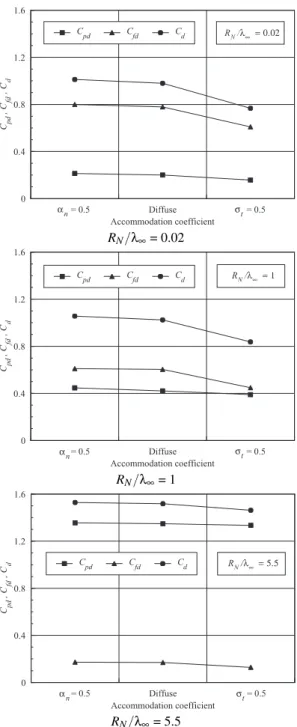
In what follows, the effect of changing independently the normal αn and tangentialσt accommodation coefficients on the total drag coefficientCdfor the round leading edges inves-tigated is tabulated in Table IV.
Referring to Table IV, it can be seen that variations onαnor σthave a different effect on the total drag coefficientCd. The total drag coefficientCd increases around 2% or 3% by a re-duction in the normal accommodation coefficientαn, and
sig-λ∞ = 0.02
α σ
RN/λ∞= 0.02
λ∞ = 1
α σ
RN/λ∞= 1
λ∞ = 5.5
α σ
RN/λ∞= 5.5
FIG. 9: Pressure dragCpd, skin friction dragCf dand total drag
co-efficientCdas a function of the accommodation coefficient for round
leading edges withRN/λ∞of (a) 0.02, (b) 1 and (c) 5.5.
TABLE IV: Total Drag coefficientCdfor round leading edges.
RN/λ∞ 0.02 0.1 1 2 5.5
Diffuse 0.978 0.979 1.028 1.085 1.519 αn= 0.75,σt= 1 0.994 0.995 1.039 1.144 1.523
αn= 0.50,σt= 1 1.011 1.012 1.057 1.158 1.528
αn= 1,σt= 0.75 0.908 0.910 0.957 1.074 1.496
αn= 1,σt= 0.50 0.766 0.767 0.837 0.975 1.462
VII. SHOCK-WAVE STANDOFF DISTANCE
The problem of predicting the shape and location of de-tached shock waves has been stimulated by the necessity for blunt noses and leading edges configurations designed for hy-personic flight in order to cope with the aerodynamic heating. Also, the ability to predict the shape and location of shock waves is of primary importance in analysis of aerodynamic interference.
In a rarefied flow, the shock wave has a finite region that depends on the transport properties of the gas, and can no longer be considered as a discontinuity obeying the classi-cal Rankine-Hugoniot relations. In this context, the shock standoff distance is defined as being the distance between the shock-wave center and the nose of the leading edge along the stagnation streamline.
In order to quantify the shock standoff distance, the shock-wave center (shock-shock-wave location) is determined by employ-ing the followemploy-ing procedure [26]: the flow is assumed to con-sist of three distinct classes of molecules; those molecules from the freestream that have not been affected by the pres-ence of the leading edge are denoted as class I molecules; those molecules that, at some time in their past history, have struck and been reflected from the body surface are denoted as class II molecules; and those molecules that have been indi-rectly affected by the presence of the body are defined as class III molecules.
It is assumed that the class I molecule changes to class III molecule when it collides with class II or class III mole-cule. Class I or class III molecule is progressively transformed into class II molecule when it interacts with the body sur-face. Also, a class II molecule remains class II regardless of subsequent collisions and interactions. Hence, the transition from class I molecules to class III molecules may represent the shock wave, and the transition from class III to class II defines the boundary layer.
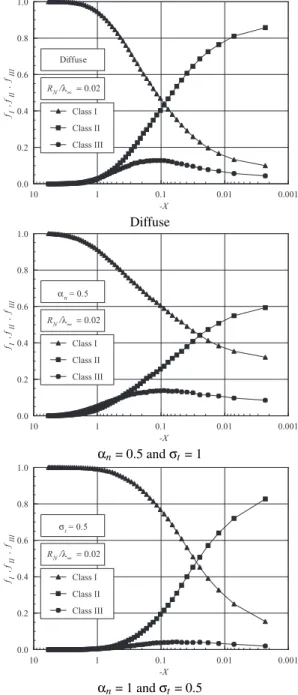
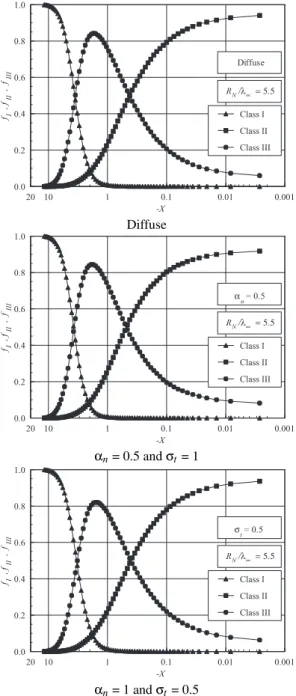
For illustration purpose, the distribution of molecules for each class along the stagnation streamline associated to sharp and blunt leading edges are demonstrated in Figs. 10 and 11, respectively. The impact of the surface accommodation on class I, II and II, related to round leading edge with RN/λ∞ of 0.02 is demonstrated in Figs. 10(a-c) for diffuse case,αn of 0.5 (withσt = 1) andσt of 0.5 (withαn= 1), respectively. Similarly, Figs. 11(a-c) display the effect of the surface
ac-λ∞ = 0.02
Diffuse
λ∞ = 0.02
α
αn= 0.5 andσt= 1
λ∞ = 0.02
σ
αn= 1 andσt= 0.5
FIG. 10: Distributions of molecules for classes I, II and III along the stagnation streamline for the round leading edge case withRN/λ∞= 0.02: (a) diffuse reflection, (b)αn= 0.5 andσt = 1, and (c)αn= 1
andσt= 0.5.
λ∞ = 5.5
Diffuse
λ∞ = 5.5
α
αn= 0.5 andσt= 1
λ∞ = 5.5
σ
αn= 1 andσt= 0.5
FIG. 11: Distributions of molecules for classes I, II and III along the stagnation streamline for the round leading edge case withRN/λ∞= 5.5: (a) diffuse reflection, (b)αn= 0.5 andσt= 1, and (c)αn= 1 and
σt= 0.5.
By examining Figs. 10 and 11, it is clearly seen that there is a discrete shock standoff distance for the cases shown. It is also seen that partial accommodation coefficient affects the shock-wave standoff distance along the stagnation stream-line provided the leading edge is aerodynamically sharp, for instance, RN/λ∞ = 0.02 case. In contrast, no apprecia-ble changes are observed for the bluntest case investigated, RN/λ∞= 5.5, as either the normalαnor tangentialσt accom-modation coefficient is reduced from 1 to 0.5.
Of great significance in Figs. 10 and 11 is the behavior of the class I molecules for sharp and blunt leading edges.
α
∆
λ∞
λ∞ σ
FIG. 12: Dimensionless shock wave standoff distance∆/λ∞along the stagnation streamline for round leading edges as a function of the normal and tangential accommodation coefficients.
It should be observed that molecules from freestream, repre-sented by class I molecules, collide with the nose of the lead-ing edges even after the establishment of the steady state. This is shown in Figs. 10, which represent the sharp leading edge case. In contrast, molecules from freestream basically do not reach the nose of the leading edge for those cases illustrated in Figs. 11, which represent blunt leading edges. This is ex-plained by the fact that density increases much more at the vicinity of the stagnation region for blunt leading edges, and reaches its maximum value in the stagnation point. In this connection, the buildup of particle density near the nose of the leading edge acts as a shield for the molecules coming from the undisturbed stream. Consequently, the heat flux at the stagnation point for sharp leading edge is higher than that for blunt leading edge, as shown in Table III.
The impact of changing independently the normal and tan-gential accommodation coefficients on the shock-wave stand-off distance∆for the round leading edges investigated is il-lustrated in Fig. 12, and the values are tabulated in Table V, normalized by the freestream mean free pathλ∞.
TABLE V: Dimensionless shock wave standoff distance∆/λ∞ for round leading edges.
RN/λ∞ 0.02 0.1 1 2 5.5
Diffuse 0.114 0.226 0.598 0.845 1.645 αn= 0.75,σt= 1 0.104 0.260 0.727 0.956 1.728
αn= 0.50,σt= 1 0.096 0.249 0.858 1.075 1.805
αn= 1,σt= 0.75 0.074 0.159 0.551 0.818 1.620
αn= 1,σt= 0.50 0.058 0.117 0.504 0.757 1.541
with the curvature radius. As a reference, the bluntest leading edge,RN/λ∞= 5.5 case, presents values for∆/λ∞that are one order of magnitude larger than that for the sharpest leading edge investigated,RN/λ∞= 0.02 case.
It is worthwhile mentioning that the displacement of the shock wave is especially undesirable in a waverider vehi-cle, because this hypersonic configuration usually depends on shock wave attachment at the leading edge to achieve its high lift-to-drag ratio at high-lift coefficient. Shock wave detach-ment will allow pressure leakage from the lower surface of the vehicle to the upper surface, thereby degrading the aero-dynamic performance of the vehicle.
VIII. CONCLUDING REMARKS
Direct Simulation Monte Carlo method is applied to exam-ine rarefied gas over a group of round leading edges. Effects of incomplete surface accommodation on the heat transfer, to-tal drag and shock-wave standoff distance for a representative range of normal and tangential accommodation coefficients are investigated. The normal and tangential accommodation coefficients are varied from 1.0 to 0.5, and the nose radius considered in this study covers hypersonic flow from the tran-sition flow regime to the free molecular flow regime.
Calculations showed that a reduction in the normal accom-modation coefficient from 1.0 to 0.5 decreased the heat
trans-fer coefficient at the vicinity of the stagnation point for the round shapes investigated. In contrast, a reduction in the tan-gential accommodation coefficient increased slightly the heat transfer coefficient near the nose of the leading edges. Also, it was found that the total drag coefficient is reduced by a re-duction in the tangential accommodation coefficient, and in-creased by a reduction in the normal accommodation coeffi-cient.
The analysis also showed that the shock standoff distance is sensitive to changes on the surface accommodation coeffi-cient. In general, it was observed that shock wave standoff distance decreased by a reduction on the tangential accom-modation coefficient and increased with reducing the normal accommodation coefficient.
The effects of either normal or tangential accommodation coefficient showed that in order to make accurate predictions of the aerodynamic forces on, and heat transfer rates to, bodies in rarefied hypersonic flow it will be necessary to take surface accommodation into account.
The calculations presented in this work have only covered a limited number of parametric variations. Further calcula-tions with additional combinacalcula-tions of normal and tangential accommodation coefficients or where the internal energy ac-commodation is varied independently might provide more in-sight into the sensitivity of the aerothermodynamic quantities to gas-surface model.
[1] T. R. F. Nonweiler, J. Roy. Aero. Soc.,63, 521 (1959). [2] J. L. Anderson, inProceedings of the 1st International
Hyper-sonic Waverider Symposium, Univ. of Maryland, College Park, MD, 1990.
[3] J. L. Potter and J. K. Rockaway, inRarefied gas Dynamics: Space Science and Engineering, edited by B. D. Shizgal and D. P. Weaver, Progress in Astronautics and Aeronautics, AIAA New York,160, 296 (1994).
[4] D. F. G. Rault, J. Space. Rockets,31, 719 (1994).
[5] R. E. Graves and B. M. Argrow, in35th AIAA Thermophysics Conference, AIAA Paper 2001-2960, Anaheim, CA, 2001. [6] A. I. Shvets, V. I. Voronin, I. M. Blankson, V. Khikine, and
L. Thomas, in43rd AIAA Aerospace Sciences Meeting and Ex-hibit, AIAA Paper 2005–0512, Reno, NV, 2005.
[7] R. G. Lord, in17th International Symposium on Rarefied Gas Dynamics, edited by A. E. Beylich, Aachen, Germany, 1991. [8] C. Cercignani and M. Lampis, Trans. Theor. Stat. Phys.,1, 101
(1971).
[9] R. G. Lord, Phys. Fluids, A3, 706 (1991).
[10] R. S. Simmons and R. G. Lord, in19th International Sympo-sium on Rarefied Gas Dynamics, edited by J. Harvey and G. R. Lord, Oxford, 1994.
[11] R. G. Lord, Phys. Fluids,7, 1159 (1995).
[12] G. A. Bird,Molecular Gas Dynamics and the Direct Simulation of Gas Flows, Oxford University Press, Oxford, England, UK, 1994.
[13] C. Cercignani, Trans. Theor. Stat. Phys.,72, 27 (1972).
[14] F. Sharipov, J. Fluid Mech.,518, 35 (2004).
[15] M. S. Woronowicz and D. F. G. Rault, J. Space. Rockets,31, 532 (1994).
[16] M. O. Hedahl and R. G. Wilmoth,NASA TM-110205, 1995. [17] C. Cercignani,The Boltzmann Equation and Its Applications,
Springer-Verlag, New York, NY, 1988.
[18] A. L. Garcia and W. Wagner, Phys. Fluids,12, 2621 (2000). [19] N. G. Hadjiconstantinou, Phys. Fluids,12, 2634 (2000). [20] G. A. Bird, inProgress in Astronautics and Aeronautics:
Rar-efied gas Dynamics, edited by Sam S. Fisher, AIAA New York,
74, 239 (1981).
[21] G. A. Bird, inRarefied gas Dynamics: Theoretical and Compu-tational Techniques, edited by E. P. Muntz, D. P. Weaver, and D. H. Campbell, Progress in Astronautics and Aeronautics, AIAA, New York,118, 374 (1989).
[22] C. Borgnakke and P. S. Larsen, J. Comp. Phys.,18, 405 (1975). [23] F. J. Alexander, A. L. Garcia, and B. J.Alder, Phys. Fluids,10,
1540 (1998).
[24] F. J. Alexander, A. L. Garcia, and B. J.Alder, Phys. Fluids,12, 731 (2000).
[25] K. Guo and G.-S. Liaw, inProceedings of the 35th AIAA Ther-mophysics Conference, AIAA Paper 2001-2953, Anaheim, CA, 2001.