Cortical representation of the horizon in V1 and peripheral
scaling in mammals with lateral eyes
Cristovam W. Picanço-Diniz
1, Emiliana G. Rocha
1, Luiz Carlos L. Silveira
1, Guy Elston
2and
Eduardo Oswaldo-Cruz
31 - Universidade Federal do Pará, Belém, PA, Brazil
2 - Centre for Cognitive Neuroscience, Sunshine Coast, QLD, Australia
3 - Universidade Federal do Rio de Janeiro, Rio de Janeiro, RJ, Brazil
Abstract
In the present investigation we mapped the primary visual area of the South American diurnal rodent, Dasyprocta aguti, by standardized electrophysiological mapping techniques. In particular, we performed a series of mapping experiments of the visual streak in the primary visual cortex. We found that the representation of the visual streak in V1 is greatly expanded, the nasal 10 degrees of the visual streak representation occupies ten times more cortical area than equivalent areas in the central or temporal representation. Comparison of these data with those on the density of ganglion cells in the retina at corresponding locations in the visual ield reveal a signiicant mismatch between these two variables. The nasal representation is greatly expanded along the horizontal meridian in V1 as compared to the central and temporal regions whereas the density of ganglion cells decreases with progression along the visual streak from central region towards the nasal or temporal visual ield. A review of the available data reveals that all lateral-eyed mammals exhibit a similar mismatch between the retinal and cortical representation of the visual ield, and this mismatches is greater in those species with well deined visual streaks such as rabbit and agouti. KeyWords: horizontal meridian, V1 map, retinal ganglion cells, lateral-eyed mammals
Received 14 June 2011; received in revised form 29 June 2011; accepted 30 June 2011. Available on line 30 June 2011
Cristovam Wanderley Picanço-Diniz, MD, PhD, Laboratory of Neurodegeneration and Infection, Federal University of Pará, Brazil. Emiliana G. Rocha, Universidade Federal do Pará, Belém, PA, Brazil. Luiz Carlos L. Silveira, Universidade Federal do
Pará, Núcleo de Medicina Tropical, Belém, Brazil. Guy Elston,
Centre for Cognitive Neuroscience, Sunshine Coast, Queensland 4562, Australia. and Eduardo Oswaldo-Cruz, Universidade Federal do Rio de Janeiro, Instituto de Biofísica Carlos Chagas Filho, Rio de Janeiro, Brazil. Correspondence regarding this article should be directed to: Cristovam Wanderley Picanço-Diniz- Hospital Universitário João de Barros Barreto, Rua dos Mundurucus 4487, 66073-000 Belém/PA, Brazil. Phone: +55 91 3201-7741. E-mail: [email protected]
Introduction
Previously we reported on the cytoarchitecture, myeloarchitecture and visuotopic representation of the primary visual area (V1 or area 17) in the South American diurnal rodent Dasyprocta aguti, and compared the visuotopic representation in V1 with ganglion cell density in the corresponding topographic location in the retina (Picanco-Diniz, Silveira, Carvalho, &Oswaldo-Cruz, 1991; Picanço-Diniz, Silveira, &Oswaldo-&Oswaldo-Cruz, 1992). Of particular note was the prominent and asymmetric representation of the horizontal meridian
in V1, corresponding to the elongated visual streak of the retina. As previously described to the rabbit (Hughes, 1971), asymmetries of the representation of the contralateral visual streak representation on agouti area 17 do not match the retinal ganglion-cell regional densities. On the other hand an expanded horizontal meridian has been reported in V1 of the guinea pig (Cavia porcellus), despite the poorly developed visual
streak in this species (Choudhury, 1978). Thus, it remains
unknown whether this apparent mismatch between a well developed visual streak in the retina and an expanded and asymmetric horizontal meridian representation in
V1 in rodents relect variation among species or result
from different interpretation of early mapping studies. Here we remapped the cortical representation of the horizontal meridian in V1 of the agouti and reviewed the literature to add clarity to the data. We performed a series of electrophysiological mapping experiments, with individual electrode penetrations at closely spaced intervals, along the horizontal meridian in the agouti
V1 and conirmed earlier reports of an expanded and
asymmetric representation. Our comparative survey review indicates that a mismatch between the retinal
and cortical representation of the nasal visual ield is
Material and methods
Animals
We used six adult male agoutis (Dasyprocta aguti), obtained from the Museu Paraense Emílio Göeldi animal colony in the present study. All efforts were made to avoid animal suffering and to reduce the number of specimens
used. The use of agoutis was in accordance with
guidelines from the Brazilian Institute of the Environment and Renewable Natural Resources (IBAMA) (license 207419-0030/2003). All experimental procedures were carried out strictly in accordance with the NIH Guide for the Care and Use of Laboratory Animals.
Electrophysiological mapping
Electrophysiological mapping techniques have been described in detail elsewhere (Picanco-Diniz et
al., 1991). Briely, the animals were anesthetized with
a mixture of 5% ketamine chloridrate (Ketalar, Parke-Davis) and 2% xylazine chloridrate (Rompum, Bayer) (i.m.). A stable anesthetic level was obtained using 1 ml of the mixture/kg of body weight at 2 h intervals.
Multiunit receptive ields were deined as the regions on the visual ield where light stimulation, with hand-held
cards drifted tangentially to the visual hemisphere, evoked
changes in neuronal activity. Tungsten microelectrode and the differential ampliier were used to record action
potentials from small clusters of neurons. When moving the electrode to an adjacent location in the cortex, a systematic
shift in the corresponding receptive ield location was encountered. The electrode was moved in 500 µm steps
mediolateral and anteroposterior. A complete topographic map was obtained with a large number of electrode
penetrations exploring the visual ield representation
in such a way that the limits of the horizontal meridian
cortical area (± 10º lat) were clearly deined.
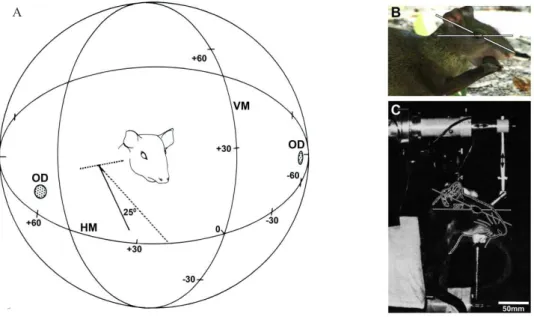
What is apparent from the behavior of these animals is that the horizon is projected onto the visual streak in the retina when these animals are seated on their haunches eating food clutched in their front paws (Silveira et al.,
1989). This head position in anestethized subjects was reproduced in the head holder orienting the line deined by
the palpebral cleft at 25° inclined in relation to the horizon
(Figure 1). The animals secured in the stereotaxic holder
had the right eye aligned with reference to an oculocentric equatorial azimuthal coordinate system. In this system, the vertical meridian roughly corresponded to the nasotemporal retinal decussation and the horizontal meridian corresponds to the visual streak (Silveira et al., 1989). Cycloplegia and mydriasis were obtained with 1% atropine sulfate applied
to the eyes. The cornea was protected with a thin layer of silicone luid (Dow Corning 200/350). The position of the optic disk on the visual ield was checked throughout the
experiment by means of a reversible ophthalmoscope.
Figure 1. Relative position of the visual streak projection in the visual ield. A: Diagrammatic representation of the relative position of the vertical meridian (VM), horizontal meridian (HM) and optic disks (OD). The eye was aligned with reference to an equatorial azimuthal coordinate system. A horizontal plane intersecting the corneal vertex of both eyes was made to coincide with the equatorial horizontal plane of a transparent hemisphere. The center of curvature of the hemisphere was made to coincide with the anterior nodal point of the right eye (Silveira, 1985). In this situation the parasagital plane containg the right eye’s anterior nodal point corresponds to the zero-degree vertical meridian of the coordinate system. B: Picture of an agouti (Dasyprocta prymnolopha) in typical feeding posture. Note that agouti is a lateral-eyed mammal with a large monocular ield. In typical feeding posture agouti’s palpebral cleft present an angle of approximately 25º with the horizontal plane and the visual streak is aligned to the horizon (Silveira, 1985). C: This head position in anestethized and paralyzed subjects was reproduced in the head holder allowing an unobstructed visual ield. Ocular movements were prevented by intramuscular administration of neuromuscular blocker and the projection of the optic nerve head on the hemisphere was carried out with a reversible ophthalmoscope to monitor the eye position during the experiment.
The electrocardiogram and electrocorticogram were
recorded throughout the experiment and used to monitor the anesthetic level. Additional doses of anesthetic were given when necessary. Body core temperature was maintained at 37 °C. A tracheotomy was performed and the animal was paralyzed with 1ml/Kg at 3-h intervals of a solution of 2% trimethyl-gallamine (Flaxedil, Rhodia) diluted 1:3 in 0.9% saline solution and ventilated
artiicially. A craniotomy was performed, the dura-mater was relected and the exposed cortical surface protected
with warm mineral oil.
Perfusion, tissue preparation and anatomical reconstructions.
At the end of the electrophysiological recordings, the animals were deeply anaesthetised with a mixture of ketamine (10 mg/kg) and xylazine (1 mg/kg) (i.p.) and perfused transcardially with 0.9%
heparinized-saline, followed by 4% paraformaldehyde (Sigma Company, USA) in 0.1M phosphate buffer (PB), pH
7.4. The brains were removed from the skull and
processed so as to be able to align microelectrode tracks with gross anatomical landmarks, cytoarchitecture and myeloarchitecture. Sections were processed for Nissl substance to reveal cytoarchitecture and recognize the electrode trackings. All sections were mounted onto gelatinised-glass slices, air-dried overnight, dehydrated and coverslipped with Entellan (Merck). Electrode penetrations were correlated with anatomical landmarks by reconstructing across a series of sections, enlarged to allow easy visualization. A digitizing table was then used to measure the lateral position of each penetration in relation to the fundus
of the lateral sulcus by generating a lat reconstruction
of the visual recording sites.
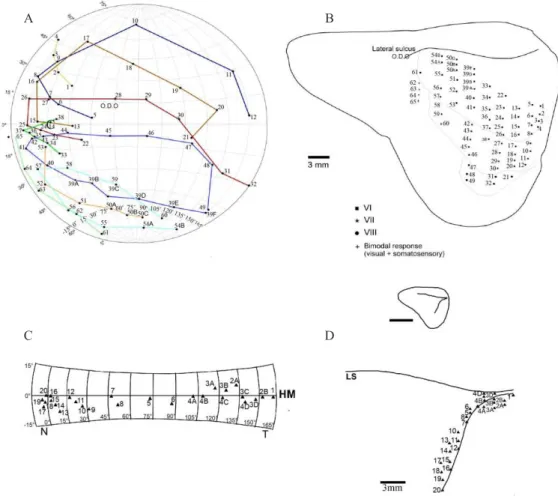
Figure 2. Mapping studies of V1 visual cortical area of agouti brain. Top: Graphic representation of the multiunit receptive ield centers of visually responsive neurons and equivalent recording sites in the visual responsive cortex in the agouti brain (cases Da-830408 and Da-830122). Individual plots are numbered on the equatorial/azimuthal representation of the visual ield (A) and the equivalent recording sites on the dorso-lateral cortical surface (B). Receptive ield progressions along mediolateral transects from VI into the immediately adjacent second visual area V2 are depicted by different symbols. When the microelectrode was moved across the cortical surface in VI, the multiunit receptive ield moved in orderly, continuous way through the visual ield. Note in VI the lateral border represents the nasal border of the visual ield, the rostral portion represents the lower ield and the caudal region the upper ield, as described previously (Picanço-Diniz, 1987; Picanço-Diniz et al., 1991). HM: Horizontal meridian; VM: Vertical meridian. Bottom: Graphic representation of the naso-temporal dimension of the visual streak in VI of case Da-830122. Small triangles indicate the center of the receptive ields on Equatorial/Azimuthal map of the visual ield (C), and the equivalent cortical recording sites aligned with the representation of the horizontal meridian in VI (D). Numbers indicate cortical recording sites and equivalent receptive ield centers. The inset indicates in a cortical dorso-lateral reconstruction the relative positions of the lateral sulcus and horizontal meridian representation.
A B
D C
Results
Systematic electrophysiological mapping at closely spaced recording sites revealed an ordered topographic representation in the primary visual area of the agouti (Figure 2). In Figure 2 we have plotted the results of cases Da-830408 and Da-830122. On the equatorial/ azimuthal representation (A) is illustrated the center
of multiunit receptive ields recorded along parallel
sequences of mediolateral microelectrode penetrations in the primary visual area (V1). Vertical and horizontal meridians are represented as dotted lines in the lateral margin of V1 (Figure 2, B). Note that the receptive
ield position changes in an orderly way through the visual ield when the microelectrode penetrations
progressed laterally. As described previously (Picanco-Diniz et al., 1991), there is a complete representation
of the contralateral visual ield in V1, where the lateral
sulcus corresponds to the representation of the temporal periphery, whereas the lateral margin of V1 corresponds
to the nasal end of the visual ield. Lateral to the
representation of the nasal end (vertical meridian of V1) is located V2 visual area. Note similar progressions along the nasotemporal dimension of the visual streak representation in case Da-830122 (Figure 2 C and D).
The horizontal meridian, which runs roughly orthogonal
to the lateral sulcus, occupies a disproportionately large portion of the complete visuotopic representation. In all cases we found that the visual streak representation in the
visual ield occupied > 40% of the entirety of V1. Moreover, we found visual ield asymmetry along the nasotemporal
axis of the horizontal meridian where the areal cortical
magniication factor (ACMF) in the nasal region (0.18 mm2/
deg2; longitude 0º, latitude 0º) inside the representation of the binocular visual ield is 10 times higher than that in the
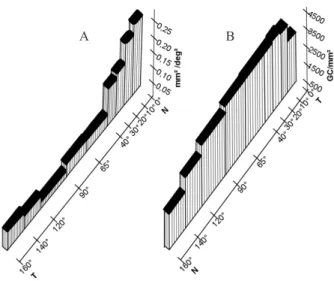
central region (0.018 mm2/deg2; longitude 68º, latitude 0º). Figure 3 is a modiication from case Da 830616
(Picanco-Diniz et al., 1991) to illustrate the mismatch between the visual streak nasotemporal distribution of retinal ganglion
cells (Silveira, 1985) and areal cortical magniication factor (Picanço-Diniz, 1987) in the agouti V1 area. The quantitative analysis of the V1 map using the areal cortical magniication
factor (ACMF) along the cortical representation of the visual
streak demonstrates a signiicant nasotemporal asymmetry
that cannot be directly associated with the retinal ganglion cell densities in the same region. In V1 the ACMF measured along the nasotemporal axis are highest in the region that corresponds to the intersection between the horizontal and vertical meridian and falls rapidly along the representation of the visual streak. In contrast, the retinal ganglion cell density shows a plateau along the visual streak decreasing sharply in the temporal and nasal extremities.
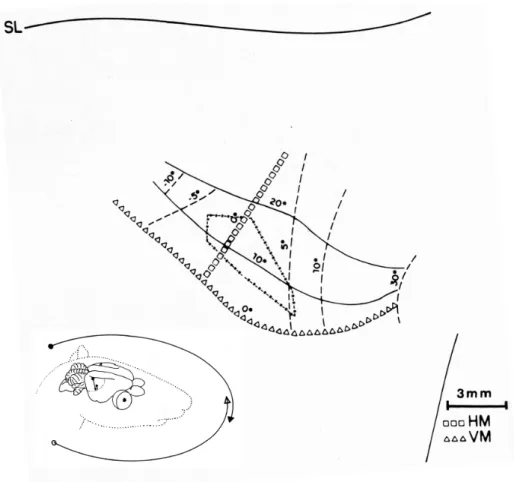
The binocular visual ield mapping in the case
Da850628 revealed that ACMF highest values are closer to the interception of the vertical and horizontal meridian at the nasal end of the visual streak representation (Figure 4).
Discussion
The motivation for the present study were two-fold: to conirm the degree of expansion of the representation of the
visual streak in V1 of the agouti and to establish whether there is a rational explanation for the apparent mismatch between the size of the nasal representation along the horizontal meridian in V1 and ganglion cell density along the visual streak in the retina. We found that the representation of the horizontal meridian is disproportionately large in
this species. The central 20 degrees between the parallels ±10 in the visual ield occupies > 40% of the visual
representation in V1. Moreover, the expansion of the nasal portion of the horizontal meridian in V1 corresponds with a relatively low density of ganglion cells in this region in the visual streak in the retina.
A closer look at our mapping data reveal that the cortical representation of the contralateral visual streak in
VI is asymmetric, the nasal ield being disproportionately
large when compared to the central (optic axis) and
temporal ields (Picanco-Dinizet al., 1991).
Asymmetric representation of the contralateral visual ield representation of the horizon in V1 of lateral-eyed mammals
“Unsleeping eyes, by Nature raised
To take the horizon in…”
This description quoted by Austin Hughes in
1971 (Hughes, 1971) from an eighteenth century poet to describe the rabbit visual behavior can be expanded to all
lateral-eyed mammals’ with well deined visual streaks
including the agouti. When the visual streak is aligned to the horizon this retinal specialization allows the animal to view the whole horizon without the specialized eye movements required for scanning with an area or fovea
Figure 3. Areal cortical magniication factor (ACMF) along the visual streak representation in V1 versus ganglion cell densities in the agouti retina. Note the signiicant mismatch between ganglion cell topographical distribution and ACMF in the nasal end of the horizontal meridian in V1.
centralis (Hughes, 1977). Indeed rabbits (Hughes, 1971), goats (Hughes & Whitteridge, 1973) and sheeps (Clarke & Whitteridge, 1976) also align the visual streak to the horizon to increase resolution and motion detection. In these species even a casual observation at their heads
suggests that the visual ield of these animals area unusually
large (Hughes, 1977; Picanço Diniz, 1987). In lateral
eyed-species with well deined visual streaks it is common to ind a mismatch between the ganglion cell densities
along the horizon in the retina and the nasotemporal representation of the horizontal meridian in cortical map in V1 (Picanço-Dinizet al., 1992). Indeed a review of the
published data conirms that all lateral-eyed mammals,
with different life styles and retinal organizations, appear to exhibit similar mismatches between the retinal and
cortical representation of the visual ield. Moreover, these mismatches are larger in those species with well deined
visual streaks such as rabbit and agouti (Hughes, 1977; Picanço-Dinizet al., 1992).
Representative examples of V1 maps and retinal ganglion cell isodensity lines adapted from elsewhere, including mouse (Drager & Olsen, 1981; Wagor, Mangini, & Pearlman, 1980), grey squirrel (Hall, Kaas, Killackey,& Diamond, 1971; Hughes, 1977), hamster
Figure 4. Schematic representation of the mono and binocular ields in the horizon and binocular multiunit response area in V1
(case Da850628). Arrows indicate schematic left and right monocular visual ields extent. The region of visual ield where the arrows intersect (approximately 20 deg) indicates the binocular visual ield. Binocular multiunit receptive ields were detected near the vertical meridian (dashed/dotted line). HM: horizontal meridian; VM: vertical meridian.
(Tiao & Blakemore, 1976 a,b), guinea-pig (Choudhury,
1978), agouti (Picanco-Diniz et al., 1991)and rabbit
(Hughes, 1971) illustrate this point. Two of those species
belong to Hystrichomorpha (agouti and guinea-pig), three belong to Myomorpha (rat, hamster and mouse) and one to the Sciurumorpha sub-order (grey squirrel). Among the Hystrichomorpha the agouti present a
well deined visual streak with longer isodensity lines
parallel to horizon and high centro-peripheral gradient of ganglion cell density in the retina (Silveira et al., 1989) whereas the guinea-pig present a rudimentary visual streak with low centro-peripheral gradient of ganglion cell density (Choudhury, 1978) (Figure 5).
In both rat (Fukuda, 1977) and hamster (Tiao &
Blakemore, 1976b) round ganglion cell isodensity lines were described suggesting the presence of area centralis. However in those species with round ganglion cells isodensity lines, the highest values of the cortical
magniication in V1 maps were detected in the interception
of the vertical and horizontal meridian, which does not coincide with the representation of the area centralis.
the mouse and grey squirrel (elongated isodensity lines and visual streak; (Hall et al., 1971; Hughes, 1977). Similar to the rat and hamster the highest values of the
cortical magniication in V1 maps were detected in the
interception of the vertical and horizontal meridian, which does not coincide with the representation of the area centralis. However, note a greater mismatch
between the nasotemporal cortical magniication and
retinal ganglion cell distribution in the grey squirrel as compared to the mouse due to the streak-like isodensity lines in the retina of the grey squirrel.
Figure 7 illustrates detailed V1 maps and retinal
ganglion cell topography for hamster (Tiao & Blakemore,
1976 a,b) and rabbit (Hughes, 1971). Other the even
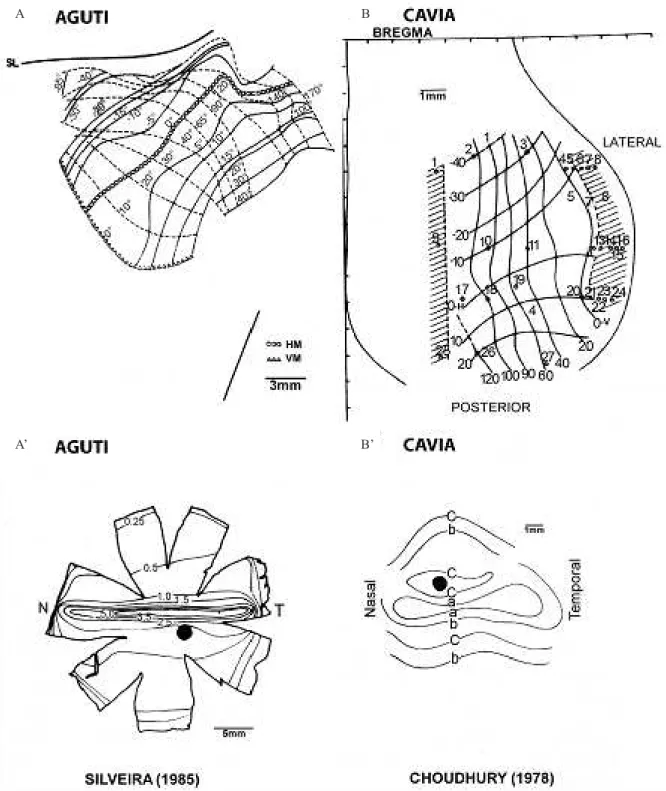
Figure 5. Ganglion cells isodensity lines in the retina and V1 visual ield representation in agouti (A, A’; modiied from (Picanço Diniz
1987) and (Silveira 1985)) and guinea pig (B, B’; modiied from (Choudhury 1978)). Isodensity lines (indicated by numbers or letters ) correspond to the distribution of retinal ganglion cells x 103 and x 102 in the agouti and guinea pig respectively. Note the nasotemporal
asymmetries of V1 maps that do not match the temporo-nasal distribution of retinal ganglion cells. T: temporal; N: Nasal.
A B
greater mismatch between ganglion cell topography
and cortical magniication factor in the rabbit due to the deined visual streak.
Physiological implications of the nasotemporal asymmetries of the visual streak representation in agouti V1 cortical area.
In the agouti as much as 170º of the visual ield in
the horizon of each eye (Picanço-Diniz, 1987) projects onto the major feature of the agouti retina, the visual streak, the extended area of high density of ganglion
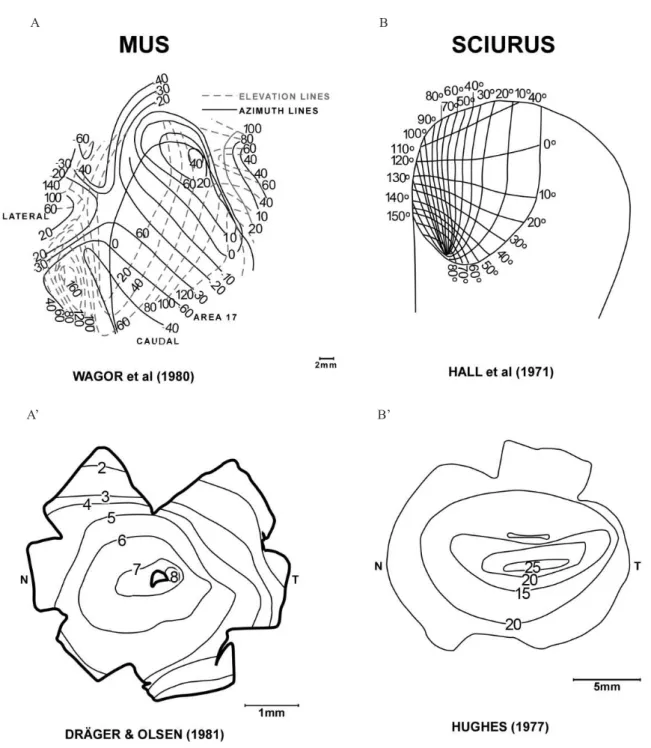
Figure 6. Ganglion cells isodensity lines in the retina and V1 visual ield representation in mouse (A, A’; modiied from Wagor
et al., 1980 e Dräger & Olsen, 1981) and grey squirrel (B, B’; modiied from Hall et al., 1971 and Hughes, 1977). Isodensity line numbers indicate the distribution of ganglion cells x 103. Note that the nasotemporal asymmetries of V1 maps do not match the
temporo-nasal distribution of retinal ganglion cells. T: temporal; N: Nasal.
cells along the nasotemporal dimension of the horizontal meridian (Silveira, 1985; Silveira, Picanço-Diniz, & Oswaldo-Cruz, 1989).The cortical representation of the contralateral visual streak in V1 is asymmetric in the agouti brain, with greater emphasis of the nasal region when compared to the central and temporal visual streak (Picanco-Dinizet al., 1991). In fact the representation of
the nasal end of the visual streak deined by the latitudes
and longitudes ± 10º occupies ten times more cortical area than the central (latitude: ± 10º, longitude 68 ± 10º) or temporal (latitude: ± 10º, longitude 170 ± 10º)
A B
visual streak (Picanço-Diniz et al., 1992), whereas the ganglion cell density in the retina decreases towards the
nasal and temporal visual ields.
This mismatch between ganglion cell density and the cortical magniication factor is inconsistent with the
theory proposed by (Woolsey, Marshall, & Bard, 1942) and largely accepted that the cortical representation in primary cortical areas is directly proportional to the density of peripheral innervations. In the visual system this rule is applied to the ganglion cell density.
We can think of at least two explanations of the mismatch between density of ganglion cells in the visual streak in the retina and cortical representation
along the horizontal meridian in V1 of the rabbit and agouti, including intrinsic cortical factors and/ or retinal specializations (Choudhury, 1988; Hughes, 1977; Picanco-Dinizet al., 1991; Picanço-Dinizet al.,
1992). In agreement with the irst hypothesis it has
been proposed that the distribution of non-pyramidal neurons of the pigmented rabbit primary visual cortex matches the nasotempoaral variation of the cortical
magniication factor in V1 (Choudhury, 1988). On
the other hand the occurrence of possible retinal specializations in the temporal ends of the visual streaks of agouti (Silveira, 1985; Picanço-Diniz et al., 1992)
and rabbit (Provis, 1979) has not been conirmed in the Figure 7. Ganglion cells isodensity lines in the retina and V1 visual ield representation in hamster (A, A’; modiied from Tião
& Blakemore, 1976a, b.) and rabbit (B, B’; modiied from Hughes, 1971). Isodensity line numbers indicate the distribution of ganglion cells x 103. Binocular ield is indicated by hatched area. Once again the nasotemporal asymmetries of V1 maps do not
match the temporo-nasal distribution of retinal ganglion cells. T: temporal; N: Nasal.
A B
rabbit (Oyster, Takahashi, & Hurst, 1981) or seems to be
not enough to explain the magnitude of the mismatch in the agouti. Since previous mapping studies on the rabbit superior colliculus (Hughes, 1971) revealed the absence of such mismatches the next candidates to explain the asymmetries could be the occurrence of possible specializations in the projections from LGN to V1 and/or intrinsic cortical mechanisms. Indeed, we have recently demonstrated differences in the density and dendritic trees of interneurons along the horizontal meridian in V1 of the agouti, with higher neuronal density and larger neuronal size near the vertical meridian in lateral V1. More branched dendritic trees were observed in the nasal representation as compared with the temporal periphery (unpublished observations).
In conclusion there is not a simple relationship between ganglion cell densities and the cortical
magniication factor in the primary visual cortex of
lateral-eyed mammals and cortical specializations may contribute to the intrinsic cortical mechanisms associated
to the asymmetric magniication of the horizon in V1.
Acknowledgments
This project was sponsored by Brazilian Government
research funds. Grant sponsor: Brazilian Research Council – CNPq and FINEP, CWPD is supported by Instituto Brasileiro de Neurociências – IBNnet and by Instituto Nacional de Febres Hemorrágicas Virais-CNPq
References
Choudhury, B.P. (1978). Retinotopic organization of the guinea pig’s visual cortex. Brain Research,144, 19-29.
Choudhury, B.P. (1988). Distribution of neurons in the pigmented rabbit’s visual cortex. Experimental Neurology, 101, 458-463.
Clarke, P.G., & Whitteridge, D. (1976). The cortical visual areas of the
sheep. The Journal of physiology, 256, 497-508.
Drager, U.C., & Olsen, J.F. (1981). Ganglion cell distribution in the retina of the mouse. Investigative ophthalmology & visual science, 20, 285-293.
Fukuda, Y. (1977). A three-group classiication of rat retinal ganglion cells:
histological and physiological studies. Brain Research, 119, 327-334.
Hall, W.C, Kaas, J.H, Killackey, H., & Diamond, I.T. (1971). Cortical
visual areas in the grey squirrel (Sciurus carolinesis): a correlation between cortical evoked potential maps and architectonic subdivisions. Journal Neurophysiology, 34, 437-452.
Hughes A. (1971). Topographical relationships between the
anatomy and physiology of the rabbit visual system. Documenta Ophthalmologica,30, 33-159.
Hughes A. (1977). T The topography of vision in mammals of
contrasting life styles: Comparative optics and retinal organization. In F. Cresctelli (Ed.), Handbook of Sensory Physiology(p. 813). Berlin:Springer-Verlag.
Hughes, A., & Whitteridge, D. (1973). The receptive ields and
topographical organization of goat retinal ganglion cells. Vision
Research,13, 1101-1114.
Oyster, C.W., Takahashi, E.S., & Hurst, D.C. (1981). Density, soma
size, and regional distribution of rabbit retinal ganglion cells. The Journal of Neuroscience 1, 1331-1346.
Picanço- Diniz, C. (1987). Organização do Sistema Visual de Roedores
da Amazônia: Topograia das Áreas Visuais Corticais da Cutia. In Instituto de Ciências Biológicas, Laboratório de Neuroisiologia Eduardo Oswaldo-Cruz, pp. 297. Universidade Federal do Pará, Belém - Pará - Brasil.
Picanco-Diniz, C.W., Silveira, L.C., de Carvalho, M.S. &
Oswaldo-Cruz, E. (1991). Contralateral visual ield representation in area
17 of the cerebral cortex of the agouti: a comparison between the
cortical magniication factor and retinal ganglion cell distribution. Neuroscience, 44, 325-333.
Picanço-Diniz, C.W., Silveira, L. & Oswaldo-Cruz, E. (1992). A
Comparative Survey of Magniication Factor in V1 and Retinal Ganglion Cell Topography of Lateral-Eyed MammalsEnglish. In
R. Lent.(ed), The visual system from genesis to maturity (pp. 187-198). Boston: Birkhäuser.
Provis, J.M. (1979). The distribution and size of ganglion cells in the
regina of the pigmented rabbit: a quantitative analysis. TheJournal of Comparative Neurology, 185, 121-137.
Silveira, L.C. (1985). Organização do Sistema Visual de Roedores da Amazôna: Óptica Ocular e Distribuição das C´[elulas Ganglionares Retinianas. . In Instituto de Ciências Biológicas, pp. 427. Universidade Federal do Pará, Belém, Pará - Brazil.
Silveira, L.C, Picanco-Diniz, C.W., & Oswaldo-Cruz, E. (1989). Distribution and size of ganglion cells in the retinae of large Amazon rodents. Visual neuroscience2, 221-235.
Tiao, Y.C., & Blakemore, C. (1976a). Functional organization in the
visual cortex of the golden hamster. The Journal of Comparative Neurology, 168, 459-481.
Tiao, Y.C., & Blakemore, C. (1976b). Regional specialization in the
golden hamster’s retina. TheJournal of Comparative Neurology,
168, 439-457.
Wagor, E., Mangini, N.J., & Pearlman, A.L. (1980). Retinotopic organization of striate and extrastriate visual cortex in the mouse.
TheJournal of Comparative Neurology,193, 187-202.