RAINDROP DISTRIBUTION IN THE EASTERN COAST OF NORTHEASTERN BRAZIL USING
DISDROMETER DATA
RICARDO SARMENTO TENÓRIO
1, MARCIA CRISTINA DA SILVA MORAES
2, BYUNG HYUK
KWON
31Universidade Federal de Alagoas, Maceió – AL, Brasil 2
Fundação para Estudos Avançados no Trópico Semi-Árido, Maceió – AL, Brasil 3Pukyong National University, Busan, Coréia do Sul
, [email protected], [email protected]
Received June 2008 – Accepted April 2010
ABSTRACT
Usually a single literature-suggested Z-R relationship, where Z the radar relectivity factor and R the rain rate, is used for weather radar data interpretation. It is desirable to calculate a Z-R relationship by precipitation type to improve the accuracy of quantitative rainfall rate in case of coexistence of different precipitation types, such as, in the area of precipitation produced from a Mesoscale Convective System (MCS). In general, in the MCS trailing anvil, the stratiform precipitation does not fall as drizzle. Rather, the rainfall can assume signiicant intensity (~10 mm h-1) with showery character. For that reason, in this study, the precipitations were classiied into convective and stratiform type, to produce optimum rainfall estimates. Therefore, Z-R relationships were developed for the Eastern
Coast of Northeastern Brazil (NEB) using rainfall raindrop size distribution (DSD) data collected with a disdrometer RD-69, aiming their utilization to start the operation of a weather radar system. In this study, due to operation and maintenance facilities, the disdrometer was installed in the Campus of the Universidade Federal de Alagoas (The Federal University of Alagoas) in Maceió in 2001, 12
months before the complete installation of a new radar system. The DSD was stratiied by rainfall rate classes. It is found that the DSD are clearly dependent on the parameters of the analytical distribution functions are, and show a marked monthly variability. The parameters of the frequency distributions are dependent on R. The forms of DSDs are similar but the amount of droplets in each one very
strongly. This may be possible due to the short period of data collection or to the intraseasonal rainfall variability. The general relationship for the Eastern Coast of NEB was found to be Z = 176.5 R1.29, with correlation coeficient equal to 0.83. This equation is in accordance with the ones for stratiform rain reported in the literature. We found that the convective rain observed is produced by convective cells imbedded into stratiform cloud layers. However, when separating stratiform and convective rainfall we found that the linear coeficient of the Z-R relation is signiicantly smaller for convective
rainfall than for stratiform one (65 and 167 respectively), but the exponential coeficient is higher for convective than for stratiform (1.69 and 1.26 respectively).
Keywords: Raindrop size distribution, Z-R relationship, NE-Brazil
RESUMO: DISTRIBUIÇÃO DO TAMANHO DE GOTAS DE CHUVA PARA A COSTA LESTE DO NORDESTE DO BRASIL UTILIZANDO DADOS DE DISDRÔMETRO
A relação Z-R, onde Z é o fator relectividade radar e R a taxa de chuva, utilizada para interpretação de
dados de radar meteorológico é geralmente baseada nas relações sugeridas na literatura. É importante calcular uma relação Z-R para diferentes regimes de precipitação para a melhoria da exatidão dos
não ocorrer como chuvisco. Ao contrário, a precipitação pode assumir uma intensidade maior (~10 mm h-1) e, com características claramente lutuantes, apresentar pancadas de chuva. Por essa razão, neste estudo, as precipitações foram classiicadas como convectivas e estratiformes, para se obter melhores estimativas de chuva. Portanto, relações Z-R foram estabelecidas para a Costa Leste do
Nordeste do Brasil (NEB) utilizando dados de precipitação obtidos com um Disdrômetro RD-69, visando a operação de um novo sistema de radar meteorológico. Neste estudo, devido às facilidades de operação, manutenção e instalações, o Disdrômetro foi instalado no campus da Universidade Federal de Alagoas em Maceió em 2001, 12 meses antes de completar a instalação do sistema de radar. A Distribuição do tamanho de gotas (DSD) foi estratiicada por classes de taxa chuvas. Veriicou-se que as DSDs dependem claramente dos parâmetros das funções de distribuição analíticas e mostram uma variabilidade mensal acentuada. Os parâmetros da freqüência de distribuição são dependentes de R. As formas das DSDs são similares, mas a quantidade de gotas em cada uma varia consideravelmente. Isto possivelmente pode ser devido ao curto período de coleta de dados ou devido à variabilidade intra-sazonal. A relação Z-R geral para a Costa Leste do NEB é Z = 176,5 R1.29, com coeiciente de um correlação de 0,83. Esta equação está em conformidade com as equações encontradas para chuvas estratiformes descritas na literatura. Constata-se que as chuvas convectivas observadas são produzidas por células convectivas normalmente embutidas em camadas de nuvens estratiformes. No entanto, quando se separa chuvas estratiformes das convectivas, veriica-se que o coeiciente linear da relação Z-R é signiicativamente menor para chuvas convectivas do que para as estratiformes (65
e 167 respectivamente), mas, o coeiciente exponencial é maior para as convectivas do que para as chuvas estratiformes (1,69 e 1,26 respectivamente).
Palavras-chave: Distribuição de Gotas de Chuva, Relação Z-R, NE-Brasil
1. INTRODUCTION
Rainfall is the most important variable in the tropics. Apparently, rainfall seems to be simple to observe. However, due to the random nature of the growth and development of convective cells, the classical method - the rain gage - is subject to errors that may exceed 100% in particular occasions. In addition, rain gage measurements are punctual, that makes dificult, or almost impossible, to determine the total rainfall areal distribution with accuracy. So, whenever possible, weather radar is the preferable instrument for observing rainfall despite the calibration problems involved. The Northeastern Brazil (NEB) is a semi-arid region, with rainfall regimes subject to a great interannual variability due to global scale phenomena such as El Niño-Southern Oscillation events. A C-band weather radar was installed since January 2003 in the Campus of The
Universidade Federal de Alagoas, city of Maceió located approximately at 10°S and 36°W, in the eastern coast of NEB (Tenório et al, 2003b). The beneits for the region include the alert of severe weather for civil defense, road transportation, port and airport operations, tourism and water resources management among others. The benefits for the agrarian activities, particularly sugar cane cultivation that is the main economic activity in the coastal zones in the region, may be enormous.
The granularity of raindrops within a rain volume has been the focus of recent research projects such as the ones
the applications used for the National Aeronautics and Space Administration’s (NASA) in the TRMM (Tropical Rainfall Measuring Mission).
To carry through a covering of the precipitation in the globe, including the oceanic surfaces and the inhabited terrestrial surfaces, observation from satellites and radar data must be used. The development and application of techniques that allow to study the features of precipitation from remote sensing data have been an important subject in a number of research. For applications in the ield of weather radar, a basic relation between the radar relectivity (Z) of the and the rain
rate (R) must be deined for the region to be studied, that is
the conversion of the radar relectivity in rain rate through a
Z-R relationship with two coeficients (Sekhon and Srivastava,
1971). Another method used for the estimation of the relation between radar relectivity and rain rate, is a set of drop number measured with the disdrometer (Joss and Waldvogel, 1967; 1969; Campistron et al., 1987). The estimation of Z-R relations using a set of pairs Z-R by means of one disdrometer RD-69 will
be discussed for each type of rain (convective and stratiform). The experimental area is one of the rainiest in northeastern Brazil, where climate is strongly inluenced by warm Atlantic Ocean current (The Brazil Current). The wet season is from April to August with rainfall amounting to 60% of the year total. The dry season is from September to December, with only 10% of the year rain total. The large-scale rain producing mechanisms are frontal systems and high tropospheric cyclonic vortices. Wavy disturbances or perturbations in the southeasterly (SE) trade winds ield are the mesoscale mechanisms responsible for the major portion of the year rain total. Small convective cells constitute the micro scale mechanisms (Molion and Bernardo, 2002). Upper Trophospheric Cyclonic Vortices (UTCVs) are synoptic scale systems with a great impact on the regional weather conditions for they are usually associated with high rainfall events. They are characterized by low pressure and convergence region at upper levels of the troposphere with descending motion in its core. Conversely, high pressure and divergence are found at lower levels, where the western side convection stems from the positioning of a frontal system, usually over the continent. The convection in the UTCV´s eastern lank is due to the convergence of the subsiding air with the SE trade winds, generally located over the ocean in the initial stage. UTCVs were described by many authors, among them Palmer (1951) with his pioneering studies, Kousky and Gan (1981). The UTCV season spans from November to March, with highest frequency in January, middle of the north hemisphere winter, when the equator-pole thermal gradient is largest in Northern Hemisphere (NH). Apparently, they occur in La Ninã years or years in which the equatorial Paciic sea surface temperatures (SST) are close to their climatic mean
while the northern Paciic shows positive SST anomalies. Under these circumstances, the frequency of cross equatorial north hemisphere frontal systems affecting even the south hemisphere tropics seems to be larger. According to Molion and Bernardo (2002), one suficient condition for the development of an UTCV is likely to be the presence of frontal systems in low latitudes of both hemispheres simultaneously, with the Southern Hemisphere (SH) frontal system enhancing moist lux convergence over entire NEB. The prevailing synoptic situation, in which the UTCV developed and maintained its activity in producing the observed anomalous rain, will be described.
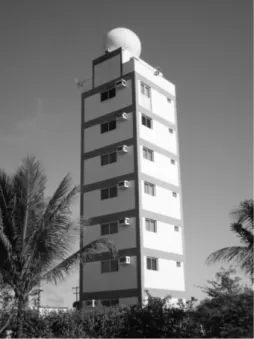
This study was performed in the Campus A. C. Simões, Universidade Federal de Alagoas (UFAL), in Maceió, Alagoas, Brazil, located over a large lat area 104 m above sea level, known as tabuleiro costeiro (coastal plateau). The obtained results are used by the weather radar system, which is installed in a 25 m concrete tower (Figure 1) built in the UFAL 13 km away from the coast line. The nearest horizon obstacles are small hills of about 400 m altitude, located 40 km in northwest direction. The irst ive loors of the tower are used as facilities for research and training. The equipment is a C-band WR-110-5 EEC radar (Tenório et al, 2003b) implemented with SASSANDRA signal-digitizing unit and computer codes. The SASSANDRA was developed at Laboratoire d’Aerologie in France (Sauvageot and Despaux, 1989). The radar data have been used for short range weather forecast (nowcasting), research, teaching and training purposes and also for supporting human activities in the civil defense, agriculture (mainly for sugar-cane production), water management, tourism and
transportation segments. Figure 2 shows the area covered by the radar with 4 different radii 50 km, 100 km, 250 km and 350 km, indicating that a good portion of the Atlantic Ocean (half of the radar coverage) will now be observed. In case of severe storm, a warning message will be passed onto Civil Defense Headquarter for the applicable measures at this time. The warning may be followed by an emergency message if the storm develops further and reaches the severe weather condition. It is important to mention that Brazil has fast computer numerical weather forecast operationally available. The Centro de Previsão de Tempo e Estudos Climáticos (CPTEC/INPE/MCT) issues 7 days in advance medium range weather forecasts, with 100 km and 200 km grid resolution, and 72 h in advance regional short range forecasts, with spatial resolution of 40 km. The 10 km resolution scale short range forecasts are being implemented locally. Another product is the areal distribution of daily rainfall totals, issued every 24 h which is very useful for agricultural and water management purposes. The products will be transferred to users through the web at set time intervals depending on the type of product and class of user, either free or restricted access. For example, a normal user has a new PPI image available every synoptic time - 00, 06, 12, and 18 UTC - in the radar web site (www.radar.ufal.br) as opposed to the Civil Defense Headquarter and others special users that receives real-time images.
2. DISDROMETER
The disdrometer RD-69 made by DISDROMET LTD (www.distromet.com), has a sampling area of 50 cm2 and it is sensitive to raindrop diameter ranging from 0.3 mm to 5.3 mm. The disdrometer measures the raindrop size and distribution by converting the impact of the raindrop into electrical pulses,
whose amplitude is proportional to the drop size. The RD-69 is connected to an ADA-90 analyzer and to a PC. The part exposed to rain was installed on the roof of the building of the Instituto de Ciências Atmosféricas (Atmospheric Sciences Institute) of the
Federal University of Alagoas. The disdrometer has two parts: the transducer transforms the mechanical impulse of drop that arrives in the pecker into the electric pulses. The processor is composed of circuits to eliminate non desired signs mainly the acoustic noise. Its main functions are: to provide electric information, to process the sign and to test through a circuit the performance of the instrument. The amplitude of the pulse is in a ixed relation to the diameter of the rain drop. The pulses are divided into 127 classes of drop diameter, and for every drop hitting the sensor a code is transmitted to a computer. A computer program is used to put the data in a appropriate format for recording on a ile. In order to get statistically signiicant samples and to reduce the amount of data, the program reduces the number of classes to 20. The variables estimated by the disdrometer and used in this study were calculated using the provided software. The number of drops with a diameter per unit of volume corresponding to the class i, is calculated with the equation:
where Di and ΔDi are the raindrop mean diameter of class i and its class interval, respectively; F is the disdrometer sampling surface; t is the integration time interval, equal to 1 minute in this case; V(Di) is the terminal fall speed of a drop with diameter Di, and Ni is the number of drop with diameter
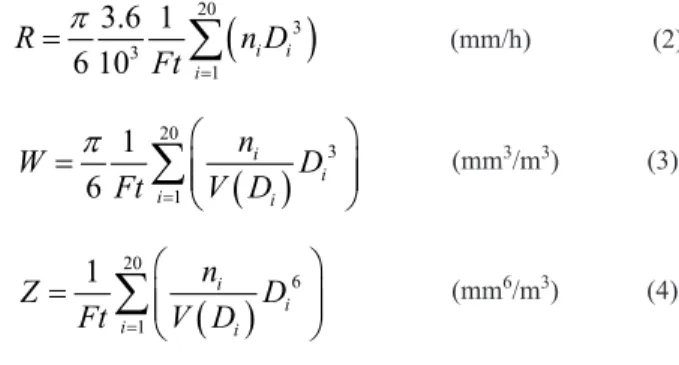
Di. The rainfall rate (R), liquid water content (W), and radar
relectivity factor are calculated with the following equations:
3. RAINDROP SIZE DISTRIBUTION
Two distributions, one with 2 and the other with 3 parameters, were used to representing the distribution of the drop number as a function of diameter D. For the 2 parameter distribution it was used an exponential function (Marshall and Palmer, 1948) of the form:
Figure 2 - Area covered by the radar.
i i i i D D FtV n D N ∆ = ) ( ) ( (1)
(
)
20 3 3 1 3.6 16 10 i i i
R n D
Ft
π
=
=
∑
(mm/h) (2)
( )
20 3 1 1 6 i i i i n W DFt V D
π
= = ∑
( )
20 6 1 1 i i i i n Z DFt = V D
=
∑
(mm3/m3) (3)
where N(D) is the drop distribution, N0 is the number of drops, and λ is the distribution slope.
Measurements of rain drop size spectra in some regions of the planet were carried out during the last years. When a variable follows a lognormal distribution, the logarithm of this variable follows a normal distribution. If N(D) is used with a linear x-coordinate, the mode of the distribution is dissymmetrical and positioned on the very left, towards the origin of the x-coordinate. If the logarithm of the x-coordinate is taken, the distribution becomes symmetrical with the mode in the medium: the distribution of the log is thus normal. R, the intensity of rain,
or D, the diameter of the drops follows a lognormal distribution,
as written in some papers such as, Feingold and Levin 1986, Sauvageot and Lacaux 1995, Nzeukou, et al. 2004, among others. The results suggest that the lognormal representation is suitable for a broad range of applications and can facilitate interpretation of the physical processes which control the shaping of the distribution. For the three parameter distribution, Feingold and Levin (1986) proposed a lognormal function of the type:
with the parameters Nt(per m-3) is the total number of drops,
Dg (in mm) is the mean diameter, σ is the standard deviation
of D. According to the authors for a certain choice of weighted
parameters this function can gives best fits than gamma distribution (Ulbrich, 1983) or an exponential distribution (Waldvogel, 1974).
The data were stratiied according to 8 rainfall rate classes for each month and for the total number of samples. The
stratiication is required since all DSD parameters are dependent on the rainfall rate (Sauvageot and Lacaux, 1995). The raindrop number, N(D), as function of diameter (D) is shown in Figure 3 for the 8 classes listed in Table 1. There is a clear deicit of small droplets, remarked already, for example, by Ulbrich (1983), Feingold and Levin (1986), Sauvageot and Lacaux (1995), in tropical regions and more recently by Seifert (2005) revising the relation between the slope and shape parameters of the raindrop size distribution of the rainfall rate classes parameterized by a gamma distribution. The diameter of the irst 3 classes did not exceed 5 mm and the maximum number of drop was always smaller than or equal to 2 mm of diameter. The number of drops equal to or larger than 5.3 mm was not recorded due to the upper limit of the instrument. The shape of the DSD was analyzed by comparing the monthly rainfall rates of the same class. During the whole sampling period, the rainfall rate classes were similar in shape but differ in drop quantity. Nzeukou et al. (2004), however, observed an almost perfect
( )
D
N
(
D
)
N
=
0exp
−
λ
(5)
( )
2
2
ln exp
2 ln 2 ln
g
D D Nt
N D
D
σ
π σ
= −
(6)
Figure 3 - Number of concentrations, N(D), as function of the Diameter(D) (mm).
similarity when compared 4 years of data. So, this discrepancy may be due to the short sampling period (10 months). Another possible explanation is that the comparison was made between rainfall events of different seasons.
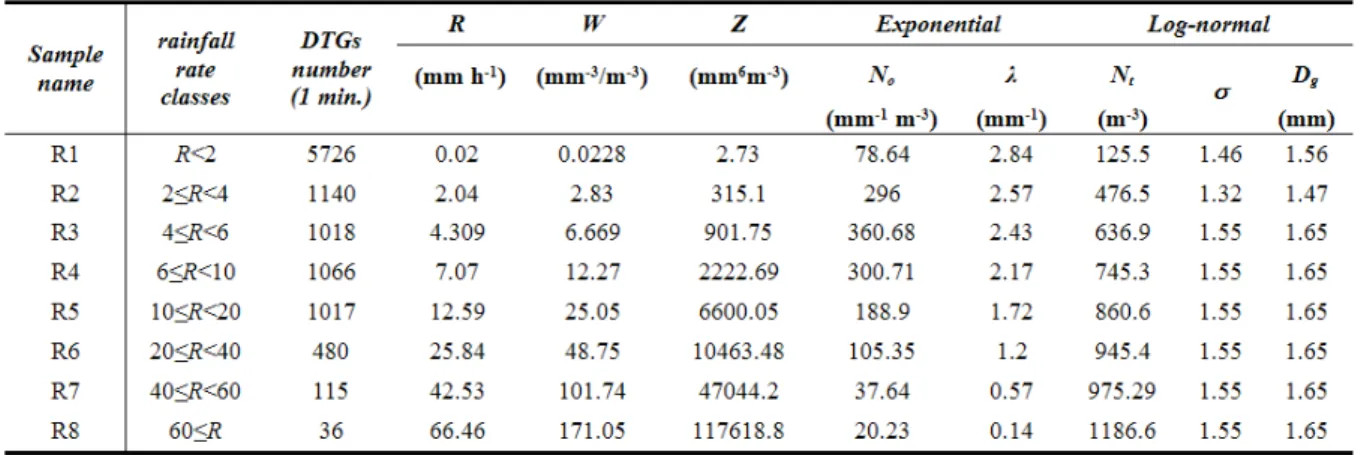
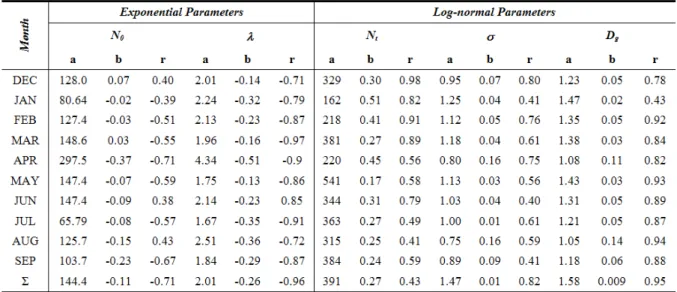
The results of the calculation of rainfall rate (R), liquid water content (W), radar relectivity factor (Z), the parameters of the exponential distribution (N0,λ) and of the lognormal
distribution (Nt, Dg and σ) are shown in Table 1. For the
exponential distribution, N0 increase with rainfall rate up to
rainfall rate Class R4, then decreases to a minimum in Class R8 thereafter. The maximum drop numbers were found to be between Classes R3 and R4. For the whole sample (10 months), the maximum and minimum N0 were 360.68 mm-1 m-3 and 20.23 mm-1 m-3, respectively. The slope of the exponential distribution
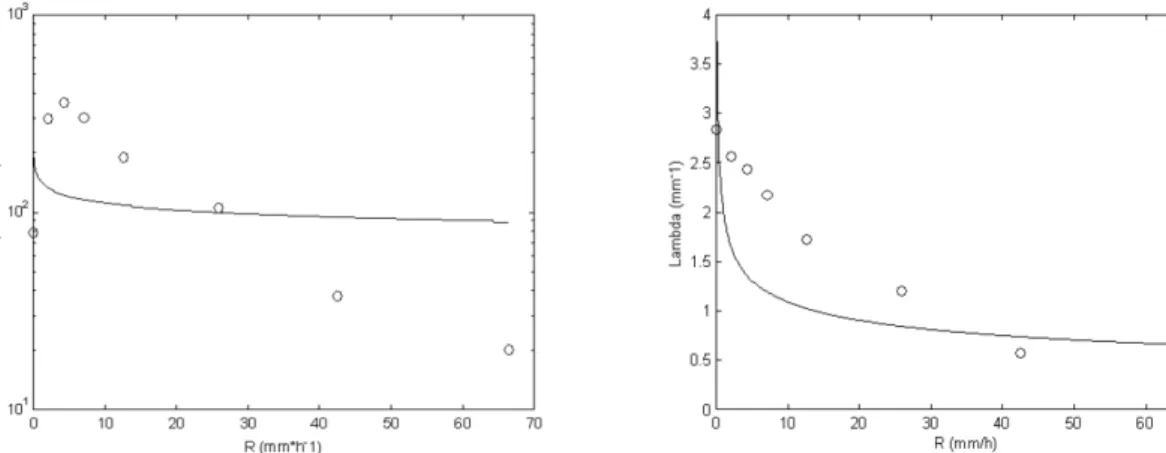
Figure 4 - Fitting curves for the exponential distribution against rainfall rate (R).
(λ(mm-1)) decreases with increasing R. This behavior was found
by Willis and Tattelman (1989) also Srivastava (1972, 1978) hypothesized that the effect of coalescence, with increasing of large drops number and reduction of smaller ones, causes λ to decrease. In Table 1, it is seen that there is a considerable λ decrease at R≥ 40 mm h-1. Willis and Tattelman (1989) found similar results for R ≥25-40 mm h-1. The values of λ varied within the range of 0.14 mm h-1 (R8) to 2.84 mm h-1 (R1) for
the whole sampling record. In Table 1, it is also apparent that, in general, Nt increases with R, with smaller values in Class
R1, largest number of raindrops, are in Class R8. The minimum value is 125.5 m-3 and the maximum 1186.6 m-3. The values of σ were independent of the rainfall rate classes, almost constant and equal to 1.55 for R > 4 mm h-1. It is the same for Dg.
In Figures 4 and 5, the itting of the exponential and lognormal parameters as function of rainfall rate R are shown. The corresponding itting equations are given in Table 2. For
N0 against R, the correlation coeficient is negative –0.39 for
the month of January and –0.71 for the whole sample. These values are in agreement with the ones found by Nzeukou et al. (2004). The relationship is inverse for λ and R also. The equation found is λ(R) = 2.01 R–0.26 with a correlation
coeficient of 0.96, apparently similar to other authors. For a tropical region, Sauvageot and Lacaux (1995) found λ(R) = 3.2 R–0.09 with a correlation coeficient of 0.92 and Marshall
and Palmer (1948) presented a classical itting namely λ(R) = 4.1 R-0.21. For the lognormal itting, we have Nt = 391.1R0.27
with correlation coeficients varying from 0.41 to 0.91. For tropical regions, Sauvageot and Lacaux (1995) found Nt= 670
R0.74 with a correlation coeficient 0.97 similar to Nzeukou
et al. (2004). The σ- R, computed relationship give σ =1.47
R0.01 and shows a wide variability of the correlation coeficient
among the months. Using the whole data set, σ is 0.82 (Table 2), with the lowest value in June. The relationship for Dg was
Dg = 1.58 R0.009 with correlation coeficient equal to 0.95.
4. Z-R RELATIONS
The lack of Z-R relations for the NE Brazil region,
conducts to use the results of this study for the operation of the weather radar system described above. After the radar system became fully operational (January of 2003), the disdrometer have been reinstalled at about 40 km far from the radar, during at least 2 years, aiming to the calibration of the system and determination of others Z-R relations, which will be used in the future exclusively for the observed regions. This procedure will continue be done at least in four distinct regions of the State of Alagoas - Brazil. After that, codes will be developed to allow the use of different Z-R relations according to the region and the season of the year.
Droplets of natural clouds and precipitation satisfy the condition of Rayleigh approximation, namely diameter much smaller than the wavelength used, in weather radars (Sauvageot, 1992). However in the presence of non-Rayleigh effects the coeficients of the Z-R relation are a little different.
Except on hail, in the C-Band there are no non-Rayleigh effects. In fact, the C-Band behaves as the S-Band. If it is hypothesized that radars can monitor certain atmospheric phenomena, then the radar relectivity factor (Z) can be related to physical quantities of these phenomena. Many works were performed to relate rainfall rate R and Z, resulting in a general function of the form:
Table 2 - Monthly coeficients of the exponential and lognormal distributions.
b
Z
=
aR
where Z is in mm 6 m –3 , R in mm h-1, and a and b are coeficients which depend on the raindrop number distribution N(D). Natural logarithm is applied to both side of equation (7) resulting in:
Making Y = ln Z; α = ln a; β = b; X = ln R, a straight-line function is obtained Y = α + βX. where α and β are the y-axis intercept and the slope, respectively. The coeficients a and b
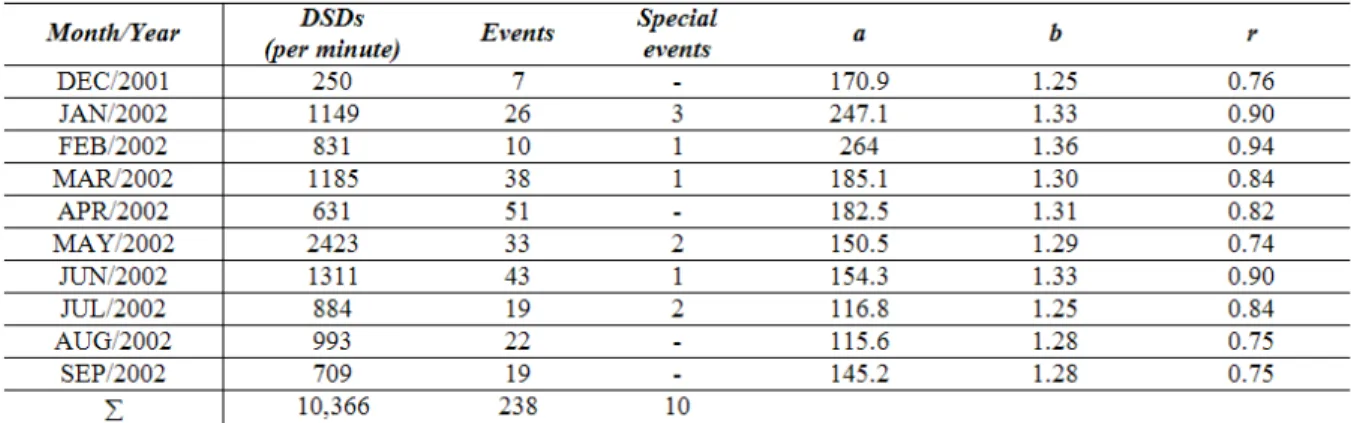
of equation (7) were estimated by linear regression Z versus R. The list of rainfall events is in Table 3. The criteria of rainfall duration T≥ 20 min and accumulated rain Rac≥ 10
mm were used to select special events listed in column 4 of the same table.
Several methods have been proposed to establishing the Z-R relationship. One of them requires a disdrometer for
measuring a set of N(D) (Joss and Waldvogel, 1967, 1969; Campistron, et al., 1987). In others, Z and R are measured simultaneously and independently by radar (Z) and rain gage network (R). Values of a and b coeficient can be computed
using the N(D) distributions. The objective of this work was to
determine the a and b coeficients, with in situ measurements
of the required variables, for application to the weather radar installed in the eastern coast of northeastern Brazil, the only coastal radar operating regularly in western tropical south Atlantic. All values of R were considered to establish the radar general equation. The result is:
Z= 176.5 R1.29 [r2 = 0.83]
The regression line obtained with the 10-month data set is shown in Figure 6. The monthly values for the a and b
coeficients are shown in Table 3 together with the number of DSD recorded in each month. The mean monthly b coeficients
did not differ from each other signiicantly. The mean monthly
a coeficients, however, seems to be divided in 3 classes, with
January and February well above 200, a range from 150 to 200 from March to June and below 150 for July to September.
4.1 Z-R Relation for Convective and Stratiform Rainfall
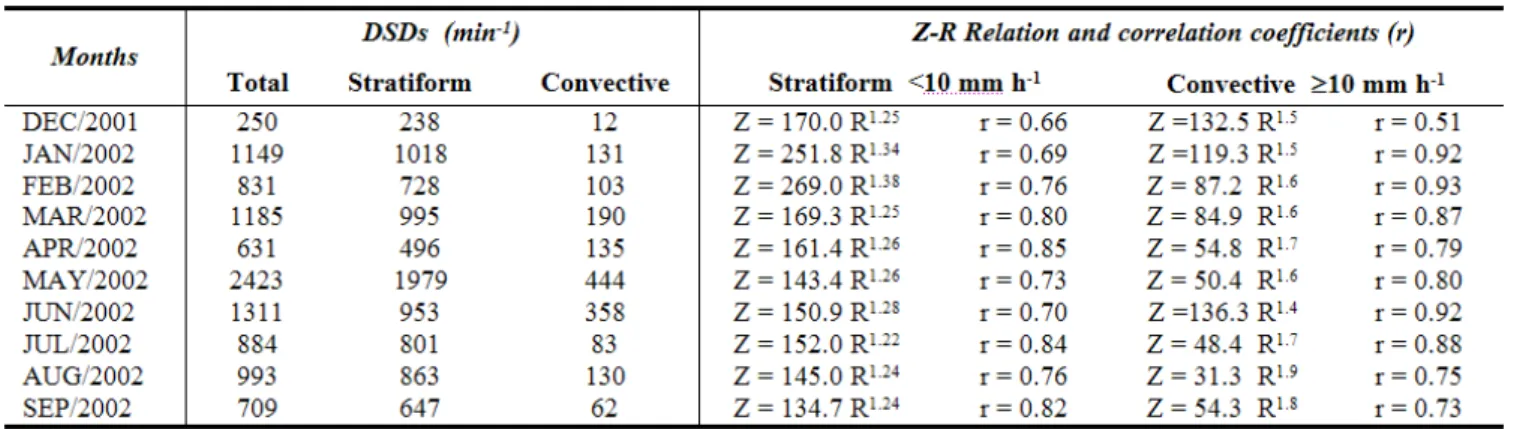
A threshold rainfall rate of R < 10 mm h-1 was adopted to deine stratiform rainfall events. Rain events were considered of convective class with R equal to or above that threshold, bearing in mind that due to the regional characteristics, it is dificult to distinguish the two types of rainfall. With this simple criterion, employed by other researchers, e. g. Nzeukou et al. (2004), among others, 84% of the rainfall events were classiied as stratiform rain and the remaining as convective rain. In Table 4 the DSD monthly numbers as well as the a and
Table 3 -Values for the a and b coeficients of the Z-R monthly equations, number of DSD recorded in each month and the correlation coeficient r. (8)
ln
Z
=
ln
a b
+
ln
R
(9)
b coeficients resultant from the Z-R regression technique are shown. For stratiform class, the coeficient a is in the range 134 to 269, being larger in January and February. The coeficient b
did not vary signiicantly, remaining in the range 1.22 to 1.38. Again, highest values occurre in January and February. The correlation coeficients are all above 0.66. For the convective class, the monthly values of the coeficient a varied widely from
31 to 136 whereas the coeficient b values are high, ranging from 1.5 to 1.9. Except for December, January and June, the correlation coeficients are all above 0.73 suggesting a good
Z-R relationship. The Z-R regression using the classiied data set
produced the following relationships and respective correlation coeficients:
Stratiform rainfall: Z= 167.8R1. 26; [r2 = 0.70] (10)
Convective rain: Z= 65.46 R1. 69; [r2 = 0.84] (11)
It can be seen in Table 4 that the a and b coeficients
values had a low spread when compared to the values of the overall stratiform data equation (10). For tropical Western Africa, Nzeukou et al. (2004) found slightly different results using the same criterion. The difference may be due to the fact that these authors used a longer data set, with four years sampling period. The difference may be attributed also to the dificulty to establishing a precise threshold to distinguishing the two classes of rainfall. In the eastern coast of NEB, the clouds are advected within the southeast trade winds ield from the Atlantic. Cloud development, thus, results from the low level convergence of the moisture lux near to or on the coast and the associate convective cells are usually imbedded in large stratus layers producing a sort of mixed rainfall. In such circumstances, the coeficients estimates tend towards the stratiform rain ones. The regressions results for stratiform and convective are depicted in Figures 7 and 8, respectively.
4.2 Z-R Relation for Special Rainfall Events
In this item, the purpose is to evaluate the Z-R relations for special rain events: duration of rainfall T ≥ 20 min and accumulated rain H≥10 mm selected from the sampling record.
The rain event accumulation (H) and duration (in minutes), together with the results for a and b coeficient and respective
correlation coeficients, are shown in Table 5. The coeficient a
values are all higher than 135 whereas the coeficient b values did not vary signiicantly, being similar to the general Z-R equation (9). The correlation coeficient values are high, in the range of 0.82 to 0.97. From Table 3, three events were selected that represent the summer season (December to February), the transition from dry to wet season (April-May) and the wet season (June-July).
The event of January 22nd is associated with an upper troposphere cyclonic vortex (see Molion and Bernardo, 2002), systems that are frequent during that particular month. This
Table 4 - DSD and Z-R monthly coeficient and respective correlation coeficients for stratiform and convective rain classes.
event has duration of 144 min (2.4 h) but accumulated only 12.19 mm rain. The following equation represented this event that has a high correlation coeficient of 0.92
Z = 136.5 R1.29 (12)
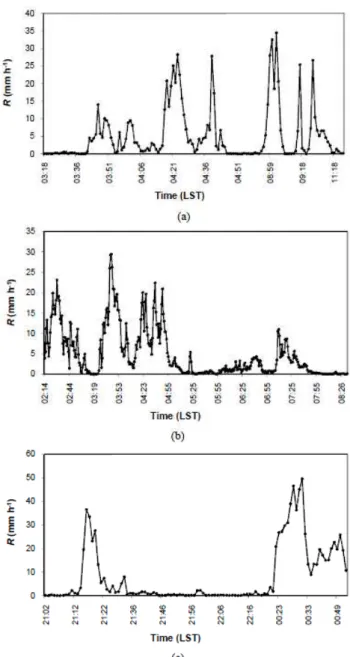
The rainfall rate R as function of time is depicted in
Figure 9 (a). It is apparent that convective cells produced R well above 10 mm h-1 but of short duration, no longer than 13 min. Examples are the peaks at about 04:20 Local Standard Time (LST) and 09:00 LST. Examples of stratiform rainfall rates, with R < 10 mm.h-1, are between 03:40 LST and 04:15 LST.
On May 26th, as seen in satellite images, 2 convective cloud clusters, associated with traveling disturbances in the southeast trade wind field, developed at the coast due to enhanced moisture lux convergence. The event lasted 444 min (7.4 h) and accumulated 74.32 mm rain. The equation (13)
Table 5 - Special rainfall events accumulation (H) and duration, results for a and b coeficients and respective correlation coeficients during the
study period, with duration ≥ 20 minutes.
Figure 8 - Regression line Z-R for convective rainfall with R ≥10
shows the Z-R relationship for this event, which has a correlation
coeficient of 0.93.
Z= 142.6 R 1.32 (13)
The evolution of the rainfall rate (R) with time is shown in Figure 9 (b). It can be seen that convective rain dominated the event, which most of the rain occurring during the nighttime. At this time, the breeze forms due to the inverted land-sea temperature gradient and this enhance moisture flux convergence and favors convective development.
Finally, the event of July 26th, representing the wet or
winter season, is analyzed and its Z-R relationship is given below (equation (14)), with a correlation coeficient of 0.96. This event lasted 104 min (1.73 h) and accumulated 14.05 mm rain.
Z= 142.3 R1.36 (14)
Convective rainfall rates of about 40 mm h-1 near 2120
LST and 50 mm h-1, at about 0030 LST are shown in Figure 9 (c). The event was also associated with traveling disturbances in the southeast trade winds ield.
5. CONCLUDING REMARKS
Parameters of the analytical functions representing DSD depend on the rainfall rate, except for σ and Dg, that remained
practically constant with the rainfall rate classes. The shapes of the DSD are similar to those found in the literature but the observed raindrop numbers are not because of the short period of this study, which encompasses only 10 months, or the physical nature of the rainfall and its intraseasonal variability. The results of the correlation between parameters of the exponential and lognormal distributions are in good agreement with the ones found in similar studies. In general, the recorded number of drop ranged from 300 to 500 drop m-3.
For determining the Z-R relationship for the weather
radar in the eastern coast of northeastern Brazil, the recorded rainfall rates were divided into 2 classes for stratiform rainfall rates R<10 mm h-1 and for convective rain R≥ 10 mm h-1. For the stratiform class, the values obtained for the coeficient a are in the range of 134 to 269 whereas the values for the coeficient
b range 1.22 to 1.38, as opposed to the convective class where a varied from 31 to 136 and b from 1.4 to 1.9. The stratiform
values are in accordance with values found in the literature, the convective ones, were not. The Z-R general relationship had coeficients similar to the ones of stratiform class. However, this does not mean that stratiform rainfall rates predominated during the study period. The weather systems, prevailing during the wet season (April to July), have traveled disturbances in
the SE trade winds ield and convective cells, imbedded in the disturbances, form and develop as they approach the coast and the convergence of the moisture lux is enhanced. Thus, it is possible that most of the rainfall rates are mixed classes, with rain coming from both stratiform and convective clouds, the latter not well developed. A larger data set covering different areas and a larger period, which includes climate inter-annual variability have been collected and others Z-R relationships using others approaches, for instance, applying a ixed N0 to DSD exponential distribution, should be derived aiming to resolve these questions.
6. REFERENCES
CAMPISTRON, B., G. DESPAUX, J. P., LACAUX. A microcomputer data-acquisition system for real-time processing of raindrop size distribution measured with the RD69 Distrometer. J. Atmos. Oceanic Technol., 4, 536-540. 1987
FEINGOLD, G.; Z. LEVIN. The lognormal it to raindrop spectra from frontal convective clouds in Israel. J. Climate Appl. Meteor., 25, 1346-1363. 1986.
JOSS, J., A. WALDVOGEL. Ein Spektrograph für Niederschlagstropfen mit Automatischer Auswertung. Pure Appl. Geophys., 68, 240-246. 1967.
J O S S , J . ; A . WA L D V O G E L . R a i n d r o p s i z e d i s t r i b u t i o n a n d s a m p l i n g s i z e e r r o r s , J. Atmos. Sci., 26, 566-569. 1969.
KOUSKY, V. E.; M. A. GAN. Upper tropospheric cyclonic vortices in the tropical South Atlantic, Tellus, 33 (6), 538-551. 1981.
LEE G.; I. ZAWADZKY. Variability of Drop Size Distributions: Noise and Noise Filtering in Disdrometric Data, J. Appl. Meteor.,44, 634-652. 2005.
MARSHALl, J. S. and W. McK. PALMER. The distribution of raindrops with size. Journal of Meteorology, 5, 165-166. 1948.
MOLION, L. C. B; S. O. BERNARDO. Uma revisão da dinâmica das chuvas no Nordeste do Brasil (A review of the dynamics of rainfall over Northeastern Brazil), Braz. J. of Meteor. 17(1): 1-10. 2002.
NZEUKOU, A.; H. SAUVAGEOT; A. D. OCHOU; C.M.F. KEBE. Raindrop size distribution and radar parameters at Cape Verde. J. Appl. Meteorol., 43, 90-105. 2004. PALMER, C. E.; On high-level cyclones originating in the
tropics, Transa. of Ame. Geoph. Union, 32 (5), 683-695. 1951.
précipitations. Veille Clim. Sat., ORSTOM, v.30, p.51-55. 1989.
SAUVAGEOT, H. Radarmeteorology, Artech House, 366 pp. 1992.
SAUVAGEOT, H.; J. P. LACAUX. The shape of averaged drop size distributions, J. Atmos. Sci., 52, 1070-1083. 1995. SAUVAGEOT, H., R. S. TENÓRIO AND F. MESNARD. The
size distribution of rain cells in West Africa and France, J. Atmos. Sci, 56, 57-70. 1999.
SEIFERT, A.. On the Shape–Slope Relation of Drop Size Distributions in Convective Rain, J. Appl. Meteor., 44, 1146-1151. 2005.
SEKHON, R. S.; SRIVASTAVA, R. C. Doppler observations of drop size distributions in a thunderstorm. Journal of Atmospheric Science, 28, 983-994. 1971.
SMITH, P. L; D. V. KLICHE. The Bias in Moment Estimators for Parameters of Drop Size Distribution Functions: Sampling from Exponential Distributions, J. Appl. Meteor., 14, 1195-1205. 2005.
SRIVASTAVA, R. C. A simple model of particle coalescence and breakup, J. Atmos. Sci., 39, 1317-1322. 1972.
SRIVASTAVA, R. C.. Parameterization of raindrop size distribution, J. Atmos. Sci., 44, 3127-3133. 1978.
TENÓRIO, R. S.; H. SAUVAGEOT; S. RAMOS-BUARQUE. Statistical studies of rain cell size distribution using radar data during squall lines episodes in west Africa. Proc. III International Symposium of Hydrological. Applications of Weather Radar, 518-526. 1995.
TENÓRIO, R. S. Etude statistique de la distribution de taille des cellules de pluie: implications pour l’estimation des champs de précipitation par radar. 1996. PhD thesis.
Universidade Paul Sabatier, Toulouse, France, 198 pp. 1996. TENÓRIO, R. S.; M. C. S. MORAES; D. A. QUINTÃO; B.
H. KWON, Estimation of the Z-R relation through the Disdrometer for the coastal region in the northeast of Brazil, J. of Kor. Earth Sci. Soc., 24(1), 30-35. 2003a.
TENÓRIO, R. S.; L. C. B. MOLION; H. SAUVAGEOT; D. A. QUINTÃO; M. A ANTONIO,: Radar Studies Over Eastern Coast of Northeast Brazil. Proc. of 31st International Conference on Radar Meteorology - AMS. Seattle. 445- 448. 2003b.
TOKAY, A.; BEARD, K. V. A field study of raindrop oscillations. Part I. Observation of size spectra e evaluation of oscillation causes. Journal of Applied Meteorology, 35, 1671-1687. 1996.
ULBRICH, C. W. Natural variations in the analytical form of the raindrop size distribution. J. Climate Appl. Meteor., 22, 1764-1775. 1983.
WALDVOGEL, A. The N0 jump of raindrop spectra. J. Atmos
Sci. 31, 1067-1078. 1974.
WILLIS, P. T.; P. TATTELMAN. Drop-size distribution associated with intense rainfall, J. Appl. Meteor., 28, 3-15. 1989.