Article
Criterious Preparation and Characterization of Earthworm-composts in View of
Animal Waste Recycling. Part II. A Synergistic Utilization of EPR and
1H NMR
Spectroscopies on the Characterization of Humic Acids from Vermicomposts
Elisete Guimarãesa, Antonio S. Mangrichb*, Vanderlei G. Machadob, Dinis G. Traghettac and Maria A. Loboc
a
Centro Federal de Educação Tecnológica, CP 571, 85503-390, Pato Branco - PR, Brazil
b
Departamento de Química, Centro Politécnico, Universidade Federal do Paraná, CP 19081, 81531-990, Curitiba - PR, Brazil
c
Centro Universitário Positivo, Rua Prof. Pedro V. P. Souza, 81280-330, Curitiba - PR, Brazil
Ácidos húmicos (HA) extraídos de vermicompostos (VC) de estercos de ovelhas (SHHA), bovinos (COHA), caprinos (GOHA) e coelhos (RAHA) foram analisados com o auxílio das espectroscopias de ressonância paramagnética eletrônica e ressonância magnética nuclear de hidrogênio. Estas substâncias húmicas (HS) recentes são compostas por ácidos carboxílicos, fenóis, funções amina, amida, éster, éter, estruturas carbônicas alifáticas saturadas, alifáticas com ligações conjugadas, duplas e simples, ao lado de cadeias aromáticas. Foram caracterizados complexos de Mn2+ de esfera externa (SHHA, COHA), complexos de Fe3+ em estruturas axiais (GOHA, RAHA)
e rômbicas (SHHA, COHA, GOHA e RAHA) e complexos de Cu2+ de campo fraco (COHA,
GOHA, RAHA) e de campo forte (SHAHA, COHA, GOHA, RAHA).
Humic acids (HA) extracted from sheep (SHHA), cow (COHA), goat (GOHA) and rabbit (RAHA) vermicomposted manure were analyzed by electron paramagnetic resonance and hydrogen nuclear magnetic resonance spectroscopies. Carboxylic acids, amine, amide, ester, ether and phenol functions bonded to saturated aliphatic, unsaturated aliphatic conjugated double and single bonds, and aromatic chains constitute the backbone structure of these fresh humic substances (HS). Mn2+
outer sphere complexes (SHHA, COHA), Fe3+ axial (COHA, RAHA) or rhombic (SHAHA,
COHA, GOHA, RAHA) complexes and Cu2+ as weak field (COHA, GOHA, RAHA) and strong
field (SHAHA, COHA, GOHA, RAHA) complexes were characterized.
Keywords: vermicomposts, humic acids, EPR and 1H-NMR spectroscopies
Introduction
A research area of increasing interest consists in the recycling of pollutant animal manure accumulated in the environment. Throughout the world, farmers spread cow and other animal manure on fields to improve soil fertility. As animal waste contains bacteria such as Escherichia coli, a
normal inhabitant of the gastrointestinal tract, this practice is dangerous to human health. Coliform bacteria can survive for long periods in cattle manure and would be mixed with the soil matrix and migrate towards the ground water after the manure was spread on fields1,2. The environmental
contamination with animal manure in some places of southern
Brazil, mainly of ground water used as municipal undertakings to supply the population needs without previous treatment, is a potential problem. It occurs as a result of the growing food industry activities in that region. Very recently, we proposed to study the criterious preparation and characterization of sheep (SH), cow (CO), goat (GO) and rabbit (RA) vermicompost manures, using the earthworm Eisenia foetida,
forming organic fertilizers for soil amendment3. Each
corresponding vermicompost (VC), characterized as much as possible, would be recommended for amending specific type of degraded soils, already existing in southern Brazil.
In a previous study3, thermal analysis, chemical and
spectroscopic (FTIR and visible) results indicate a high nitrogen content and low carboxylic acidity, as well as a high degree of conjugated aliphatic and/or substituted or condensed
aromatic structures for the humic acids (HA) extracted from these VC. The existence of peptide chains and N-heterocycles in the samples was proposed, but it could not be confirmed, and a differentiation between aliphatic conjugation and aromaticity degree was not possible.
The maintenance of soil fertility is intimately related with the ability of the organic matter to form complexes with trace metals4,5. The interaction of humic substances (HS) with metal
ions is of great importance for the environment, and its study has always been of considerable interest. The transport of soil micronutrients to the plants, as well as the immobilization of toxic elements in soils and waters, is greatly influenced by metal ion complexation capacity of the existing HS6,7.
In this work, we adopted the strategy of using thee HA native (indigenous) paramagnetic metal ions Mn2+, Fe3+, Co2+
and Cu2+ as EPR probes, together with 1H NMR spectroscopy
to deduce the functional groups and structures present in these HS. As we are interested in the use of these VC to improve the quality of degraded soils, the study of the concentration and binding of metal ions in VC and its HA is of concern. EPR spectroscopy is a suitable tool for the study of HS complexes with paramagnetic metal ions and may provide useful information about the oxidation states, modes of coordination and the geometry and the type of ligand sites8-10. The low
concentrations of the paramagnetic metal ions will not interfere with the 1H NMR studies. The use of the two magnetic
resonance techniques will give more insight in both the organic structure characterization and metal ion interactions in this complex material.
Experimental
VC preparations, isolation of HA, chemical analysis and Mn, Fe, Co, and Cu determinations using atomic absorption spectroscopy were previously described3. Extraction of HA
using aqueous alkaline solution and acid precipitation was carried out only once, in order to prevent loss or modification of important organic constituents of the samples, or excessive hydrolysis of metal ions. Reprecipitated humic acids (HAr) were also used, in order to obtain more information from EPR studies. HAr samples were obtained by alkaline redissolution and acidic reprecipitation of the HA sample. EPR spectra of the powdered HA or HAr samples were
registered at room temperature (300 K) in quartz tubes. A Bruker ESP 300E spectrophotometer (LABEPR/DQ/UFPR) was used, operating at a frequency of 9.7 GHz (X-band), with a 100 kHz modulation frequency, 2.024 G modulation amplitude and ~20 mW microwave power. Simulations of
EPR spectra were carried out using Win-EPR and
SimFonia computer programs. 1H NMR spectra of the HA
were recorded at room temperature in an AC-400 Bruker spectrophotometer (D/Bioq/UFPR). Briefly, 50 mg of each
HA sample were dissolved in 1 mL of NaOD/D2O
0.3 mol L-1. Chemical shifts were recorded in ppm using
the solvent resonance as internal standard (deuterated water:
δ 4.70). Coupling constant (J) are given in Hz.
Results and Discussion
EPR spectroscopy
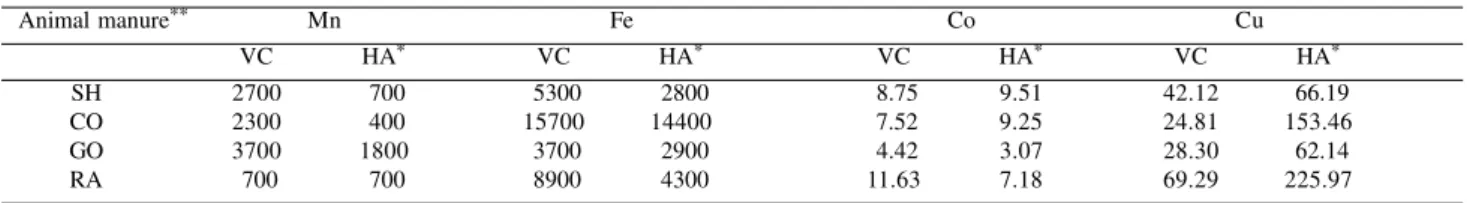
Mn, Fe, Co and Cu concentrations, determined by atomic absorption spectroscopy, in VC and HA, were in the order: Fe > Mn > Cu > Co (Table 1). This sequence is in agreement with the metallic contents of other vermicomposted materials11 and contrasts with sorption
capacity assays of these metals in soil HA, where the metals were sorbed in the order Fe > Cu > Mn > Co12. As found
for HA from soil, Fe and Mn were detected in higher amounts than Co and Cu. In the HA extraction process from CV, Mn and Fe were partially lost, Cu was concentrated while Co had its concentration increased in SH and CO samples and decreased in GO and RA samples. EPR spectra of the HA and HAr samples, at a sweep range of 5000 G, are shown in Figures 1 and 2, respectively. All spectra show a sharp line at g = 2.00 region typical of
organic free radical absorption. Spectra for the COHA and SHHAr samples showed typical absorption lines of outer sphere Mn2+ ion complex, [Mn(OH
2)6]2+-HA, (inserts in
Figures 1 and 2) with hyperfine interaction, A = 74.7 × 10⁻⁴
cm -1, and g = 2.00, for the COHA sample, and A = 68.2 ×
10-4 cm-1, and g = 2.00, for the SHHAr sample (Table 2).
The magnitude of the EPR hyperfine A parameter is inversely
related to the degree of covalent bonds of Mn2+ ion in its
complexes13. Those values indicated a more covalent
interaction of Mn2+ in the SHHAr, than in the COHA sample.
Table 1. Concentrations (mg kg-1)of Mn, Fe, Co and Cu in the vermicomposts (VC) and humic acids (HA) samples obtained by atomic absorption spectroscopy.
Animal manure** Mn Fe Co Cu
VC HA* VC HA* VC HA* VC HA*
SH 2700 700 5300 2800 8.75 9.51 42.12 66.19
CO 2300 400 15700 14400 7.52 9.25 24.81 153.46
GO 3700 1800 3700 2900 4.42 3.07 28.30 62.14
RA 700 700 8900 4300 11.63 7.18 69.29 225.97
iron in view of the other analyzed metals in all HA samples (Table 1). All EPR spectra of the VC (not shown) presented similar patterns in the same g region, but with line width variation between 800 and 1100 G. The GOHAr and RAHAr EPR spectra exhibited resonance at g = 6.0 (inserts
in Figure 2), which corresponds to a g⊥ value due to high
spin Fe3+ ions in sites with axial symmetry, possibly due
to porphyrin type iron complexes9,17,18. They suggest that
N-heterocyclic compounds, as pirrol rings from porphyrin, are present in these HA structures.
VC and HA presented very low cobalt contents (Table 1) and no EPR lines for Co2+ ions were apparent.
Divalent cobalt, a d7 ion, has ground states 4T 1 (weak
field) and 2E (strong field) in octahedral structures.
Those states have short lifetimes, producing large linewith at room temperature. These systems normally
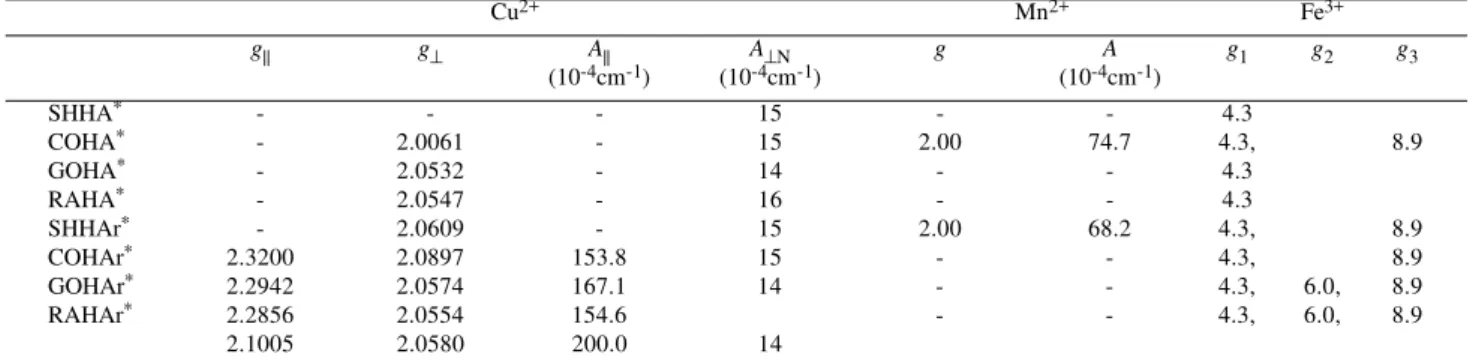
Table 2. EPR parameters (g, g||,and g⊥ values, hyperfine coupling constants, A and A||, and super hyperfine coupling constant, A⊥N) for Mn2+, Fe3+ and
Cu2+-HA complexes.
Cu2+ Mn2+ Fe3+
g|| g⊥ A|| A⊥N g A g1 g2 g3
(10-4cm-1) (10-4cm-1) (10-4cm-1)
SHHA* - - - 15 - - 4.3
COHA* - 2.0061 - 15 2.00 74.7 4.3, 8.9
GOHA* - 2.0532 - 14 - - 4.3
RAHA* - 2.0547 - 16 - - 4.3
SHHAr* - 2.0609 - 15 2.00 68.2 4.3, 8.9
COHAr* 2.3200 2.0897 153.8 15 - - 4.3, 8.9
GOHAr* 2.2942 2.0574 167.1 14 - - 4.3, 6.0, 8.9
RAHAr* 2.2856 2.0554 154.6 - - 4.3, 6.0, 8.9
2.1005 2.0580 200.0 14
* SHHA = sheep HA; COHA = cow HA; GOHA = goat HA; RAHA = rabbit HA; HAr = reprecipitated humic acids.
0 1000 2000 3000 4000 5000
g = 2.0
g = 4.3
RAHA GOHA SHHA
COHA
Magnetic field / Gauss
Figure 1. EPR spectra (300 K) for humic acid (HA) samples extracted from sheep (SHHA), cow (COHA), goat (GOHA) and rabbit (RAHA) vermicomposted manures. For the COHA sample detail of the second derivative mode of Mn2+is also presented.
0 1000 2000 3000 4000
g = 2.0
g = 6.0 g = 8.9
g = 8.9 g = 6.0
g = 4.3
RAHAr GOHAr COHAr SHHAr
Magnetic field / Gauss
Figure 2. EPR spectra (300 K) for lower ash tenor humic acid (HAr)
samples (see text) extracted from sheep (SHHAr), cow (COHAr), goat (GOHAr) and rabbit (RAHAr) vermicomposted manures. For the SHHAr sample detail of the second derivative mode of Mn2+spectrum
is also presented.
All samples showed evidence of high spin Fe3+ (S = 5/2)
complexed in distorted octahedral and/or tetrahedral, rhombic coordination structure (g1 = 4.3, g3 = 8.9)8,14,15.
For the SHHA, GOHA and RAHA samples the absorptions at g = 8.9 were not clearly determined from the spectra.
All HA samples showed a wide line of absorption centered at g≈ 2.2, (Figure 1) corresponding to the superimposed
lines of the spin-spin coupling (dipolar interaction), proportional to r-3, where r is the distance between two of
the magnetic dipoles. These wide lines occur due to the presence of paramagnetic metals and iron oxides that absorb in the same field region9,13,16. EPR spectra for HA
suggest that the origin of these wide lines is due to a large concentration of Fe3+ ions forming complexes with
constituents of the inorganic matter, besides iron oxides7.
require low temperatures (liquid helium) for EPR detection. Only in tetrahedral structures (4A
2 ground
state) Co2+ is EPR easily detected at room temperature19.
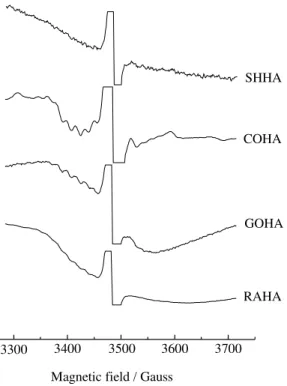
Each HA showed a higher copper content than the corresponding VC (Table 1) and it was verified that the copper concentration rises when the extraction cycle number is increased. These facts suggest that the major quantity of copper may be contained in the bulk organic structure of the VC and that in the successive extractions, inorganic and organic materials weakly bonded to the bulk structures are lost. The EPR spectra of the samples COHA, GOHA, RAHA, SHHAr, COHAr, GOHAr and RAHAr (Figures 3 and 4 and insert) show a common line multiple pattern in the perpendicular spectrum region. This is typical of super-hyperfine interaction of the copper ion unpaired electron with four magnetically equivalent 14N nucleus
(I = 1). The values of the super-hyperfine interactions determined, between 14 and 16 x 10-4 cm-1 for A
⊥N, are
consistent with values found in the literature for copper-porphyrin complexes19, 20.
bonded to four magnetically equivalent 14N atoms (Figure
5 A), and another with Cu2+ inside a structure of four oxygen
atoms (Figure 5 B). Through interative process, the intensity of the two added simulated spectra was varied to resemble the experimental spectrum. The parameters for the two Cu2+
EPR spectra of the RAHAr sample, obtained throughout the simulation, (Table 2) are consistent with the literature data for Cu-4O and Cu-4N complexes21-23.
Figure 3. Perpendicular EPR spectra region (300 K) of humic acid (HA)
samples extracted from sheep (SHHA), cow (COHA), goat (GOHA) and rabbit (RAHA) vermicomposted manures showing lines from super hyperfine interactions of a nitrogen containing ligand complexed to Cu2+ ion.
3300 3400 3500 3600 3700
RAHA SHHA
GOHA COHA
Magnetic field / Gauss
Figure 5 shows the experimental and simulated spectra for the RAHAr sample on an 1100 G field sweep range and with the 3100G as central field. The simulated spectrum (Figure 5 C) is, in fact, the sum result of two other simulated spectra: one considering the Cu2+ ions in axial symmetry
3200 3400 3600 3800
RAHAr GOHAr COHAr SHHAr
Magnetic field / Gauss
Figure 4. Perpendicular EPR spectra region (300 K) for lower ash contents humic acid (HAr) samples (see text) extracted from sheep (SHHAr), cow (COHAr), goat (GOHAr) and rabbit (RAHAr) vermicomposted manures showing lines from super hyperfine interactions of a nitrogen containing ligand complexed to the Cu2+ ion. For the COHAr sample detail of the
second derivative mode spectrum is also presented.
2600 2800 3000 3200 3400 3600 3800
Magnetic field / Gauss A
B C
D
The RAHAr sample spectrum was simulated starting from the assumption that the experimental spectrum is a sum of the spectra of Cu-4O and Cu-4N complexes, where the Cu-4O complex is present in a larger concentration than the Cu-4N complex (Figure 5). This hypothesis is corroborated by the attributions of νas (OCO) bands of carboxylate groups
interacting with metals at ~ 1645 cm-1 in the FTIR spectra
presented in part I of this study3. Furthermore, 1H RMN
data (see bellow) show signals corresponding to nitrogen containing aromatic heterocycles. Spectra of Cu-4N complexes were simulated with typical A|| values varying
from 180 to 200 × 10-4 cm-124. The parallel EPR parameters,
A|| and g||,typical for coordination of Cu2+ ions with four
oxygen10 atoms in the equatorial plane of an axial symmetry
were more evident in the experimental spectra than the same parameters values for Cu-4N complexes. This fact can be indicative of the higher concentration of Cu-4O than Cu-4N complexes in the samples as considered above.
The assortment g|| > g⊥ > 2.0 (Table 2) indicated a d9
configuration in which the unpaired electron is occupying the d(x2-y2) orbital in the equatorial plane of Cu(II)
complexes with elongated tetragonal symmetry25,26. It was
not possible to determine the EPR parallel parameter values,
g|| and A||, for the Cu2+ ion from the SHHA, COHA, GOHA,
RAHA and SHHAr sample spectra.
A sharp line of organic free radicals with g = 2.00 and
linewith varying between 6.0 and 7.0 G are apparent in all EPR spectra. These signals often found in EPR spectra of humic substances are due to semiquinone-like radicals. The presence of semiquinone functions indicates the existence of ortho- and para- biphenol functions on these
organic structures. Ortho-biphenol are good metal ion
chelating groups. They are also indicators of the VC humification level27-30.
1H NMR spectroscopy
1H NMR spectroscopy of HS in solution has been
scarcely studied because, in general, the spectra show broad signals, probably due to the presence of polymeric materials that prevent a simple structural elucidation31. However,
the signals of these HA were reasonably well resolved using 400 MHz 1H NMR instrumentation (Figures 6 and 7).
Another approach here is the idea of the complementarity of the EPR and 1H NMR data, which makes some
high-resolution details of the spectrum nonessential.
The four HA 1H NMR spectra showed basically the
same signals, although changes in their relative intensities were observed, indicating the presence of the same species in different concentrations in the studied HA (Figures 6 and 7, Table 3).
The δ 9.5-6.0 region (Figure 6) of the COHA, GOHA and RAHA spectra contains approximately 20% of all hydrogens. This value indicates high contents of highly substituted and/or condensed aromatic structures32, as well
as a high degree of double and single aliphatic bonding conjugation in these HA. This composition was previously evidenced by the H/C atomic ratios and E4/E6 values3.
Although this character was also postulated for SHHA, the percentage of protons in the δ 9.5-6.0 region of its 1H NMR
spectrum was lower (≈ 13%). This was due to the great intensity of the signals at δ 3.62 (quartet) and 1.15 (triplet) (Figure 7), indicating the presence of a large number of hydrogenated substituents in this sample (see below).
All spectra showed one sharp singlet at δ 8.43, which can be attributed to the resonance of phenolic -OH protons,
probably intramolecularly H-bonded with an ortho
carbonyl group33. This suggestion is in agreement with 9.5 9.0 8.5 8.0 7.5 7.0 6.5 6.0
COHA
GOHA
RAHA SHHA
δ / ppm
Figure 6. High frequency 1H NMR spectra of humic acid (HA) samples
extracted from sheep (SHHA), cow (COHA), goat (GOHA) and rabbit (RAHA) vermicomposted manures.
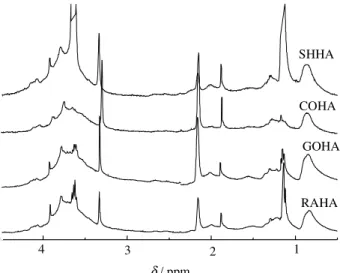
4 3 2 1
RAHA GOHA COHA SHHA
δ / ppm
Figure 7. Low frequency 1H NMR spectra of humic acid (HA) samples
the relatively high phenolic contents and with the absorption at 1645 cm-1 in the IR spectra of these HA,
observed previously3. Formate ions34, central protons of
anthranilic structures33 and substituted aromatic
N-heterocycle like pyridines, isoquinolines, pyrimidines or pyrazines35 can also contribute to this resonance.
In the δ 7.4 to 6.1 region, all spectra exhibit a broad signal with some well-defined peaks. Thus, the 8.0 Hz coupling constant values of the doublets at δ 7.37 and 6.59 are typical of aromatic protons. The signal at δ 7.37 can be attributed to the resonance of aromatic hydrogens of substituted anthracene type structures or of rings with -C=C, orto-O-COR, meta-COOH or -COOR substituent
groups. The doublet at δ 6.59 was tentatively assigned to aromatic hydrogens or biphenolic groups, although resonance of aromatic hydrogens of rings substituted with
ortho or para amine groups can also appear in this region.
Other weaker signals in the δ 7.1 to 6.2 range, more abundant in the COHA 1H-NMR spectrum, can be due to
the resonance of pyrrolic or indolic type heterocyclic hydrogens, in agreement with the high nitrogen content of the samples3. The presence of pyrrolic hydrogens is in
agreement with the existence of porphyrin structures, as suggested by the EPR parameters for the Fe3+ and Cu2+
Table 3.1H NMR data for HA in NaOD/D2O solutions. Chemical shifts (coupling constants) in ppm and Hz.
HA
Assignment SH CO GO RA
Ph-OH 8.43 (s) 8.42 (s) 8.43 (s) 8.43 (s)
Aromatic H 7.38 (d, 8.0) 7.36 (d, 8.0) 7.38 (d, 8.0) 7.37 (d, 8.0)
6.60 (d, 8.0) 6.58 (d, 8.0) 6.60 (d, 8.0) 6.59 (d, 8.0)
Pyrrolic or 7.10 (br, s) 7.09 (br, s), 6.92 (br, s) 7.12 (br, s) 7.08 (s)
indolic H 6.93 (br, s) 6.52 (bd), 6.33 (s) 6.96 (br, s) 6.92 (br, s)
6.53 (m) 6.31 (s) 6.53 (bd)
Double bond 7.30 (d, 16.0) 7.28 (d, 16.0) 7.30 (d, 16.0) 7.29 (d, 16.0)
trans H 6.20 (d, 16.0) 6.18 (d, 16.0) 6.20 (d, 16.0) 6.19 (d, 16.0)
-CH2-X (X= ,-OCOR, -OCOPh, -OPh) 4.2 - 4.03 (m) 4.18 - 4.02 (m) 4.18 - 4.02 (m) 4.18 - 4.02 (m)
CH3-X (X=-OPh, -OCOPh) 3.91 (s), 3.78 (s) 3.90 (s), 3.76 (s) 3.91 (s), 3.77 (s) 3.91 (s), 3.77 (s)
CH3-CH2-OR 3.62 (q), 1.15 (t) 3.67 (br, s), 1.19 (br, s) 3.62 (q), 1.16 (t) 3.61 (q), 1.14 (t)
CH3-X or -CH2-X (X= -OR, -NHCOR) 3.33 (s) 3.31 (s) 3.32 (s) 3.32 (s)
-CH2-X, (X= -CONR2, -COOR, -COR) 2.16 (s) 2.15 (s) 2.16 (s) 2.15 (s)
CH3-X (X= -CONR2, -COOR, -COR) 2.01 (br, s) 2.01 (br, s) 2.00 (br, s) 2.00 (br, s)
-CH2-C=C- 1.89 (s) 1.87 (s) 1.89 (s) 1.88 (s)
Aliphatic –CH2- 1.29 (m) 1.28 (m) 1.29 (m) 1.22 (m)
Aliphatic CH3- 0.87 (br, s) 0.87 (br, s) 0.84 (br, s) 0.84 (br, s)
complexes. The two doublets centered at δ 7.29 and 6.19, respectively hydrogen (a) and (b) of the structure below, seem to be associated. From their δ and coupling constant values (J(H-H) 16.0 Hz), these signals can be assigned to
the resonance of trans hydrogens of conjugated double
bonds of groups like C(=O)R (R = alkyl, ether), present in the pyrrolic structure36.
H
O R H
N
a
b
From the study of the δ 9.5 - 6.0 region of the 1H
NMR spectra (Table 3 and Figure 6), the presence in these HA of substituted and condensed aromatic structures, phenolic groups, N-heterocycles and conjugated double bonds can be deduced.
Thermal analysis data suggested a partial protein loss in the HA extraction process from the VC3. Considering that
the nitrogen contents were higher in HA compared to VC3,
cores was proposed. Present 1H NMR analysis for HA
samples seem to confirm this suggestion. In this way, it is important to note that the existence of N-heterocycles in soil HA had been previously detected by pyrolysis-gas chromatography/mass spectrometry analysis37.
All 1H NMR spectra showed five signals in the δ 4.2
-3.3 range (Figure 7), that can be attributed to methyl or methylene groups linked to nitrogen or oxygen atoms. The broad signal atδ 4.2 - 4.02 can be assigned to the resonance of methylene groups (-CH2-) bound to -OCOR (R = alkyl), -OCOPh or -OPh groups. The existence of analogous CH3 -OPh and CH3-OCOPh groups seems to be demonstrated by the two singlets at δ 3.91 and 3.77. The sharp singlet at
δ 3.32 was attributed to CH3- or -CH2 linked to OR or -NHCOR groups.
The quartet at δ 3.62 is associated with the triplet at
δ 1.15, corresponding to ethyl groups linked to -NHCOR or -OR groups. These signals are extremely intense in the SHHA 1H-NMR spectrum, and their intensities decrease
in the order SHHA > RAHA > GOHA, being practically imperceptible in the COHA 1H-NMR spectrum (Figure 7).
As SHHA corresponds to the sample with the lowest nitrogen contents3, the assignment of these signals to CH
3
-CH2-OR groups appears more adequate. In addition, these signals seem to be related with the intense IR absorption at 1384 cm-1, previously assigned to an aliphatic δ (CH
2)
band, which was absent in the COHA spectrum3.
The two singlets at δ 2.15 and 2.0 were tentatively attributed to -CH2- and CH3- groups respectively linked to -CONR2, -COOR or -COR groups, although CH3-Ph can also contribute to the former signal. The singlet at δ 1.88 was tentatively assigned to -CH2-C=C groups. The broad signal at δ 1.28 is mainly attributed to the aliphatic -CH2-, although CH3- bonded to -C-O-R groups (R = H, alkyl, Ph, COR, COPh) or -CH2- β to amine groups also resonate in this region of spectra33. The broad signal centered at δ 0.85 is due to the aliphatic CH3 groups.
A clear predominance of ether, amide and ester groups is deduced from the study of the δ 4.5 - 0.5 region of the
1H NMR spectra of HA samples (Table 3 and Figure 7), in
agreement to the previous FTIR study3.
Conclusions
The 1H NMR spectroscopic study of HA samples
showed that both types of structures, conjugated double bonds and substituted and condensed aromatic groups are constituents of the organic matter of these fresh HS, as previously proposed3. This is not common for aged HS
where, in consequence of the aromatic stabilization energy, conjugated double bond are present only in condensed
aromatic structures. The presence of nitrogen as a constituent of amide and N-heterocycle groups, in agreement with the high nitrogen content of the samples3,
was also confirmed by 1H NMR spectroscopy, which also
indicated the existence of phenolic, ether and ester groups. EPR spectroscopy was useful to determine the presence of transition metal ions such as Mn2+, Fe3+ and Cu2+ in
the HAs and VCs, as well as in the study of their interactions with the constituents of the organic matter.
We verified the presence of Mn2+, mainly in the
hydrated form, in agreement with the low capacity of chelation of this ion with soil HA organic matter. Inasmuch as manganese can be absorbed as soluble chelate or Mn2+
soluble ion by the roots, the VC samples here studied seem adequate to supply useful manganese to the plants5.
EPR data provided information about the presence of inorganic iron as oxide, hydroxide, and in rhombic and axial complexes like Fe3+-porphyrin. It has been shown
that chelated iron complexes, in the organic matter of humic substances, are more available for plants than iron in the form of soluble salts5.
EPR data also provided information about the complexation of Cu(II) with the organic matter of these HS. There are two types of chelates with axial symmetry, nitrogenous (Cu-4N) and oxygenated (Cu-4O) complexes. The latter is the most abundant copper species, in accordance with EPR spectroscopic parameters. It has been reported that the plants absorb chelate complexes of copper with oxygen-donor ligands faster than those with nitrogen-oxygen-donor ligands38.
Thus, the HS Cu-4N complexes would be a copper reserve during the continuing humification process on the soil.
Acknowledgements
CNPq fellowships and grants from CNPq and PADCT/ FINEP supported this work. The authors are also grateful to Dr. Carlos Jorge Cunha and Dr. Joaquim Delphino (DQ/ UFPR) for assistance with the English text and for useful comments on the manuscript.
References
1. Tiquia, S. M.; Tam, N. F. Y. Biores. Thecnol. 2000, 72, 1.
2. Diez-Gonzalez, F.; Jarvis, G. N.; Adamovich, D. A.; Russel, J. B. Environ. Sci. Technol. 2000, 34, 1275.
3. Mangrich, A. S.; Lobo, M. A.; Tanck, C. B.; Wypych, F.; Toledo, E. B. S.; Guimarães, E. J. Braz. Chem. Soc.2000, 11, 164.
4. Kiehl, E. J. Fertilizantes Orgânicos. Agronômica
5. Van Raij, B. Fertilidade do Solo e Adubação.
Agronômica Ceres Ltda, 1991.
6. Merce Maia, A. L. R.; Mangrich, A. S.; Szpoganicz, B.; Levy, N. M.; Felcman, J. J. Braz. Chem. Soc.1996, 7, 97.
7. Merce Maia, A. L. R.; Mangrich, A. S.; Szpoganicz, B.; Levy, N. M. J. Braz. Chem. Soc.1996, 7, 239.
8. Senesi, N.; Sposito, G.; Martin, J. P. Sci. Total Environ. 1987, 62, 241.
9. Senesi, N. Adv. Soil Sci.1990, 14, 77.
10. Mangrich, A. S.; Lermen, A. W.; Santos, E. J.; Gomes, R. C.; Coelho, R. R. R.; Linhares, L. F.; Senesi, N.
Biol. Fertil. Soil1998, 26, 341.
11. Businelli, M.; Perucci, P.; Patumi, M.; Giusquiani, P. L. Plant and Soil1984, 80, 417.
12. Kerndorff, H.; Schnitzer, M. Geochim. Cosmochim. Acta, 1980, 44, 1701.
13. Lakatos, B; Tibai, T.; Meisel, J. Geoderma 1977, 19, 319
14. Castner, T. J.; Newell, G. S.; Holton, W. C.; Slichter, C. P. J. Chem. Phys.1960, 32, 668.
15. Aasa, R. J.Chem.Phys.1970, 52, 3919.
16. Goodman, B. A.; Hall, P. L. Electron Paramagnetic Resonance Spectroscopy. In: Wilson, M. J.
Clay Mineralogy: Spectroscopic and Chemical Determinative Methods, 1st ed., Chapman & Hall;
London, 1994, p. 173.
17. Weil, J. A.; Bolton, J. R.; Wertz, J. E. Electron Paramagnetic Resonance - Elementary Theory and Practical Applications, John Wiley & Sons; New
York, 1994.
18. Nakagaki, S.; Mangrich, A. S.; Wypych, F. Inorg. Chim. Acta1997, 254, 213.
19. Drago, R. S. Physical Methods for Chemists, Saunders
College Publishing; New York, 1992.
20. Kenneth, A.; Carlyle, B. S. Biochemistry 1979, 18, 4294.
21. Boyd, S. A.; Sommers, L. E.; Nelson, D. W.; West, D. X. Soil Sci. Soc. Am. J.1981, 45, 745.
22. Senesi, N.; Bocian, D. F.; Sposito, G. Soil Sci. Soc. Am. J.1985, 49, 119.
23. Solomon, E. I.; Sundaram, U. M.; Machonkin, T. E.
Chem. Rev. 1996, 96, 2563.
24. Cunningham, K. L.; McNett, K. M.; Pierce, R. A.; Davis, K. A.; Harris, H. H.; Falck, D. M.; McMillin, D. R. Inorg. Chem.1997, 36, 608.
25. Buchanan, S. K.; Dismukes, G. C. Biochemistry1987, 26, 5049.
26. Calvo, R.; Passeggi, M. C. G.; Isaacson, R. A.; Okamura, M.Y.; Feher, G. Biophys. J.1990, 58, 149. 27. Martin Neto, L.; Andriulo, A. E.; Traghetta, D. G. Soil
Sci.1994, 157, 365.
28. Schnitzer, M.; Lévesque, M. Soil Sci.1979, 127, 140.
29. Senesi, N.; D’orazio, V.; Miano, T. M. Geoderma 1995, 66, 273.
30. Sposito, G.; Martin Neto, L.; Yang, A. J. Environm. Qual. 1996, 25, 1203.
31. Preston, C. M. Soil Sci. 1996, 161, 144.
32. Ruggiero, P.; Interesse, F. S.; Sciacovelli, O. Geochim. Cosmochim. Acta1980, 44, 603.
33. Silverstein, R. M.; Bassler, G. C.; Morril, T. C.
Spectrometric Identification of Organic Compounds,
Wiley & Sons Inc.; Singapore, 1991.
34. Wilson, M. A.; Jones, A. J.; Williamson, B. Nature 1978, 276, 487.
35. Pretsch, E.; Clerc, T.; Seibl, J.; Simon, W. Tablas Para la Elucidación Estructural de Compuestos Orgánicos por Métodos Espectroscópicos, Alhambra; Madrid, 1980.
36. Breitmaier, E. Structure Elucidation by NMR in Organic Chemistry. A Practical Guide, John Wiley &
Sons; Chichester, 1993, p. 172 - 173.
37. Schulten, H. R.; Schnitzer, M. Soil Sci. 1992, 153, 205.
38. Martin Neto, L.; Nascimento, O. R.; Talamoni, J.; Poppi, N. R. Soil Sci.1991, 151, 369.