Application of Statistical Mixture Models
for Ternary Polymer Blends
I. Nascimento, R. E. Bruns*, D. F. Siqueira, and S. P. Nunes
Instituto de Química, UNICAMP, Cidade Universitária Zeferino Vaz, Barão Geraldo,
Campinas - SP, Brazil
Received: August 16, 1996
Este trabalho mostra como modelos estatísticos podem ajudar na obtenção de misturas poliméri-cas complexas. Neste poliméri-caso foram estudadas misturas poliméripoliméri-cas ternárias cujos valores de energia e tensão de ruptura foram medidos para treze amostras com proporções diferentes. As respostas foram tratadas estatisticamente usando modelos cúbicos especial e completo. O comportamento dos valores das respostas para toda a faixa de composição das blendas PS/PMMA/PVDF e PS/PBMA/PVDF foram adequadamente descrito pelo modelo cúbico completo. Diagramas ternários marcados por valores de curvas de nível são úteis para analisar como estas propriedades mecânicas mudam quando se varia a proporção dos componentes. Uma modelagem estatística correta para toda a faixa de proporção de componentes para a blenda PS/PEMA/PVDF requer modelos de misturas mais sofisticados.
The paper shows how statistical models can help taylor complex polymeric mixtures. Ternary polymer mixtures were studied. Energy and strength at break response values were measured for thirteen samples of varying component proportions. The responses were statistically treated using special and full cubic models. The behaviors of these response values for the whole range of compositions of the PS/PMMA/PVDF and for PS/PBMA/PVDF blends are adequately described by full cubic models. Ternary diagrams marked by isoresponse value contour lines are useful for analyzing how these mechanical properties change with varying component proportions. Successful statistical modeling of the whole range of component proportions of the PS/PEMA/PVDF blends evidently requires more sophisticated mixture models.
Keywords: statistical mixture models, polymer blends, full cubic models, polymethacry-lates, polysterene, poly(vinilydene fluoride)
Introduction
Polymeric materials used in all kinds of technological applications are almost always a complex mixture of poly-meric components and several additives. Polymer blending has been established as a current way of achieving desired properties1. However, many aspects should be considered to predict the final properties of a wide range of possible formulations even if only few components are considered. Suitable mechanical properties are usually one of the main goals of mixing polymers. Immiscible polymer blends are frequently prepared (or developed) to supply a more attrac-tive commercial product in the sense of price or proc-essability, but in detriment of their mechanical properties,
which sometimes have to be recovered by adding a third component, a compatibilizer. Block copolymers are nor-mally chosen for this purpose, but homopolymers can also be useful for compatibilization2. If the degree of miscibility between the homopolymer compatibilizing agent C and each of the blend polymer components (A and B) is low but still higher than the one between A and B, C may be located at the A/B interface. When the degree of miscibility be-tween C and at least one of the polymer components is considerably high, it dissolves into A and B rich phases. In any case the compatibilizer acts by decreasing the inter-facial tension and therefore improving dispersion and in-terface adhesion among the polymer blend components. Article
Here statistical modeling of a limited number of experi-ments is shown to be helpful in describing properties of polymer blends with wide composition ranges. The me-chanical properties of ternary polymer blends with Poly(vinylidene fluoride) (PVDF), Polystyrene (PS) and poly(methacrylates) were investigated and discussed using different models. PVDF and PS are immiscible polymers. The introduction of polymethacrylates (PXMA) (X = methyl, ethyl or butyl) into PVDF/PS has a compatibilizing function. PVDF/PMMA and PVDF/PEMA are known as miscible pairs. PVDF and PMMA have a lower critical solution temperature (LCST) at 330 °C and an upper critical solution temperature (UCST) at 140 °C. Between these temperatures the blend is miscible in the melt state over the entire range of compositions. Miscibility is probably due to H-bond formation between the carbonyl groups of PMMA and the acidic hydrogens of PVDF, with an enthalpy of mixing of -1.9 kJ/mol for blends containing 50% of each polymer and with the Flory-Huggins parameter, χ, varying from -0.7 to -0.13-7. PVDF and atactic PEMA are also miscible with a LCST between 220 and 250 °C, with a χ = -0.348,9. PS and PMMA are not miscible, but the χ value is low, χ = 0.012,10.
Statistical Mixture Modeling
Experimental mixture designs and models permit the determination of optimum values of ingredient proportions with the execution of a minimum number of experi-ments11,12. The mixture models are derived from the gen-eral polynomial equation used in response surface analysis
y
^ = b0+
∑
i= 1 qbixi+
∑
i = 1 i ≤ j q
∑
j= 1 q
bijxixj
+
∑
i= 1 q
∑
i= 1 i ≤ j q
∑
k= 1≤ k q
bijkxixjxk … (1)
that expresses how a predicted response value, y^, changes with varying values of the q experimental factors being investigated. For mixtures the q factor values, or ingredient proportions, xi, are related by
∑
i =1 qxi=1 (2)
since the proportions of the ingredients in mixtures always sum to 1 (or 100%). Substitution of this equation into Eq. 1 results in the mixture model for three ingredients (q = 3) with redefined coefficients indicated with asteriks.
y ^ = b∗
1x1+ b∗2x2+ b∗3x3+ b12∗x1x2+ b13∗x1x3+ + b∗
23x2x3+ b
∗
123x1x2x3+ d
∗
12x1x2(x1− x2)+ + d∗
13x1x3(x1− x3)+ d23∗x2x3(x2− x3) (3)
The first three terms form the linear mixture model. Its bi* coefficients (i = 1, 2, 3) can be determined by simply performing response measurements on the pure compo-nents of the mixture being investigated. These pure com-ponents are represented by points at the vertices of the mixture concentration triangle in Fig. 1. The quadratic model includes the next three terms that have bij coeffi-cients indicating synergic or antagonistic interaction ef-fects on the response values between two of the mixture ingredients. To determine these effects, experiments on binary mixtures are necessary. Using a multi-variant statis-tical criterion, the binary 50/50 mixtures shown in Figure 1 are the most appropriate ones to be investigated for precise model determination. If the b123*x1x2x3 term is added to the quadratic model, the result is a special cubic
model already used by the authors to model mechanical
resistance of a PS/PMMA/PVDF ternary blend13. A re-sponse measurement on at least one ternary mixture is necessary to evaluate b*123, with best choice being the (33/33/33) mixture, indicated at the center of the concen-tration triangle in Fig. 1. This design results in the smallest statistical uncertainties in the mixture model parameter values.
If the response dependence on the ingredient propor-tions is too complex to be described by the above models the full cubic model containing all the terms in Eq. 3 can be used. Besides the ternary mixture, binary 33/66 mix-tures, also shown in Fig. 1, rather than the 50/50 mixmix-tures, are recommended for model determination. Since it is not possible to know a priori which model will best represent the experimental data, experiments in our investigation were performed for all the mixtures indicated in Fig. 1. The
models tested in this work contain a maximum of ten parameters (the full cubic model for three ingredients) and the thirteen distinct mixtures used permit an analysis of variance (ANOVA) of residuals which provide statistical F indices of regression significance and lack of fit to all contemplated models. Replicate determinations for each mixture were performed so that experimental error could also be estimated.
Experimental
Materials
Poly(vinylidene fluoride) (PVDF) (18270-2), poly(ethyl methacrylate) (PEMA) (9003-42-3); poly(butyl methacrylate) (PBMA) (9003-63-8) and poly(methyl methacrylate) (PMMA) (9011-14-7) were purchased from Aldrich. Polystyrene (PS) (Mw = 3.0 x 10⁵ g/mol and Mw/Mn = 1.9) was kindly supplied by Proquigel, São Paulo, Brazil.
Mechanical tests
Polymer mixtures were extruded in a Custom Scientific Instruments CS 194 mixing extruder, with rotor tempera-ture at 150 °C and rotor rate of 220 rpm. The extruded rods were then cut into pellets and re-extruded to assure mixing efficiency. Sheets of 8 x 0.4 mm were obtained. Sheets 60 mm long were used for the mechanical tests in a EMIC tensile machine with rate of 5 mm/min. The tensile strength at break and the energy absorbed by the sample before breaking (integral of the stress-strain curve) were meas-ured.
X-Ray diffraction
The sample crystallinity was evaluated using a Shi-madzu X-Ray diffractometer with Cu Kα radiation.
Results and Discussion
Values of tensile strength at break are presented in Tables 1-3. For the statistical models a minimum number of formulations were chosen following the experimental design of Fig. 1. The area below the stress-strain curve gives the energy that the sample is able to absorbe before breaking. It is related to the impact resistance. Quite low values were measured for binary PS/PVDF blends (0.007-0.08 J). Addition of polymethacrylates increased the en-ergy values considerably to 0.3-1.3 (for 33/33/33 blends) showing their efficiency in improving phase adhesion and dispersion in the multicomponent system. The effect was much more evident in the case of blends with PEMA. The interaction parameters for ternary blends are usually given by B,
B123=( B12φ2)2
(1 −φ1) +
(B13φ3)2
(1 −φ1) +∆B [ φ3φ2
(1 −φ1)2] (4)
where Bij = RTχij/V, ∆B = B21 + B13 - B32 with χij representing the Flory-Huggins interaction parameter be-tween i and j, φi is the ith volume fraction and V is the base molar volume. Although B is strictly valid for non polar systems in equilibrium, the concept has been widely used in the field of polymer blends14.
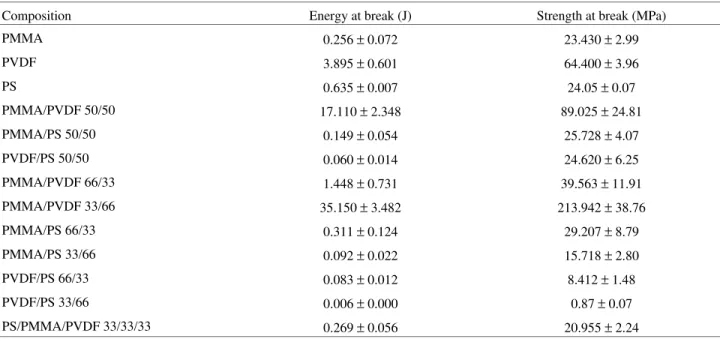
Table 1. Average energy and strength at break values and their standard deviations for the mixture design of the PS/PMMA/PVDF blendsa.
Composition Energy at break (J) Strength at break (MPa)
PMMA 0.256 ± 0.072 23.430 ± 2.99
PVDF 3.895 ± 0.601 64.400 ± 3.96
PS 0.635 ± 0.007 24.05 ± 0.07
PMMA/PVDF 50/50 17.110 ± 2.348 89.025 ± 24.81
PMMA/PS 50/50 0.149 ± 0.054 25.728 ± 4.07
PVDF/PS 50/50 0.060 ± 0.014 24.620 ± 6.25
PMMA/PVDF 66/33 1.448 ± 0.731 39.563 ± 11.91
PMMA/PVDF 33/66 35.150 ± 3.482 213.942 ± 38.76
PMMA/PS 66/33 0.311 ± 0.124 29.207 ± 8.79
PMMA/PS 33/66 0.092 ± 0.022 15.718 ± 2.80
PVDF/PS 66/33 0.083 ± 0.012 8.412 ± 1.48
PVDF/PS 33/66 0.006 ± 0.000 0.87 ± 0.07
PS/PMMA/PVDF 33/33/33 0.269 ± 0.056 20.955 ± 2.24
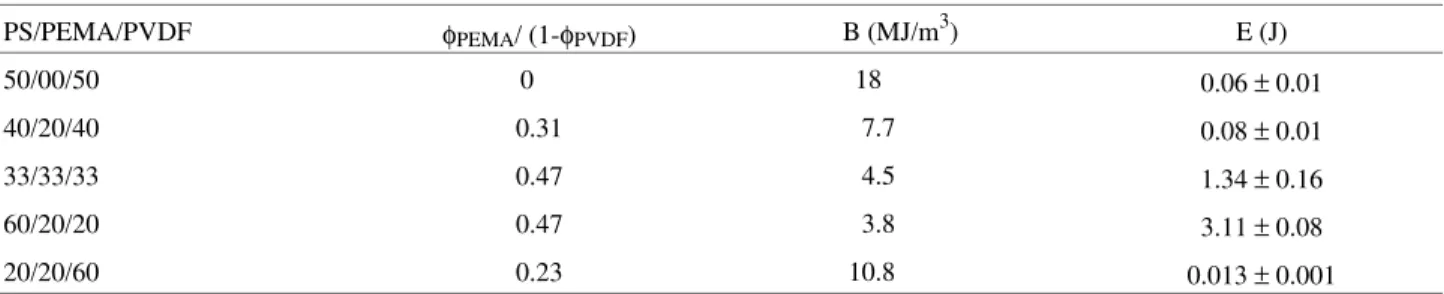
For PVDF/PS, B = 18 x 106 J/m3; for PVDF/PEMA, B = -12.8 x 10⁶ J/m3; and for PS/PEMA, B = 5.0 x 10⁶ J/m3. Using Eq. 4 the B123 values can be estimated for PS/PEMA/PVDF. The B values tend to decrease (miscibili-ty increases) as the PEMA content increases, as shown in Table 4. Blends with lower B values are also able to absorb more energy before breaking, as shown in Table 4. For PVDF/PMMA, B = -17.3 x 10⁶ J/m3 and for PMMA/PS, B = 0.2 x 10⁶ J/m3.
Considering only the binary PVDF/PXMA mixtures, a strong synergic effect was observed for X = methyl and ethyl. Both high strength and energy at break values were observed with 66 wt % PVDF.
The values of energy and strength at break responses obtained for the experimental design in Figure 1 are pre-sented in Tables 1, 2 and 3 for the PS/PMMA/PVDF, PS/PEMA/PVDF and PS/PBMA/PVDF systems. The re-sponse values are averages of duplicate or higher replicate Table 2. Average energy and strength at break values and their standard deviations for the mixture design of the PS/PBMA/PVDF blendsa.
Composition Energy at break (J) Strength at break (MPa)
PBMA 0.515 ± 0.064 6.520 ± 1.24
PVDF 3.895 ± 0.601 64.400 ± 3.96
PS 0.635 ± 0.007 24.05 ± 0.07
PBMA/PVDF 50/50 0.309 ± 0.076 4.298 ± 0.50
PBMA/PS 50/50 1.201 ± 0.068 12.467 ± 1.97
PVDF/PS 50/50 0.060 ± 0.014 24.620 ± 6.22
PBMA/PVDF 66/33 0.716 ± 0.035 8.070 ± 0.229
PBMA/PVDF 33/66 0.178 ± 0.021 5.720 ± 0.75
PBMA/PS 66/33 3.042 ± 0.077 6.535 ± 0.16
PBMA/PS 33/66 0.625 ± 0.013 23.33 ± 11.63
PVDF/PS 66/33 0.078 ± 0.015 8.412 ± 1.47
PVDF/PS 33/66 0.007 ± 0.000 0.870 ± 0.07
PS/PBMA/PVDF 33/33/33 0.470 ± 0.090 10.775 ± 1.00
a) See Table 1.
Table 3. Average energy and strength at break values and their standard deviations for the mixture design of the PS/PEMA/PVDF blendsa.
Composition Energy at break (J) Strength at break (MPa)
PEMA 0.950 ± 0.141 46.528 ± 2.69
PVDF 3.895 ± 0.601 64.400 ± 3.96
PS 0.635 ± 0.007 24.050 ± 0.07
PEMA/PVDF 50/50 1.70 ± 0.042 104.80 ± 2.12
PEMA/PS 50/50 0.615 ± 0.247 39.10 ± 0.17
PVDF/PS 50/50 0.0600 ± 0.014 24.6 ± 6.22
PEMA/PVDF 66/33 21.848 ± 2.613 180.63 ± 16.75
PEMA/PVDF 33/66 41.995 ± 6.541 236.05 ± 19.66
PEMA/PS 66/33 0.915 ± 0.109 26.488 ± 2.11
PEMA/PS 33/66 0.564 ± 0.064 9.350 ± 0.65
PVDF/PS 66/33 0.083 ± 0.012 8.412 ± 1.48
PVDF/PS 33/66 0.00570 ± 0.000 1.405 ± 0.09
PS/PEMA/PVDF 33/33/33 1.335 ± 0.163 37.175 ± 2.98
determinations. Standard deviations for all the response averages are also included in these tables.
Full cubic models obtained by multiple linear regres-sion using Eq. 3 proved to be the best in fitting properties of the PS/PMMA/PVDF and PS/PBMA/PVDF mixtures (see Table 5). They were statistically significant well above the 95% confidence level for energy and strength at break responses. The PMMA models present marginally signifi-cant lack of fit values at the 95% confidence level; however almost all of the explainable variance has been described by the model. The lack of fit for the PBMA models is higher than for the PMMA ones. The high percentage variance (96%) reproduced for the energy at break response is an indication that the energy at break values predicted by the full cubic model are in good agreement with the experimen-tal results. The percentage variance of the experimenexperimen-tal
strength at break values obtained by the full cubic model is much less, 83%. Even though this regression model is highly significant, their predicted strength at break values are less accurate than those for the PS/PMMA/PVDF sys-tem. The model parameters for the energy and strength at break responses of the PS/PMMA/PVDF and PS/PBMA/PVDF mixture energies are presented in Tables 6 and 7.
The best results for the energy and strength at break data of the PS/PEMA/PVDF system were obtained for special cubic models for both responses; however for this system the regressions are not statistically significant presenting extremely high lack of fit. Evidently all the models are too simple to reproduce the complex behavior of the responses for this system. The reason for this lack of fit is that the models, even the full cubic one, are not capable of
repro-Table 4. Interaction parameters, B, calculated with Eq. 4 and measured energy at break, E, for PS/PEMA/PVDF blends.
PS/PEMA/PVDF φPEMA/ (1-φPVDF) B (MJ/m3) E (J)
50/00/50 0 18 0.06 ± 0.01
40/20/40 0.31 7.7 0.08 ± 0.01
33/33/33 0.47 4.5 1.34 ± 0.16
60/20/20 0.47 3.8 3.11 ± 0.08
20/20/60 0.23 10.8 0.013 ± 0.001
Table 5. Analysis of the variance of the energy and strength at break regression results for the three ternary systemsa. Energy at break
PS/PMMA/PVDF PS/PBMA/PVDF PS/PEMA/PVDFb
MSreg/MSr 253.3 92.3 190.7
Fν1,ν2 F9,31 = 2.2 F9,36 = 2.1 F9,26 = 2.3
MSlf/MSpe 5.4 34.2 0.04
Fν1,ν2 F2,28 = 3.3 F3,33 = 2.9 F2,24 = 3.0
% variance 99(99) 96(99) 99(99)
Strength at break
PS/PMMA/PVDF PS/PBMA/PVDF PS/PEMA/PVDFb
MSreg/MSr 51.1 19.0 153.7
Fν1, ν2 F9,33 = 2.2 F9,34 = 2.2 F9,34 = 2.2
MSlf/MSpe 6.5 28.2 28.1
Fν1,ν2 F2,28 = 3.3 F3,31 = 2.9 F2,30 = 3.0
% variance 93(96) 83(95) 98(99)
a) MSreg, MSr, MSlf and MSpe are the mean squares (sum of squares divided by number of degrees of freedom) of regression, residuals, lack of fit and pure error respectively. The Fν1,ν2 are tabulated 95% confidence values for the F distribution with ν1 and ν2 degrees of freedom. When the calculated
MSlf/MSpe ratio is smaller than Fν1,ν2 the regression does not have significant lack of fit. In these cases the fact that the MSreg/MSr ratios are larger than their corresponding Fν1,ν2 values indicates a significant regression equation. The % variance results refer to the percentage of experimental results explained
by the regression followed by the percentage explainable variance in parentheses.
ducing the low PEMA/PVDF 50/50 experimental energy at break value since it is situated between two high values for the PEMA/PVDF 66/33 and 33/66 binary mixtures. This was confirmed by removing the PEMA/PVDF 50/50 mixture values from the data set and repeating the regres-sion analysis. The model for this reduced data set was highly significant and had no detectable lack of fit. Similar behavior is found for the strength at break values. Here also the 50/50 PEMA/PVDF binary mixture has a much lower value than the 66/33 and 33/66 mixtures for these polymers. The mixture model parameter values and their standard errors for the energy and strength at break responses of the PS/PEMA/PVDF system for the reduced data set are
in-cluded in Tables 6 and 7. The corresponding analysis of the variance values are given in Table 5. The anomalous be-haviors of the 50/50 PEMA/PVDF energy and strength at break values may result from a higher crystallinity. Crys-tallinity was evaluated by X-Ray diffraction for PEMA/PVDF binary blends obtained in the same condi-tions by extrusion. Values are shown in Table 8. Crystal-linity decreases from 73% for pure PVDF to 40% when 33% PEMA is added but increases again to 50% when the PEMA content in the binary blend is 50%. The models should describe better totally amorphous systems or sys-tems for which crystallinity linearly decreases with
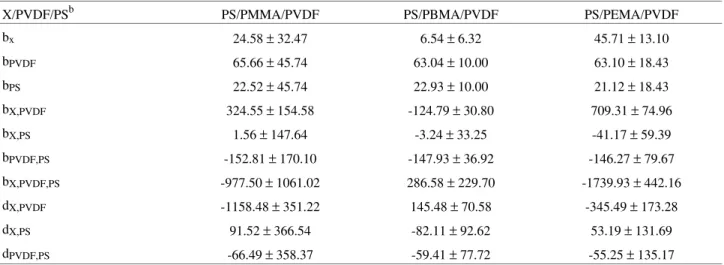
addi-Table 6. Complete cubic mixture model parameters and their 95% confidence interval values for the energy at break responses of the three ternary systemsa.
X/PVDF/PSb PS/PMMA/PVDF PS/PBMA/PVDF PS/PEMA/PVDF
bx 0.33 ± 0.98 0.44 ± 0.08 0.95 ± 2.50
bPVDF 4.06 ± 1.54 3.87 ± 0.16 3.88 ± 2.50
bPS 0.62 ± 1.54 0.67 ± 0.16 0.63 ± 2.50
bX,PVDF 70.06 ± 5.14 -7.61 ± 0.51 135.57 ± 10.53
bX,PS -1.25 ± 5 4.57 ± 0.55 -0.32 ± 9.23
bPVDF,PS -10.10 ± 5.69 -9.81 ± 0.61 -9.71 ± 9.23
bX,PVDF,PS -216.38 ± 36.19 6.21 ± 3.87 -393.36 ± 77.98
dX,PVDF -224.18 ± 12.29 11.50 ± 1.26 -133.45 ± 22.15
dX,PS 2.20 ± 13.09 17.34 ± 1.43 1.67 ± 19.22
dPVDF,PS -7.68 ± 11.71 -7.17 ± 1.28 -7.25 ± 18.99
a) 95% confidence interval values obtained calculated using the values of Tables 2 and 3 and the appropriate t-distribution parameters. b) Unit of Joules, J. X = PMMA, PBMA and PEMA.
Table 7. Complete cubic mixture model parameters and their 95% confidence interval values for the strength at break responses of the three ternary systemsa.
X/PVDF/PSb PS/PMMA/PVDF PS/PBMA/PVDF PS/PEMA/PVDF
bx 24.58 ± 32.47 6.54 ± 6.32 45.71 ± 13.10
bPVDF 65.66 ± 45.74 63.04 ± 10.00 63.10 ± 18.43
bPS 22.52 ± 45.74 22.93 ± 10.00 21.12 ± 18.43
bX,PVDF 324.55 ± 154.58 -124.79 ± 30.80 709.31 ± 74.96
bX,PS 1.56 ± 147.64 -3.24 ± 33.25 -41.17 ± 59.39
bPVDF,PS -152.81 ± 170.10 -147.93 ± 36.92 -146.27 ± 79.67
bX,PVDF,PS -977.50 ± 1061.02 286.58 ± 229.70 -1739.93 ± 442.16
dX,PVDF -1158.48 ± 351.22 145.48 ± 70.58 -345.49 ± 173.28
dX,PS 91.52 ± 366.54 -82.11 ± 92.62 53.19 ± 131.69
dPVDF,PS -66.49 ± 358.37 -59.41 ± 77.72 -55.25 ± 135.17
tion of the amorphous component. The crystallinity may decrease the strength at break to unexpected values.
The bPVDF, bPS, bPVDF,PS and dPVDF,PS parameters de-pend only on the PVDF and PS components. For this reason their values are expected to be constant, as the third com-ponent changes among PMMA, PBMA and PEMA. This can be confirmed by examining the values of these parame-ters in Tables 6 and 7. The bPVDF energy at break values are all statistically significant as can be seen in Table 6 with values varying form 3.87 to 4.06 J for the three ternary systems. At the 95% confidence levels this parameter is equivalent to the 3.90 J energy at break value measured for pure PVDF and given in Tables 1-3. In a similar way the measured strength at break value of 64.4 MPa in these tables are equivalent to all the bPVDF parameter values in Table 7. Also the bPS energy at break values in Table 6 are equivalent at the 95% confidence interval to the measured average energy at break value of 0.64 J except for the 0.67
PS/PBMA/PVDF. For strength at break values bPS is sig-nificant at the 95% confidence level of the PBMA and PEMA ternary systems.
The bPVDF,PS energy at break parameters are all statisti-cally significant and vary from -9.71 J for the PEMA system to -10.10 J for PMMA. These results clearly indi-cate the existence of an antagonistic interaction between PVDF and PS independent of whether the third component is PMMA, PBMA or PEMA. They are consistent with the fact that PVDF and PS are immiscible. An analogous observation can be made for the bPVDF,PS parameter for strength at break. The intensity of the antagonistic interac-tion between PVDF and PS does not depend on the third component present since the bPVDF,PS parameter values are almost the same. The remaining model parameter charac-terized by only PVDF and PS, dPVDF,PS, is not evaluated to be an important model parameter and is statistically insig-nificant for all the strength at break and energy values
except for the energy parameter of the PS/PBMA/PVDF system.
Large synergic effects between PVDF and both PMMA and PEMA are indicated by the positive bX,PVDF, X = PMMA and PEMA, energy and strength at break values in Tables 6 and 7. All the 66/33 and 33/66 PMMA:PVDF and PEMA:PVDF mixtures have energy and strength at break values that are much larger than those found for the three pure PMMA, PEMA and PVDF components. Even the 50/50 PEMA:PVDF strength at break value (105 MPa) is much larger than the values of this response for the pure PEMA and PVDF components, 47 and 64 MPA. This stems from the high PEMA/PVDF and PMMA/PVDF miscibili-ties (low Bij values).
The evidence for the strong synergic interactions in-volving PMMA-PVDF and PEMA-PVDF contrast with those for PBMA-PVDF. The bPBMA,PVDF values are signifi-cant and negative, -7.61 J and -124.79 MPa. The 66/33, 50/50 and 33/66 binary PBMA-PVDF mixtures all have energy and strength at break values well below the corre-sponding pure PVDF values, 3.90 J and 64.4 MPa, and below or only slightly higher than the response values for pure PBMA, 0.51 J and 6.52 MPa.
The only significant binary interaction involving the PXMA components and the PS polymer occurs for the PBMA/PS interaction for the energy at break response. The bPBMA,PS value of 4.57 ± 0.55 J indicates a small but highly significant synergic effect between the polymeric compo-nents. However this binary effect is not significant for the PBMA/PS interaction for strength at break.
Antagonistic three component interactions for energy and strength at break values for the PS/PMMA/PVDF and PS/PEMA/PVDF systems are indicated by the negative bPMMA,PVDF,PS and bPEMA,PVDF,PS parameter values in Ta-bles 6 and 7. These results indicate interactions affecting both response values only when all three ingredients of each system are present simultaneously in the mixture. However the effect of these ternary antagonistic interac-tions on the energy and strength at break values are more than compensated by contributions from the bX,PVDF terms. On the other hand the bPBMA,PVDF,PS values of 6.21 ± 3.87 J and 286.58 ± 229.50 MPa indicate synergic effects in-volving all three mixture ingredients that can not be ex-plained by possible binary interactions.
The dij cubic parameters are more difficult to interpret. Negative dx,PVDF coefficients are found for the PS/PMMA/PVDF and PS/PEMA/PVDF ternary systems. In contrast the dX,PVDF values for the PS/PBMA/PVDF systems are positive and statistically significant although their absolute magnitudes are smaller than those for the other ternary systems. The dX,PS parameters are not statis-tically significant except for the PS/PBMA/PVDF energy and strength at break results. The energy at break dPBMA,PS
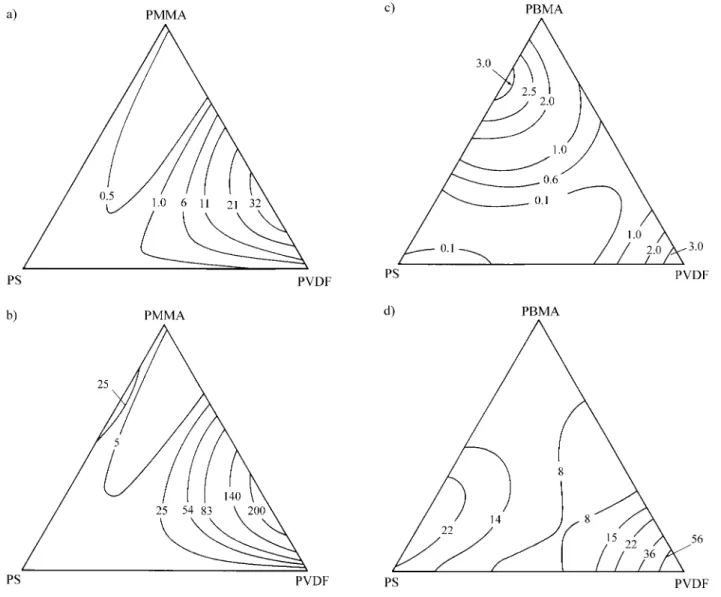
parameter is negative whereas the strength at break pa-rameter is positive. This contrasts with all other statistically significant model parameters for which identical signs are observed for both the energy or strength at break responses. Isoresponse contour curves for the energy and strength at break properties as a function of the PS/PMMA/PVDF and PS/PBMA/PVDF component proportions are presented in Fig. 2. The response surface contour curves for the energy and strength at break responses of the PS/PMMA/PVDF system have essentially the same forms as can be seen in Figs. 2a and 2b. This indicates that these properties are highly correlated for this ternary system. Values of energies and strengths at break are predicted to be maximum for binary mixtures of about 30% PMMA and 70% PVDF. The left hand sides of both the energy and strength at break concentration triangles, representing mixtures rich in PS and/or PVDF, have response values close to zero. Table 9 shows values of tensile strength at break for PS/PMMA/PVDF which were not used to cons-truct the models and the isoresponse contour curves. They can therefore be used to confirm the model efficiency. As can be seen all the values are in agreement with the predicted values in Fig. 2.
The energy at break values of the PS/PBMA/PVDF binary and ternary mixtures are all smaller than the energy at break of pure PVDF. All the PS/PBMA/PVDF measured energy at break values are predicted by the mixture model to be less than 4 J, much less than the energy at break values observed for the PMMA/PVDF 50/50 and 33/66 binary mixtures. This same ordering is also observed for the strength at break values of the PS/PBMA/PVDF and PS/PMMA/PVDF systems. This indicates that PMMA is a better compatibilizer than PBMA for the PVDF/PS system. As shown from the bPXMA,PVDF values a synergic interac-tion was observed between PMMA and PVDF but not between PBMA and PVDF.
Table 8. Percentage of crystallinity of PEMA/PVDF binary blends.
Blend Percentage of crystallinity (%)
PEMA/PVDF 33/66 40 ± 2%
PEMA/PVDF 50/50 49 ± 3%
PEMA/PVDF 66/33 43 ± 2%
PVDF 73 ± 5%
Table 9. Strength at break for PS/PMMA/PVDF system.
PS/PMMA/PVDF Strength at break (MPa)
49/2/49 21.5 ± 1.9
47.5/5/47.5 23.5 ± 2.4
45/10/45 35.1 ± .4
Conclusions
Full cubic statistical models describe with high signifi-cance the mechanical properties of the PS/PMMA/PVDF and PS/PBMA/PVDF ternary blends. For ternary blends with PEMA in contrast to those with PMMA or PBMA, the lack of fit was high due to exceptionally low energy and strength at break values measured for 50/50 PEMA/PVDF mixtures. At least for ternary blends containing PMMA or PBMA, isoresponse contour curves could be used to predict the mechanical properties for the whole range of mixture compositions from just a limited number of experimental points. As expected statistical models describe better totally amorphous systems or systems for which crystal-linity decreases linearly with addition of the amorphous component.
Statistical bij parameters determined for these models reflect the miscibility between each polymer component pair. Results also show better performance for PEMA and PMMA as compatibilizers than for PVDF/PS blend when mixed with PBMA.
Acknowledgments
The authors thank FAPESP and CNPq for partial finan-cial support. I.N. thanks CNPq for a graduate fellowship.
References
1. Utracki, L.A. In Polymer Alloys and Blends: Thermo-dynamics and Rheology; Carl Hanser Verlag, 1990.
2. Siqueira, D.F.; Galembeck, F.; Nunes, S.P. Polymer 1991, 32, 990.
3. Fowkes, F.M.; Tischler, D.O.; Wolfe, J.A.; Lannigan, L.A.; Ademu-John, C.M.; Halliwell, M.J. J. Polym. Sci.: Polym. Chem. Ed. 1984, 22, 547.
4. Nishi, T.; Wang, T.T. Macromolecules1975, 8, 909. 5. Roerdink, E.; Challa, G. Polymer1978, 19, 173. 6. Wendorff, J.H.; J. Polym. Sci.: Polym. Lett. Ed. 1980,
18, 439.
7. DiPaola-Baranyi, G.; Fletcher, S.J.; Degré, P. Macro-molecules1982, 15, 885.
8. Roerdink, E.; Challa, G. Polymer1980,21, 1161. 9. Al-Saigh, Y.Z.; Chen, P. Macromolecules1991, 24,
3788.
10. Wu, S. In Polymer Interfaces and Adhesion; Marcel Dekker Inc.,1982.
11. Cornell, J.A. In Experiments with Mixtures: designs, models and the analysis of mixture data; John Wiley & Sons, 1990.
12. Neto, B.B.; Scarminio, I.S.; Bruns, R.E. In Plane-jamento e Otimização de Experimentos; Editora da UNICAMP, 1995.
13. Siqueira, D.F.; Bruns, R.E.; Nunes, S.P. Polymer Net-works and Blends1993, 3, 63.
14. Paulo, D.R.; Barlow, J.W. In Polymer Compatibility and Incompatibility; K. Solc., Ed., Harwood Aca-demic Publishers, 1982.