Article
Seasonality Influence in the Distribution of Formic and Acetic Acids in
the Urban Atmosphere of São Paulo City, Brazil
Silvia R. Souza and Lilian R. F. Carvalho*
Instituto de Química, Universidade de São Paulo, CP 26077, 05513-970, São Paulo - SP, Brazil
Níveis ambientais diurnos de ácido fórmico e acético foram medidos na atmosfera da cidade de São Paulo no inverno e na primavera de 1996. Foi feita uma comparação das concentrações dos ácidos carboxílicos entre dois sítios urbanos distintos. Os resultados demonstraram que os níveis de ácidos carboxílicos foram afetados pela variação sazonal no sítio com contribuição alta de emissão veicular enquanto que no outro sítio estudado não foi observada esta influência. As concentrações variaram de 0,64 a 11,8 ppbv para ácido fórmico e 0,51 a 10,7 ppbv para ácido acético. Os dados obtidos foram discutidos em relação à emissão direta e a produção fotoquímica in situ.
Ambient levels and diurnal profiles of formic and acetic acids were measured in the atmosphere of São Paulo City in winter and spring 1996. A comparison between two different urban sites was done. Results demonstrate that carboxylic acid levels were affected by seasonality in the site with high vehicular emission density, while no seasonal influence was observed for the other site studied. Ranges of mixing ratios from 0.64 to 11.8 ppbv for formic acid and 0.51 to 10.7 ppbv for acetic acid were recorded. The results concerning the carboxylic acid concentrations were discussed with respect to direct emission and in situ photochemical production.
Keywords: lower carboxylic acids, seasonal trends, urban atmosphere of São Paulo City
Printed in Brazil 0103 - 5053 $6.00+0.00
Introduction
The harmful effects of air pollutants on human beings and living organisms have been the major reason for the efforts made to understand and control their sources. The polluted urban atmospheres contain thousands of differing organic and inorganic species that lead to a complex array of chemical and physical transformations, resulting in such apparently diverse effects as photochemical air pollution, acid deposition, long-range transport of chemicals, changes in the stratospheric ozone layer and global weather modification.
During episodes of air pollution in urban areas, chemical reactions occur with species emitted directly from anthropogenic or natural sources and secondary pollutants are formed in the atmosphere. There is a great need for evaluations of the chemical reactions occurring in the urban atmosphere in order to develop a detailed understanding of the atmospheric chemistry. Air pollutants are a complex mixture of many thousands of compounds distributed over many organic classes. In general, hydrocarbons, such as alkanes, alkenes and aromatics are released to the
atmosphere, whereas oxygenates are formed and emitted in the atmosphere.
Among these oxygenated hydrocarbons, organic acids have been a recent target of interest in the urban atmospheric chemistry, because they may be emitted by stationary and mobile sources and are also formed in polluted air by chemical reactions, including the reaction of ozone with olefins1.
Low molecular weight organic acids have been identified and measured in a wide variety of environments, such as marine and continental air, urban, rural, and remote atmospheres, tropical forest and temperate zones2-6. Formic acid and acetic acid constitute the most abundant carboxylic acids in the global troposphere, in particular, in the polluted urban air7-9.
fuels and biomass is an important source of organic acids, e. g. vehicle exhausts, smoke stacks and burning of leaves, hay, and wood, which release these compounds, in particular, acetic acid22.
Ozonolysis of anthropogenic or natural unsaturated hydrocarbons should lead to the formation of carboxylic acids. The reaction between ozone and olefins seems to be an effective pathway for producing acetic acid, but the amount of acetic acid formed is believed to be smaller than that of formic acid23,24. The photochemical oxidation of isoprene and terpenes emitted from plants produces formic acid, nevertheless does not yield significant acetic acid18. At present, the hypothesized sources of organic acids are based on limited published data for concentrations of organic acids in vapor, particulate and aqueous phases at a wide variety of continental and marine locations. To help identify the major emission sources responsible for adverse human health effects, a comprehensive survey of atmospheric contaminants from a variety of sources has been performed over the world. The potential human health effects caused by air pollutants range from short-term respiratory ailments to genotoxicity such as cancer and reproductive effects.
Measurements of ambient levels of atmospheric carboxylic acids in North America, Asia, Europe and Africa have been reported. However, little is known about such species in the atmosphere of Brazil, where there is a mix of quite different combustion sources, exhaust emissions from vehicles fueled with gasohol (gasoline + 22% ethanol), diesel and hydrated ethanol.
Our experiments on characterization of atmospheric organic acids carried out recently in São Paulo City, Brazil, revealed significant amounts of such species in both gas and particle phases25. The relative abundance of carboxylic acids in a megacity with serious air pollution problems is an important aspect to be investigated in more detail. In this sense, a study based on daily mean measurements of formic acid and acetic acid was carried out in São Paulo City during spring and winter 1996. This paper reports the distribution of both acids in the urban atmosphere and discusses the seasonal changes of their concentrations in terms of primary emission and secondary production in the atmosphere. Results of measurements from winter 1997 are also included.
Experimental
Sampling
The atmospheric air collections were performed from a tower at about 30 m above ground level near the building
of the Institute of Chemistry on the main campus of the University of São Paulo. This site, named site A, located in the southwestern area of São Paulo City, is considered to be potentially impacted by different types of sources. The sampling site is surrounded by a large vegetation area with very little local traffic. Approximately 2 km far from the latter, there is a major highway with frequent heavy vehicular traffic mainly constituted by diesel trucks and gasohol and ethanol automobiles. Other traffic arteries around the site are also observed. In addition to the different research activities performed in the buildings belonging to the University of São Paulo, the area has many open, unoccupied lots which are sources of windblown dust. There are numerous wide covered grass with open spaces, many extensive gardens and a grove. Thus, besides anthropogenic emissions, there are several local natural sources from the vegetation around the sampling site.
Measurements of gaseous formic and acetic acids were also carried out simultaneously in another urban area. This other site, named site B, presents different features compared to those of site A. Samplers were placed in an open area up on the roof of the sampling station of the CETESB (Companhia de Tecnologia de Saneamento Ambiental do Estado de São Paulo), a state environmental protection agency. It is a densely populated commercial/ residential district near downtown. There are some hospitals and a large cemetery around the site. Traffic along the main street (Av. Dr. Arnaldo), where the sampling was performed, is heavy with a fleet composed mostly of automobiles fueled with gasohol and ethanol, regularly scheduled diesel buses and some diesel trucks. The site is surrounded by traffic arteries carrying commercial and passenger vehicles. During the rush hours, traffic is significantly increased, generating large local traffic jams.
In both sites, there are no local industrial sources, but there are distinct characteristics, previously described, which affect the composition of the species present in the environment around each one.
Sampling was undertaken on work-days in winter (July, August and September, 1996; August and September, 1997) and spring (September, October and November, 1996) for a total of 38 samples with 92% of detection (site A) and a total of 27 samples with 88% of detection (site B). Meteorological parameters, such as temperature (av., 15.2 and 22.1oC) and relative humidity (av., 72.7 and 67.2%) were recorded during the sampling in winter and spring, respectively (site A); and, temperature (av., 21.5 and 22.8oC) and relative humidity (av., 75.2 and 66.3%) in winter and spring, respectively (site B).
Analytical procedures
A few hours after sampling, denuders were extracted with pure water. These had been previously evaluated for their efficiency in collecting of gaseous formic and acetic acids by using of a controlled atmosphere generation system for which both showed to be efficient: formic acid (97 ± 3%) and acetic acid (113 ± 3%)25.
Chloroform was added to the aqueous extracts and the solutions were stored in a polyethylene vial in a refrigerator. Samples were analyzed within 15 days of the sampling date. Chemical analyses were performed using a Dionex Series 4000i ion chromatograph. Separation was accomplished using a Dionex AS5-A separator column with a Dionex AMMS-1 anion micromembrane suppressor and a conductivity detector. The column was protected upstream by an HPIC AG-5A guard column. A sample volume of 500 µl was used. The concentration means, µg L-1, and relative standard deviations (RSD) for replicate analyses, n = 6, and the detection limits of anion standards were, respectively, 156 ± 8.31 x 10⁻¹ and 50.1 µg L-1 for acetate, 212 ± 9.52 x 10⁻¹ and 102.0 µg L-1 for formate.
Results and Discussion
Ambient levels
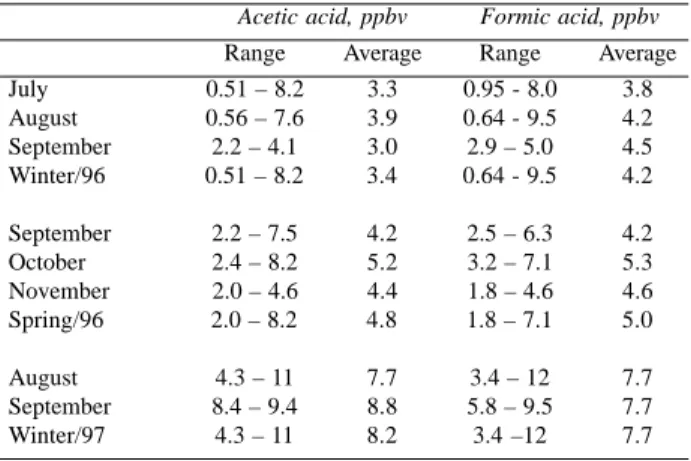
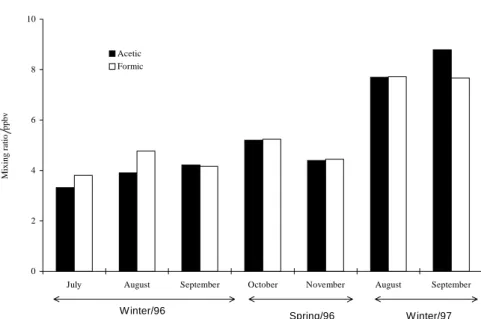
Ambient levels of gaseous acetic and formic acids were determined during winter, spring 1996 and winter 1997 at an urban site (site A) located in the São Paulo City. Mixing ratios of the carboxylic acids are presented in Table 1. Results for formic and acetic acids, whose ranges were from 0.64 to 12 ppbv and 0.51 to 11 ppbv, respectively, are comparable with those observed in other urban sites (for example, 0.9 – 8.5 ppbv for formic acid and 1.3 – 8.1 ppbv for acetic acid, in Brussels, Belgium)23 and rural regions (for example, 0.6 – 7 ppbv for formic acid and 1.2 – 7.5 ppbv for acetic acid, in Bavarian, Germany)19.However, they were slightly higher than those seen in remote areas and forest regions7,19. Independent of the season, the general temporal trends in both formic and acetic acid concentrations shown in Figure 1 were similar, leading to a high degree of correlation (r= 0.92 spring, r = 0.83 winter) between them. This might suggest that their sources, at any sampling period, are similar and eventually identical25. Available results on formic and acetic acids in several urban, sub-urban and rural areas have also evidenced a strong correlation between both acids4,23,24,26-28.
It is known that in sunny days, the photochemical reactions are greatly favored because of the photochemical activity is a function of the sunlight intensity. In our winter, sunny days are frequent, as well as dust and atmospheric pollutants are often trapped in inversion layers over São Paulo. These
Table 1. Mixing ratio and relative abundance of gaseous carboxylic acids in site A (campus of University of São Paulo, São Paulo City, Brazil).
Acetic acid, ppbv Formic acid, ppbv
Range Average Range Average July 0.51 – 8.2 3.3 0.95 - 8.0 3.8 August 0.56 – 7.6 3.9 0.64 - 9.5 4.2 September 2.2 – 4.1 3.0 2.9 – 5.0 4.5 Winter/96 0.51 – 8.2 3.4 0.64 - 9.5 4.2
September 2.2 – 7.5 4.2 2.5 – 6.3 4.2 October 2.4 – 8.2 5.2 3.2 – 7.1 5.3 November 2.0 – 4.6 4.4 1.8 – 4.6 4.6 Spring/96 2.0 – 8.2 4.8 1.8 – 7.1 5.0
August 4.3 – 11 7.7 3.4 – 12 7.7
September 8.4 – 9.4 8.8 5.8 – 9.5 7.7 Winter/97 4.3 – 11 8.2 3.4 –12 7.7
Table 2. Mixing ratio and relative abundance of gaseous carboxylic acids in site B (downtown, São Paulo City, Brazil).
Acetic acid, ppbv Formic acid, ppbv
Range Average Range Average September 1.1 – 6.2 2.3 1.1 - 7.5 2.8 October 1.9 – 2.9 2.5 2.6 - 3.6 3.1 Spring/96 1.1 – 6.2 3.9 1.1 - 7.5 2.9
July 2.5 – 7.3 4.9 2.1- 7.2 4.3
August 5.6 – 6.7 4.2 1.3 - 5.8 3.8 Winter/97 2.5 – 7.3 4.5 1.3 - 7.2 4.1
The average mixing ratios of organic acids during the winter 1997 were higher in magnitude than winter 1996 and exhibited a different average pattern of the acetic and formic acids in relation to winter 1996 (Figure 2). Such ambient level changes of the organic acids may be attributed to the distinct meteorological conditions brought on by the El Ninõ phenomenon, which occurred in winter 1997. High temperatures and low relative humidities were recorded in this period.
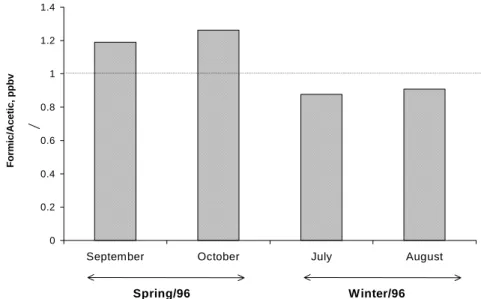
In previous studies on measurements of gaseous carboxylic acids, the formic-to-acetic acid ratio has been used to suggest their sources. The resulting ratio may be taken as an indicator of direct emission (low ratio, < 1)
and in situ formation by photochemical processes (high ratio, > 1)24,25,34. Direct emissions from vehicles lead to increased acetic acid ambient levels, whereas direct emissions from vegetation may provide higher levels of formic than acetic acid15,17,22. In addition to direct emissions of formic acid, atmospheric ozone reacts with olefins from vegetative emissions producing formic acid, and high ambient temperature and solar irradiation contribute to the occurrence of this photochemical mechanism35.
Based on our recent tunnel data, F/A = 0.25, in which emissions from gasohol vehicles and alcohol motor exhaust are the dominant sources25, and on our urban site results (Figure Figure 1. Distribution of carboxylic acids in the gaseous samples (site A, São Paulo City).
0 2 4 6 8 10
July August September October November August September
Mixing ratio, ppbv
Acetic Formic
Winter/96 Spring/96 Winter/97
Figure 2. Diurnal variation of carboxylic acids averaged over the whole observation period (site A, São Paulo City).
0 2 4 6 8 10 12 14
03/
jul
09/
jul
22/
ag
o
25/
ag
o
03/
s
e
t
23/
s
e
t
05/
o
ut
25/
o
ut
08/
ag
o
13/
ag
o
20/
ag
o
08/
s
e
t
m
ix
ing
r
a
ti
o,
p
p
b
v
Acetic Formic
Winter 1996 Spring 1996 Winter 1997
3a) of winter 1996 (F/A average = 1.2) and spring 1996 (F/A average = 0.96), we suggest that, independent of seasonal features, both direct emission and photochemical formation are the sources of acetic and formic acids in urban site A.
In site A, marked seasonal differences in the ratios of these carboxylic acids were not observed (Figure 3a) and similar or identical sources might have been responsible for their presence in air. The hypothesis of biogenic emissions in the atmosphere and mass transport of these acids due to meteorological factors, however, should be considered when seasonality in concentrations is analyzed.
Seasonal variation
Seasonal variations in the atmospheric concentration of carboxylic acids should reflect seasonal variations in the
source of gases, atmospheric chemistry and meteorology. It is known that seasonal variations in atmospheric chemistry are strongly influenced by meteorology. In Central Valley, California, during wintertime, with lower temperatures and sunlight intensity, there is much less photochemistry. Also, in this region, local emissions from traffic and mesoscale meteorology are more pronounced in winter 32.
In previous studies carried out in the USA, measurements of gaseous carboxylic acids have shown that seasonal variations in formic and acetic acid concentrations may be due to seasonal variations in the relative composition of hydrocarbons and ozonolysis reactants (e.g. O3, OH, HO2), and in the rate constants with temperature. In winter, OH concentrations may be one order lower and O3 not more than twice as low as compared to summer. Although O3
0 0.2 0.4 0.6 0.8 1 1.2 1.4
July August September October November August September
Formic/Acetic, ppbv
W inter/96 Spring/96 W inter/97
Figure 3a. Formic to acetic acid ratios in the gaseous samples (site A, campus of USP, São Paulo City).
0 0.2 0.4 0.6 0.8 1 1.2 1.4
September October July August
Formic/Acetic, ppbv
Spring/96 Winter/96
SITE A
0 2 4 6 8 10 12 14
0 2 4 6 8 10 12
[CH3COOH], ppbv
[HCOOH], ppbv
Spring
Winter
Figure 4a. Correlation between acetic acid and formic acid in site A (campus of USP, São Paulo City).
SITE B
0 1 2 3 4 5 6 7 8
0 1 2 3 4 5 6 7 8
[CH3COOH], ppbv
[HCOOH], ppbv
_ _ _ W inter _______ Spring
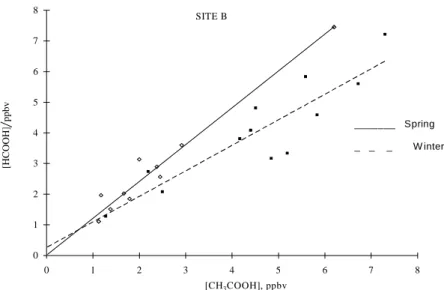
Figure 4b. Correlation between acetic acid and formic acid in site B (downtown, São Paulo City). concentrations in winter are lower than summer, acetic and
formic acids production is generally higher in winter. For ethene, the reaction with OH is important both in summer and winter, while for higher alkenes, the ozonolysis reactions are important especially in winter. For HO2 radicals, the reactions occur preferably in summer. The seasonal variation may also be affected by the assumed faster deposition rate for formic acid during winter32.
In order to evaluate a seasonal trend in the carboxylic acid concentration in the atmosphere of São Paulo City, two sampling sites (A and B) located in distinct urban areas were compared. Mixing ratios of carboxylic acids found in site B are listed in Table 2. Mixing ratios of acetic and formic acids ranging respectively from 1.2 to 7.2 and 1.1 to 7.5 ppbv were observed. Results indicate that there was practically no difference between slopes of the regressions
for the two seasons in site A (Figure 4a). In contrast, it is possible to observe a significant difference between the regression slopes for each season in site B (Figure 4b), which indicates that different sources, precursors or transformation sequences predominate during winter and spring in site B.
The high correlation coefficients associated with each regression for both A and B sites show that formic acid (rA = 0.92; rB = 0.81) and acetic acid (rA = 0.82; rB = 0.98) may originate from a common source or be controlled by a common reactant during each season. Alternatively, the observed correlation could also result from the production of these acids by different sources, which have fairly constant relative strengths7.
site A, such acids exhibited a low correlation (r = 0.50, formic; r = 0.13, acetic) with CO (direct emission) and a very high correlation (r = 0.86, formic; r = 0.84, acetic) with O3 (photochemical production). Although there are primary emissions of both formic and acetic acids in the site A, photochemical transformations are also a very likely source for such acids. Considering both spring and winter studies carried out in site A, the contribution of photochemical activity to carboxylic acid production does not seem to be influenced by seasonality25. On the other hand, in site B, a high vehicular emission density area, the acids were strongly correlated with CO (r= 0.79 , formic; r = 0.56, acetic). As already demonstrated by regression analysis (Figure 4b), there are different sources contributing during winter and spring in site B. Results for formic to acetic acid ratios in winter (F/A average = 0.80) and spring (F/A average = 1.2) suggest that both direct emission and photochemical formation are important sources of acetic and formic acids in site B (Figure 3b).
Conclusions
Results for atmospheric concentrations of formic and acetic acids show that seasonality influenced the site (site B) with high vehicular emission density.
In site A, photochemical transformations were a very likely source for both formic and acetic acids, since a high correlation between these acids and ozone was observed. Considering both spring and winter, the contribution of photochemical activity to carboxylic acid production does not seem to be influenced by seasonality.
In site B, the results show that these acids were highly correlated with CO, suggesting a substantial contribution of the direct emissions from motor vehicles. Different sources, precursors or transformation sequences predominated during winter and spring in site B.
Carboxylic acids originated from atmospheric photochemistry and directly as primary pollutants from exhaust emissions are present in the urban atmosphere of São Paulo City. However, further investigations are still necessary to establish with more accuracy the relative contribution of their formation processes and direct emissions in the atmosphere.
Acknowledgements
This work has been partly supported by grants from FAPESP, Fundação de Amparo à Pesquisa do Estado de São Paulo. S. R. S. thanks CNPq for a graduate fellowship.
References
1. Boubel, R. W.; Fox, D. L.; Turner, B. C.; Stern, C. A.
in Fundamentals of Air Pollution; Academic Press; San Diego; 1994, 3ed., p165-168.
2. Khare, P.; Satsangi, S.; Kumar, N.; Kumari, K. M.; Srivasta, S. S. Atmos. Environ. 1997, 31, 3867. 3. Helas, G.; Bingemer, H.; Andreae, M. O. J. Geophys.
Res. 1992, 97D, 6187.
4. Sanhueza, E.; Santana, M.; Hermoso, M. Atmos. Environ. 1992, 26A, 1421.
5. Grosjean, D. Atmos. Environ. 1990, 24A, 2699. 6. Puxbaum, H.; Rosenberg, C.; Gregori, M.; Lanzerstorfer,
C.; Ober, E.; Winwarter, W. Atmos. Environ. 1988, 22, 2841.
7. Keene, W. C.; Galloway, J. N. J. Geophys. Res. 1986, 91D, 14466.
8. Keene, W. C.; Galloway, J. N. Tellus 1988, 40B, 332. 9. Grosjean, D. Atmos. Environ. 1992, 26A, 3279. 10. Chebbi, A.; Carlier, P. Atmos. Environ. 1996,
24A, 4233.
11. Satsumabayashi, H.; Kurita, H.; Yokouchi, Y.; Ueda, H. Atmos. Environ. 1990, 24A, 1443.
12. Kawamura, K.; Ikushima, K. Environ. Sci. Technol. 1993, 27, 2227.
13. Kawamura, K.; Steinberg, S.; Kaplan, I.C. Atmos. Environ. 1996, 30, 1035.
14. Skov, H.; Egelov, A. H.; Granby, K.; Nielsen, T. Atmos. Environ. 1997, 31, 685.
15. Kawamura, K.; Ng, L.; Kaplan, I. R. Environ. Sci. Technol. 1985, 19, 1082.
16. Grosjean, D. Environ. Sci. Technol. 1989, 23, 1506. 17. Andreae, M. O.; Talbolt, R. W.; Andreae, T. W.;
Harriss, R. C. J. Geophys. Res. 1988, D93, 1616. 18. Jacob, J. D.; Wosfy, C. S. J. Geophys. Res. 1988,
93, 1477.
19. Enders, G.; Dlugi, R.; Steinbrecher, R.; Clement, B.; Daiber, R.; Eijk, S. G.; Haziza, M.; Helas, G.; Herrmann, U.; Kessel, M.; Kesselmeirer, J.; Kotzias, D.; Koutrtidis, K.; Kurth, H.; McMillen, R. T.; Roider, G.; Schürmann, W.; Teichmann, U.; Torres, L. Atmos. Environ. 1992, 26A, 171.
20. Kawamura, K.; Kasube, H.; Barrie L. Atmos. Environ. 1996, 30, 1709.
21. Sanhueza, E. ; Andreae, M. O. Geophys Res. Lett., 1991, 18, 1707.
22. Talbot, R. W.; Beecher, K. M.; Harriss, R. C.; Coffer, III W. R. J. Geophys. Res. 1988, 93D, 1638. 23. Granby, H.; Christensen, C. S.; Lohse, C. Atmos.
Environ. 1997, 31A, 1403.
24. Khwaja, A. H. Atmos. Environ. 1995, 29, 127. 25. Souza, S. R.; Vasconcellos, P. C.; Carvalho, L. R. F.
Atmos. Environ. 1999, 33, 2563.
D. J.; Beecher, K. M. J. Geophys. Res. 1990, 95D, 16799.
27. Kumar, N.; Kulshresestha, U. C.; Saxena, A.; Khare, P.; Kumari, K. M.; Srivasta, S. S. J. Atmos. Chem. 1996, 23, 81.
28. Talbolt, R. W.; Dibb, J. E; Lefer, J. D.; Bradshaw, J. D.; Sandholm, S. T.; Blake, D. R.; Blake, N. J.; Sachse, G. W.; Collins, J.; Heikes, B. G.; Gregory, G. L.; Anderson, B. E.; Singh, H. B.; Thornton, D. C.; Bandy, A. R.; Pueschel, R. F. J. Geophys. Res. 1996, 102, 255
29. CETESB Relatório de Qualidade do Ar no Estado de São Paulo 1996, Série Relatórios, São Paulo.
30. Satsumabayashi, H.; Kurita, H.; Chang, Y.; Carmichael, G.; Ueda, H. Atmos. Environ. 1995, 29A, 255. 31. Granby, K.; Egelov, A. H.; Nielsen, T.; Lohse, C.
J. Atmos. Chem. 1997 28, 195.
32. Winer, M. A; Atkinson, A. R.; Aschmann, S. M.; Long, W. D.; Morrison, L. O. Atmos. Environ. 1992, 26A, 26470.
33. Talbolt, R. W.; Mosher, B. W.; Heikes, B. C.; Jacob, D. J.; Munger, J. W.; Dauce, B. C.; Keene, W. C.; Manbe, J. R.; Artz, R. S. J. Geophys. Res. 1995, 100D, 9335.
34. Grosjean, D. Atmos. Environ. 1988, 22A, 1637. 35. Atkinson, R. Atmos. Environ. 1990, 24, 1.